


Abstract
It is well established that rare mutations in BRCA2 predispose to familial breast cancer, but whether common variants at this locus contribute more modest risk to sporadic breast cancer has not been thoroughly investigated. We performed a haplotype-based study of BRCA2 among women in the Multiethnic Cohort Study (MEC), genotyping 50 SNPs spanning 109.4 kb of the BRCA2 gene. Twenty-one haplotype-tagging SNPs (including seven missense SNPs) were selected to predict the common BRCA2 haplotypes and were genotyped in a breast cancer case–control study nested in the MEC (cases, n=1715; controls, n=2502). Compared to non-carriers, we observed nominally significant positive associations for homozygous carriers of specific haplotypes in blocks 2 (haplotype 2c: OR=1.50; 95% CI, 1.08–2.09) and 3 (haplotype 3d: OR=1.50; 95% CI, 1.01–2.24). These results could be explained on the basis of a single marker in intron 24 (SNP 42: rs206340) that was correlated with these haplotypes and the homozygous state was associated with a significantly increased risk of breast cancer (AA versus GG genotypes: OR=1.59, 95% CI, 1.18–2.16; nominal P=0.005). This association was modestly stronger among women with advanced disease (OR=2.00, 95% CI, 1.30–3.08; P=0.002). In this exploratory analysis, we found little indication that common variation in BRCA2 dramatically impacts sporadic breast cancer risk. However, a significant elevation in risk was observed among ∼6% of women who carried a specific haplotype pattern and may harbor a susceptibility allele at the BRCA2 locus.
INTRODUCTION
Twin studies as well as the familial clustering of cases implicate hereditary factors in breast cancer susceptibility (1–3). The most dramatic evidence for a genetic influence on breast cancer risk comes from the cloning of two genes, BRCA1 and BRCA2 (4,5), associated with rare Mendelian forms of the disease. Although these discoveries have shed valuable insights into understanding breast cancer susceptibility in high-risk families, highly penetrant mutations in these genes account for only a small fraction of all breast cancers (6,7). It has also been suggested that breast cancer risk may be influenced by multiple loci with modest effects (7–9). Given the indisputable link between BRCA1 and BRCA2 and hereditary breast cancer, it is important to evaluate whether more modestly penetrant variants in these genes might contribute to sporadic breast cancer risk.
The human genome is characterized by strong linkage disequilibrium (LD) including areas of low historical recombination [termed ‘haplotype’ blocks (10–12)]. These regions of strong LD have been demonstrated to have low haplotype diversity, with the common haplotypes explaining the majority of common variation across populations (11). Furthermore, these haplotypes can be predicted using only a subset of all available (or known) markers [termed haplotype-tagging SNPs (htSNPs) (13,14)]. Thus, within a defined haplotype block, the analysis of individual common haplotypes as well as their ancestral relationships (i.e. combinations of related haplotypes) should permit the indirect assessment of potential common causal variants that may not have been genotyped. In the present study, we have adopted a haplotype-based approach to study common genetic variation at the BRCA2 locus in relation to breast cancer risk among five racial-ethnic groups in the Multiethnic Cohort Study (MEC).
RESULTS
Characterization of LD and haplotypes at the BRCA2 locus in the MEC multiethnic panel
Using a set of 50 SNPs [average spacing of one common polymorphism every ∼2.2 kb (Table 1; Fig. 1)] we defined three regions of strong LD spanning from 15.8 kb upstream to 9.4 kb downstream of the BRCA2 gene. The block sizes covered 15.9, 30.4 and 45.9 kb for blocks 1–3, respectively, and the distance between each block was <7 kb (see Materials and Methods for block defining criteria). To ensure complete ascertainment of the common haplotypes, each block contained a minimum of six common SNPs with allele frequencies ≥10% in each ethnic group (11) (Table 1). A LD plot for the total population in the multiethnic panel is provided in Figure 2. This SNP map includes seven common missense SNPs that have been reported previously in the BIC database (http://research.nhgri.nih.gov/bic/) and/or the literature (15) (N289H, N372H, M784V, N991D, A2466V, I2490T and I3412V).
In each block, we observed limited haplotype diversity. We observed seven common haplotypes with a frequency ≥5% in at least one ethnic population in blocks 1 and 2, and nine common haplotypes in block 3 (Table 2), and these common BRCA2 haplotypes accounted for at least 80% of all chromosomes in each ethnic group (average diversity accounted for by common haplotypes in the entire population: block 1, 94%; block 2, 91%; block 3, 91%). The majority of these haplotypes were observed to be shared by more than one ethnic group (five of seven in blocks 1 and 2, and six of nine in block 3) with the shared haplotypes accounting for >75% of all chromosomes in these populations. As expected, haplotypes that were not observed in all ethnic groups tended to be less frequent and were usually subtypes of the shared haplotypes. We also observed strong long-range LD between blocks 2 and 3 (average multi-allelic D′=0.89), and a bit weaker (but still significant) LD between blocks 1 and 2 (average multi-allelic D′=0.65). Given the presence of 50 polymorphic markers in ∼110 kb, and the strong LD within and across the blocks, we believe this region to be well characterized with regard to its common variation; this is supported by the R2 and the pairwise r2 calculations below.
We selected 21 of these markers as htSNPs (forcing in seven missense SNPs) that strongly predicted the common haplotypes (≥5% frequency) in each ethnic group in the multiethnic panel (Table 2). The average Rh2 in predicting the common haplotypes across all ethnic groups were 0.90, 0.80 and 0.94 for blocks 1–3, respectively. Given this high Rh2 threshold (0.88 overall), we expected and observed only minor differences in haplotype frequencies predicted solely by the htSNPs versus haplotype frequencies as defined by all of the SNPs in the block (Table 2). The Gabriel et al. (11) criteria that we followed for defining haplotype blocks suggests that the addition of more SNPs to a given block (beyond the six or more used) is unlikely to increase the number of common haplotypes in that block (i.e. additional SNPs will land on one of the pre-existing haplotypes). To assess how well the 21 htSNPs capture unknown common variation across this region, we performed the following analysis: within each block, we dropped one SNP at a time and calculated the correlation (Rs2) between the haplotypes as defined by the htSNPs and the dropped SNP. The average Rs2 for each block was ≥0.96, which indicates that the untested SNPs were highly predicted by the haplotypes formed by the selected htSNPs. To assess how well our htSNPs captured the variation across the region independent of the identified haplotype blocks, we calculated the pairwise correlation between the htSNPs and the other 29 non-htSNPs in each ethnic group. Including the htSNPs, we found that 40 of the 50 SNPs (80%) were predicted in all ethnic groups with an r2≥0.7. In all populations, 46 SNPs (92%) were predicted with an r2≥0.5; only two SNPs (27 and 49) were not predicted with an r2≥0.5 in all populations. On the basis of these analyses, we believe that the chosen tagging SNPs (and the haplotypes they define) provide good predictions of all SNPs assayed in the multiethnic panel in addition to as yet unmeasured common variation in the region.
Associations with common missense SNPs
As missense SNPs may have a higher likelihood of affecting disease risk, we tested them independently (16). All missense SNPs conformed to Hardy–Weinberg equilibrium among cases and controls within each ethnic group (data not shown). We observed no evidence of significant associations between any of the seven missense SNPs and breast cancer risk (Table 3).
BRCA2 haplotype‐associations with sporadic breast cancer risk
Our analyses were based on the common disease-common variant (CDCV) hypothesis and the empirical observations that the majority of common variation is shared across ethnic groups (17,18). A global likelihood ratio test of haplotype effects in each block was performed to assess if the overall distributions of haplotypes differed between cases and controls. The tests were not statistically significant (P≥0.15) and thus, provide little support for the existence of a common disease allele at the BRCA2 locus strongly contributing to sporadic breast cancer risk. As this test focuses on the global distribution of the haplotypes within a block and thus could miss subtler effects of individual haplotypes on breast cancer risk, we also evaluated the effects of individual haplotypes within the blocks. Tests of heterogeneity of the effects across ethnic groups were not statistically significant (P≥0.40), and summary ORs across ethnic groups adjusted for age and ethnicity are presented in Table 4. Within each block, we observed marginal haplotype effects; compared with non-carriers for each haplotype, we observed increased risk for homozygous carriers of haplotype 1d in block 1 (OR=1.40; 95% CI, 0.92–2.13), 2c in block 2 (OR=1.50; 95% CI, 1.08–2.09) and 3d in block 3 (OR=1.50; 95% CI, 1.01–2.24). Associations were also observed for heterozygous carriers of these haplotypes although effects were weaker and did not reach nominal (P<0.05) significance. When limiting the analysis to women with advanced disease (cases, n=447) associations with the rare homozygote class became stronger (versus non-carriers: haplotype 1d: OR=1.69; 95% CI, 0.92–3.10; haplotype 2c: OR=1.97; 95% CI, 1.24–3.12; haplotype 3d: OR=1.97; 95% CI, 1.12–3.46).
We observed strong coupling between the common haplotypes in adjacent blocks (Fig. 1). Specifically, all of the haplotypes that were associated with increased breast cancer risk across the three blocks tended to co-segregate. Haplotype 2c was observed to join almost exclusively with haplotype 1d in block 1 and haplotypes 3d, 3f and 3i in block 3; positive associations were noted for all of these haplotypes in block 3 (Table 4).
The simplest disease model is that a causal SNP arose on a single ancestral haplotype at some point in our history. The causal variant, however, may be observed to lie on multiple haplotypes today, as a result of more recent mutations that have created additional haplotype subtypes within the same clade. With this framework in mind, we next evaluated combinations of haplotypes with similar ancestral relationships (see Materials and Methods). No groupings of related haplotypes in blocks 1 or 2 were significantly associated with increased risk (data not shown). However, in block 3 homozygosity for the related haplotype combination, 3d, 3f and 3i, was strongly associated with increased risk (versus non-carriers of these haplotypes: OR=1.50; 95% CI, 1.10–2.05; P=0.01; among cases with advanced breast cancer: OR=1.85; 95% CI, 1.18–2.89; P=0.007).
A htSNP located in intron 24 (SNP 42; rs206340) was observed to travel exclusively on haplotypes 3d, 3f and 3i in block 3, and testing its effect individually was equivalent to testing this combination of highly related haplotypes. Relative to women with the common homozygote genotype (GG), women carrying the AA genotype of SNP 42 (frequency range, 3–6% across ethnic groups) were at significantly increased risk of breast cancer (OR=1.59; 95% CI, 1.18–2.16; P=0.005). The association was greater among women with advanced disease (OR=2.00; 95% CI, 1.30–3.08; P=0.002). Nominally significant positive associations were also observed with SNPs that were highly correlated with SNP 42 in the multiethnic panel (SNPs 9, 26, 39 and 43; r2>0.60), and which defined the same block specific and haplotype combinations that were positively associated with risk (data not shown). SNP 39 was an exact proxy for SNP 42. The inclusion of SNPs 9, 26 and 43 in the regression model containing SNP 42 did not alter the fit of the model, nor did they explain the association observed with SNP 42; following adjustment for these SNPs, the OR associated with SNP 42 was 1.62 (95% CI, 0.98–2.66). Furthermore, as may be expected for a SNP with modest effect, SNP 42 did not appear to explain any of the familial risk of breast cancer in these populations; the OR for family history (1.7) was unaltered following adjustment for SNP 42 genotype.
To help determine whether the nominally statistically significant association with SNP 42 was real, or just a statistical fluctuation, we performed permutation testing. We permuted the case–control status at random for each of the 21 htSNPs 1000 times and evaluated the distribution of the minimum P-values associated with each genotype class (versus the homozygous reference genotype class) from each permutation (see Materials and Methods for additional details). The permutation-based P-value associated with SNP 42 did not achieve statistical significance (P-value=0.115).
DISCUSSION
BRCA2 participates in critical cellular processes including the maintenance of genomic integrity following DNA damage and transcriptional regulation (19). Rare, highly penetrant germ-line mutations in this gene strongly predispose women to breast and ovarian cancer. However, it remains an open question, whether more common variation at this locus contributes to a larger fraction of disease risk in the population (i.e. sporadic disease). BRCA2 has also been implicated in sporadic breast cancer tumorigenesis as certain missense variants have been shown to confer an increased risk of developing breast cancer (15,20,21). Although large numbers of rare polymorphisms and variants of unknown function have been identified in BRCA2 (BIC database, http://research.nhgri.nih.gov/bic/), a comprehensive investigation of common variation and its association with sporadic breast cancer risk has not previously been performed. In this study, we utilized a haplotype-based approach to examine the contribution of common genetic variation at the BRCA2 locus to sporadic breast cancer risk in a large multiethnic population. We found modest positive associations with both individual haplotypes spanning the BRCA2 locus, as well as with haplotype combinations and individual SNPs that reside exclusively on these haplotypes.
Until recently, genetic association studies of candidate cancer susceptibility genes have tested only limited numbers of SNPs throughout each locus, focusing primarily on those SNPs likely to be functional (i.e. missense SNPs). The sequencing of the human genome and subsequent discovery of millions of SNPs, together with advances in genotyping capabilities and knowledge of LD block patterns in the genome, provide a framework for comprehensive and systematic investigations of common variation underlying common traits. In this study, we defined common genetic variation across the BRCA2 locus using a dense set of 50 common SNPs, spaced every 2.2 kb on average. The process of empirically defining LD blocks prior to haplotype estimation is intended to ensure that common variation within each block is adequately captured, as a previous study has shown that, within regions of strong LD, more than 90% of the diversity of common haplotypes (>5%) may be captured by 6–8 common SNPs [≥10% (11)]. On the basis of this observation, we required a minimum of six SNPs (≥10%) per block in all ethnic groups and included all SNPs (≥5%) to define the underlying haplotypes in each population. Although it is likely that we missed low-frequency haplotypes that are subtypes of the major haplotype patterns that we observed, our main aim was to describe and study the effects of the common haplotypes as well as combinations of ancestrally related haplotypes in each block.
In a preliminary study of the LD structure across 111 kb spanning the BRCA2 locus Bonnen et al. (22) genotyped eight common SNPs (≥5% in all ethnic groups, spaced every 11.6 kb on average) among 48 of each African Americans, Asian Americans, Hispanic Americans and European Americans. Thirty-four haplotypes were estimated, and five of these haplotypes were shared and accounted for a high percentage of all chromosomes in each population (49–66%). As stated above, a critical goal of candidate gene association studies is to adequately capture the underlying variation at a locus in order to identify a causal allele, if one exists. With the algorithm we employed (see Materials and Methods), we felt confident that the haplotypes defined represented an informative set of haplotypes in each block (i.e. addition of more SNPs would not create additional common haplotypes within a block). To explore how well randomly selected sets of SNPs perform in capturing common haplotypic variation across the BRCA2 locus, we compared these random sets against the haplotypes we defined in each block. We evaluated the Rh2 values for predicting the common haplotypes in all three blocks using eight common SNPs selected randomly across the BRCA2 locus. Choosing 1000 sets of eight SNPs (evenly spaced) from among the 27 common SNPs used in this analysis (≥5% in all ethnic groups), the average Rh2 value in these five populations was 0.43, suggesting that using only eight SNPs does not fully predict common haplotype variation in these ethnic groups. Although some random sets performed better than others in predicting the common haplotypes (range of average Rh2 values: 0.18–0.69) it is impossible to a priori identify which set will most thoroughly capture the underlying diversity in the absence of following some validated heuristic (i.e. haplotype blocks). Thus, choosing an arbitrary number of SNPs to define the haplotypes across candidate genes without using empirically validated methods may limit the generalizability of results.
Previous studies have reported positive associations with two common missense variants in BRCA2. The HH genotype of the N372H polymorphism has been associated with an ∼1.3–1.5-fold increase in risk in a number of different Caucasian populations (20,21). Although our study in a multiethnic population was larger than any of the previous individual studies, we were unable to replicate these findings. However, we had only ∼50% power to detect a RR as low as 1.3 for the HH genotype. Recently, the M784V polymorphism was associated with increased risk in a small study among Japanese women (15). We observed no association with this missense SNP, nor did we observe strong evidence of positive associations with any of the other five common missense polymorphisms.
Our data suggest that common variation in BRCA2 does not play a major role in sporadic breast cancer risk. We observed, however, modest positive associations with co-segregating haplotypes in blocks 1–3, the ancestrally related haplotypes 3d, 3f and 3i, and multiple SNPs that resided on this haplotype pattern. When testing only individual haplotypes, a dilution in risk for specific haplotypes may be observed if a causal (or proxy) SNP resides on a number of closely related haplotypes of the same clade. This was suggested in our data as the significance of the association observed with SNP 42 and the haplotype combination 3d, 3f and 3i was modestly greater than the independent effects of haplotypes 3d, 3f or 3i. As expected, we also observed positive associations with SNPs that mark this haplotype pattern and that were correlated with SNP 42, however, the effects for these SNPs were not greater than what we observed with SNP 42. On the basis of the location of SNP 42 in intron 24, it is unlikely to be a disease predisposing SNP. If a causal variant exists at the BRCA2 locus, our data suggest that SNP 42 may serve as a proxy for this variant and that it may lie on the particular haplotype pattern comprised of haplotypes 3d, 3f and 3i. On the basis of the average frequency of the AA genotype of SNP 42 (≤6%), the causal allele could explain, at most, 3.4% of breast cancer among postmenopausal women in the general population (assuming SNP 42 is an exact proxy). The P-value we observed with SNP 42, however, was nominally significant (P=0.005) uncorrected for the multiple tests performed. To further guide interpretation of this result, we performed permutation testing, which did reveal that this association may be spurious (P=0.115). In addition, applying the false-positive report probability criteria as described by Wacholder et al. (23), we estimated the likelihood that this signal is a false-positive to be 46% (assuming a prior probability of 0.01, which is reasonable for a gene with an established role in breast cancer susceptibility).
In this study, we had 96% statistical power to detect an RR of 1.35 for a dominant allele with a frequency of 0.1 (assuming an Rh2 of 0.9) and 70% power to detect an RR of 2.0 for a recessive allele with a frequency of 0.1. Within each ethnic group we had 78–82% power to detect an RR of 1.6 (except native Hawaiians, RR=2.0; power, 74%). Thus, there remains the possibility that we missed important associations with ethnic-specific variants that display modest effects (RR<1.6) as well as variants that may be differentially penetrant in these populations owing to epistatic interactions with other genes. However, our study was specifically designed to assess whether common shared variation is associated with sporadic breast cancer and larger studies will be needed to assess the role of ethnic-specific and/or rare variants with modest effects.
Population stratification can produce biased estimates of association between a genetic risk factor and disease solely due to differences in allele frequencies between ancestral populations. We believe that exploring genetic effects in a multiethnic population sampled from a well-defined source populations helps to avoid the bias incurred by population stratification. Although it is formally possible that population stratification could influence our results, we find it unlikely as we observed a consistent positive trend in SNP 42 across all ethnic groups. If this result was due to stratification, one would have to invoke that population stratification occurred in each ethnic group.
The strengths of our study are the large sample size, and the utilization of a comprehensive approach for studying common variation in this established breast cancer susceptibility gene. There are currently >400 SNPs spanning the BRCA2 locus in the dbSNP database (http://www.ncbi.nih.gov/SNP/), however, we only needed to test a subset to characterize the common variation at this locus. Given the established role of rare mutations in BRCA2 in hereditary breast cancer, it is noteworthy that common variants do not seem to play a substantial role in sporadic breast cancer. Further research in even larger sample sizes such as the NCI's Cohort Consortium of Breast and Prostate Cancer, which will include over 6000 cases of breast cancer, will be needed to test the hypothesis that rare variation in BRCA2 alters susceptibility to sporadic breast cancer.
MATERIALS AND METHODS
The multiethnic cohort
The MEC consists of over 215 000 men and women in Hawaii and Los Angeles (with additional African Americans from elsewhere in California) and has been described in detail elsewhere (24). In brief, the cohort is comprised predominantly of a general population sample of native Hawaiians, Japanese and whites in Hawaii, and African Americans, Japanese and Latinos in Los Angeles. Between 1993 and 1996, participants entered the MEC by completing a 26-page self-administered mail questionnaire that asked detailed information about dietary habits, demographic factors, personal behaviors, history of prior medical conditions, family history of common cancers, and for women, reproductive history and exogenous hormone use. The participants were between the ages 45 and 75 when they entered the cohort.
Incident cancers in the MEC are identified by cohort linkage to population-based cancer Surveillance, Epidemiology and End Results (SEER) registries covering Hawaii and Los Angeles County, and to the California State cancer registry covering all of California. Information on stage of disease at the time of diagnosis is also collected from the cancer registries; women were classified as having advanced breast cancer when there was evidence of dissemination beyond the breast at diagnosis (stage ≥2).
Beginning in 1994, blood samples were collected from incident breast cancer cases. At this time, blood collection was also initiated in a random sample of MEC participants to serve as a control pool for genetic analyses in the cohort. The participation rates for providing a blood sample were 74 and 66% for cases and controls, respectively. Eligible cases in this nested breast cancer case–control study consisted of women with incident breast cancer (including second primaries) diagnosed after enrollment in the MEC through May 31, 2003. Controls were women without breast cancer prior to entry into the cohort and without a diagnosis up to May 31, 2003. The breast cancer case–control study consists of 1715 invasive breast cancer cases and 2602 controls and was approved by the Institutional Review Boards at the University of Southern California and at the University of Hawaii.
Characterizing LD and haplotypes
We implemented a haplotype-based approach to examine common variation throughout the BRCA2 gene as described in detail previously (25). We initially surveyed common genetic variation across 109.4 kb of the BRCA2 gene, covering 15.8 kb upstream though 9.4 kb downstream of the transcribed region using markers from the public SNP map. Our goals were to acquire a common SNP (minor allele frequency ≥10%) spaced every ∼5 kb, on average, obtain >6 common SNPs (≥10% frequency) per LD block, and minimize the distance between adjacent blocks to <10 kb. Several iterations of SNP selection and genotyping were required to obtain this high-density SNP coverage. We genotyped 71 SNPs across the locus selected from the National Center of Biotechnology Information SNP database (http://www.ncbi.nlm.nih.gov/SNP/) and the Celera variation database (http://www.celera.com). We also assessed allele frequencies of 25 missense variants reported in the BIC database (http://research.nhgri.nih.gov/bic/) and/or the literature (15). SNPs were genotyped in a multiethnic panel of 349 women in the MEC without a history of cancer (n=69–70 per ethnic group). This sample size guaranteed that any haplotype with a frequency of ≥5% will be represented at least once among the 140 chromosomes with probability >99%. Of the 96 SNPs genotyped, 33 were monomorphic or had minor allele frequencies <5% in all ethnic groups and 13 assays provided poor genotyping results (i.e. >30% failure rate or genotype frequencies were out of Hardy–Weinberg equilibrium in >1 ethnic group). This left 50 SNPs with minor allele frequencies ≥5% in at least one ethnic group (average spacing ∼2.2 kb) and 27 SNPs with minor allele frequencies ≥5% in all ethnic groups (average spacing ∼4.1 kb). Of these 50 SNPs, seven were common missense variants (frequencies ≥5% in at least one ethnic group: N289H, N372H, M784V, N991D, A2466V, I2490T and I3412V).
The |D′| and r2 statistics were used to assess pairwise LD between SNPs as described (26,27). LD block structure was examined using the 90% confidence bounds of D′ to define sites of historical recombination between SNPs with minor allele frequencies ≥10%. (11). We observed the LD structure across BRCA2 to be quite highly conserved between ethnic groups, and thus, we defined LD block boundaries on the basis of the entire multiethnic sample. A comparison of this approach with that of defining LD blocks separately for each ethnic group had no effect on enumerating the underlying common haplotypes in each ethnic population. Long range LD between blocks (i.e. haplotype exchange between the blocks) was assessed by a multi-allelic D′ score (28).
Haplotype construction and HtSNP selection
Haplotype frequency estimates were constructed from the genotype data in the multiethnic panel (one ethnicity at a time) within LD blocks using the expectation-maximization (E-M) algorithm of Excoffier and Slatkin (29). We included SNPs with minor allele frequencies as low as 5% to better describe the diversity of the common haplotypes in each block for each population (SNPs included: block 1, n=7; block 2, n=10–15; block 3, n=13–17). The squared correlation (Rh2) between the true haplotypes (h) and their estimates were then calculated as described (14). htSNPs for the case–control study were chosen by finding the minimum set of SNPs (within a block) which would have Rh2≥0.7 for all haplotypes with an estimated frequency of ≥5%. We included all missense SNPs as htSNPs before minimizing the number of htSNPs required to predict the common haplotypes. The calculation of Rh2 is described in detail by Stram et al. (2003) and a computer program (tagSNPs) for the calculation is available at D. Stram's website (http://www-rcf.usc.edu/∼stram).
In addition, to assess the completeness in which we surveyed common variation across the region, we calculated the multivariate squared correlation, Rs2 (14), between each measured SNP and the haplotype structure as predicted by the htSNPs in each block (i.e. individual haplotypes or haplotype combinations). A high value of Rs2 provides reassurance that unmeasured SNPs are also likely to be highly correlated with the haplotype structure in BRCA2, and that the htSNPs provide good prediction of unmeasured SNPs.
Comparison of missense SNPs and haplotype frequencies between cases and controls
We first evaluated associations with the missense SNPs and the common haplotypes within each block. As a common disease associated variant may be carried on multiple haplotypes within the same clade, we also evaluated combinations of haplotypes with similar ancestral relationships (P. Bretsky et al., manuscript in preparation). Haplotype frequencies among breast cancer cases and controls were estimated using the htSNPs selected to distinguish the common haplotypes (≥5% frequency) for each ethnic group in the multiethnic panel as described (25). We first performed global likelihood ratio tests to test whether the frequency distributions of the common haplotypes within each block differed between cases and controls. When the global test was not significant, associations with independent haplotypes were considered suggestive; in general, the global test mitigates the need to perform a bonferroni correction of the P-values for the independent haplotype effects in each block. Odds ratios and 95% CIs were estimated for each haplotype and missense SNP using unconditional logistic regression. Associations with SNPs and haplotypes were examined in ethnic-stratified analyses, and summary ORs are presented adjusted for ethnicity and age. Tests of heterogeneity of effects across ethnic groups were performed by a likelihood ratio analysis following the inclusion of an interaction term between the risk haplotype (or SNP) and ethnicity in the multivariate model. All results were similar when adjusting for the established breast cancer risk factors (30): first-degree family history of breast cancer, body mass index, parity, age at first birth, age at menarche, menopausal status, type of menopause, age at menopause, use of hormone replacement therapy and alcohol consumption. We performed permutation testing to further assess the nominally statistically significant associations observed with individual SNPs. Case–control status was randomly permuted within ethnic group 1000 times for each of the 21 htSNPs. The nominal P-values associated with independent SNPs were then re-evaluated in relation to the distribution of the minimum P-values associated with each genotype class (versus the homozygous reference genotype class) from each permutation (e.g. if a nominal P-value of 0.05 marked the 25th percentile of this distribution, then the permutation P-value would be 0.25). We used the Statistical Analysis System for all analyses (SAS Institute Inc., Cary, NC, USA, Version 8.2).
Genotyping
DNA for the multiethnic panel, breast cancer cases and controls was extracted from white blood cell fractions using the Qiagen Blood Kit (Qiagen, Chatsworth, CA, USA). Genotyping was performed by time-of-flight mass spectrometry (MALDI-TOF) using the Sequenom platform at the Whitehead Institute/MIT Center for Genome Research and by the 5′ nuclease Taqman allelic discrimination assay using the ABI 7900 (Applied Biosystems, Foster City, CA, USA) in the USC-MEC Genotyping Laboratory. One hundred samples had high genotype failure rates owing to low DNA concentration/quality and were removed from all analyses. Replicate blinded quality control samples were included to assess reproducibility of the genotyping procedure; concordance was >99.6% in the multiethnic panel and in the case–control study.
ACKNOWLEDGEMENTS
We thank Loreall Pooler, David Wong and Stephanie Riley for their laboratory assistance and Dr Kristine Monroe for her support with the study design. We also thank Stuart Wugalter for preparing figures for this manuscript. We are most indebted to the participants of the Multiethnic Cohort Study for their participation and commitment. M.L.F. is supported by a Howard Hughes Physician Postdoctoral Fellowship. This work was supported by funds provided by the California Breast Cancer Research Program, Grant Number 9KB-0006, and a General Motors Cancer Research Scholar's Grant awarded to C.A.H.
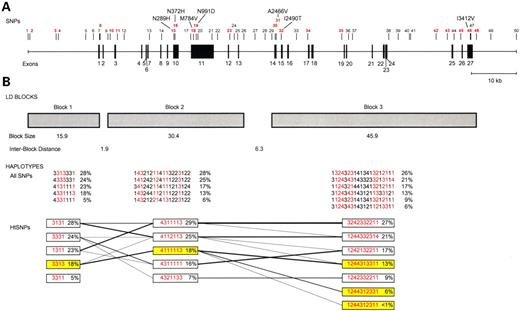
Figure 1. The genomic organization of BRCA2. (A) The 50 SNPs used in the haplotype analysis. SNP location is based on the July 2003 genome assembly of chromosome 13 (contig NT_024524.396, http://genome.ucsc.edu). htSNPs for each block are indicated in red. (B) LD block and haplotype patterns across BRCA2. Presented are the common haplotypes (≥5%) estimated using all SNPs among all ethnic groups combined. htSNP haplotypes highlighted in yellow indicate the risk-associated haplotypes in each block. The lines between blocks link haplotypes that are transmitted across the blocks. The numbers for each SNP correspond to the nucleotide at that position (1, A; 2, C; 3, G; 4, T).
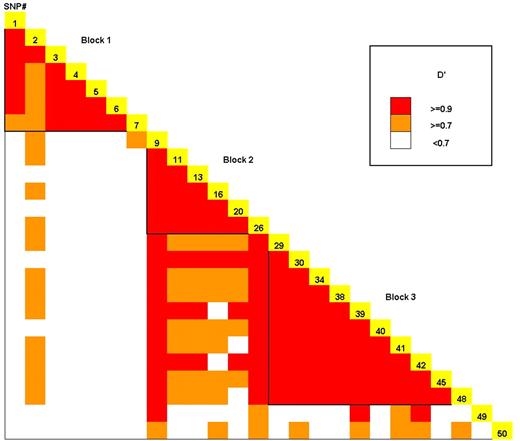
Figure 2. The LD plot of BRCA2 for all ethnic groups combined. LD strength between the 25 SNPs with a frequency ≥10% in all ethnic groups is determined by the D′ statistic.
Fifty SNPs used in the haplotype analysis of BRCA2
| SNP no. | SNP ID | Positiona | Minor | Minor allele %; ethnicityc | ||||
|---|---|---|---|---|---|---|---|---|
| alleleb | AA | NH | JA | LA | WH | |||
| 1 | rs206128 | 30671844 | G | 26 | 17 | 25 | 28 | 38 |
| 2 | rs2013080 | 30672234 | A | 20 | 37 | 26 | 25 | 20 |
| 3 | rs206142 | 30678046 | A | 29 | 18 | 26 | 28 | 37 |
| 4 | rs206143 | 30678626 | A | 37 | 58 | 49 | 44 | 40 |
| 5 | rs176179 | 30684741 | A | 34 | 54 | 47 | 42 | 38 |
| 6 | rs206116 | 30686483 | A | 38 | 59 | 51 | 46 | 40 |
| 7 | rs206118 | 30687792 | G | 14 | 21 | 24 | 19 | 18 |
| 8 | rs206119 | 30687968 | G | 39 | 13 | 5 | 24 | 21 |
| 9 | rs206120 | 30689706 | G | 19 | 12 | 18 | 19 | 17 |
| 10 | rs206121 | 30690217 | C | 9 | 0 | 0 | 1 | 0 |
| 11 | hCV11763984 | 30691791 | A | 47 | 42 | 41 | 48 | 49 |
| 12 | rs206123 | 30693377 | G | 9 | 0 | 0 | 1 | 0 |
| 13 | hCV3070441 | 30698933 | A | 25 | 43 | 57 | 29 | 34 |
| 14 | rs2126042 | 30701685 | T | 17 | 8 | 2 | 20 | 14 |
| 15 | rs766173(N289H) | 30704480 | C | 2 | 3 | 17 | 10 | 5 |
| 16 | rs144848(N372H) | 30704729 | C | 15 | 33 | 22 | 28 | 31 |
| 17 | rs2320236 | 30708328 | C | 21 | 13 | 3 | 24 | 19 |
| 18 | M784V | 30708842 | G | 0 | 1 | 7 | 0 | 0 |
| 19 | rs1799944(N991D) | 30709463 | G | 3 | 2 | 17 | 8 | 5 |
| 20 | rs1801406(K1132K) | 30709888 | G | 22 | 38 | 39 | 20 | 29 |
| 21 | rs206076(V2171V) | 30713005 | G | 9 | 0 | 0 | 1 | 0 |
| 22 | rs206077 | 30714297 | A | 12 | 9 | 15 | 11 | 6 |
| 23 | hCV3070435 | 30716967 | A | 25 | 13 | 3 | 24 | 18 |
| 24 | rs206078 | 30718016 | G | 8 | 0 | 0 | 1 | 0 |
| 25 | rs206080 | 30718844 | T | 7 | 0 | 0 | 1 | 0 |
| 26 | rs206081 | 30720136 | T | 22 | 14 | 18 | 19 | 16 |
| 27 | hCV3070431 | 30722647 | C | 2 | 10 | 7 | 3 | 5 |
| 28 | rs721185 | 30724944 | G | 3 | 2 | 18 | 8 | 5 |
| 29 | rs1460816 | 30726408 | G | 46 | 47 | 40 | 49 | 50 |
| 30 | rs1799955(S2414S) | 30727232 | G | 22 | 36 | 39 | 19 | 21 |
| 31 | rs169547(A2466V) | 30727387 | T | 9 | 0 | 0 | 1 | 0 |
| 32 | I2490T | 30728598 | C | 1 | 0 | 1 | 7 | 1 |
| 33 | rs206098 | 30731937 | A | 11 | 0 | 0 | 1 | 0 |
| 34 | hCV3070421 | 30734646 | T | 45 | 46 | 40 | 48 | 51 |
| 35 | hCV3070418 | 30742098 | A | 24 | 14 | 3 | 26 | 24 |
| 36 | hCV3070417 | 30743537 | T | 22 | 13 | 3 | 24 | 23 |
| 37 | rs206068 | 30744415 | C | 9 | 0 | 0 | 1 | 0 |
| 38 | hCV3070410 | 30752561 | G | 46 | 46 | 41 | 49 | 51 |
| 39 | rs206146 | 30754757 | A | 23 | 18 | 24 | 21 | 20 |
| 40 | rs2238162 | 30757199 | C | 50 | 46 | 41 | 49 | 51 |
| 41 | rs542551 | 30757534 | G | 13 | 28 | 18 | 27 | 31 |
| 42 | rs206340 | 30763310 | A | 22 | 18 | 24 | 20 | 20 |
| 43 | rs206342 | 30765809 | G | 4 | 14 | 19 | 9 | 20 |
| 44 | rs206343 | 30767248 | G | 4 | 14 | 19 | 9 | 19 |
| 45 | rs1012129 | 30768736 | G | 49 | 47 | 41 | 48 | 51 |
| 46 | rs1801426(I3412V) | 30770884 | G | 11 | 4 | 4 | 11 | 1 |
| 47 | rs15869 | 30771012 | C | 4 | 15 | 20 | 9 | 18 |
| 48 | rs1148321 | 30772288 | T | 15 | 29 | 18 | 27 | 30 |
| 49 | rs1207952 | 30775496 | A | 38 | 33 | 45 | 52 | 41 |
| 50 | rs472817 | 30781250 | G | 34 | 41 | 25 | 53 | 56 |
aPosition is based on the July 2003 genome assembly of chromosome 13 (contig NT_024524.396, http://genome.ucsc.edu).
bThe minor allele among African Americans.
cAA, African Americans; NH, Native Hawaiians; JA, Japanese; LA, Latinas; WH, whites.
Haplotype percentages in LD blocks 1–3 across BRCA2
| Full haplotypes | htSNP | Full haplotypes % (htSNP haplotypes, %)a; ethnicityb | |||||
|---|---|---|---|---|---|---|---|
| haplotypes | AA | NH | JA | LA | WH | ||
| Block 1c | |||||||
| 1a | 3313331 | 3131 | 25(29) | 17(18) | 27(27) | 29(28) | 36(37) |
| 1b | 4333331 | 3331 | 23(25) | 22(24) | 21(23) | 23(26) | 23(23) |
| 1c | 4131111 | 1311 | 11(11) | 35(36) | 21(21) | 24(23) | 20(20) |
| 1d | 4331113 | 3313 | 13(14) | 20(20) | 18(18) | 17(19) | 16(18) |
| 1e | 4331111 | 3311 | 14(13) | 5(6) | |||
| 1f | 4133331 | 1331 | 9(8) | ||||
| 1g | 4131113 | 1313 | 5(6) | ||||
| Totald | 95(100) | 94(98) | 97(100) | 93(96) | 95(98) | ||
| Rh2 e | 0.81 | 0.92 | 0.94 | 0.89 | 0.90 | ||
| Block 2f | |||||||
| 2a | 143212114113223122 | 4311113 | 22(24) | 38(37) | 32(32) | 21(22) | 29(28) |
| 2b | 141242124111223122 | 4112113 | 15(15) | 32(31) | 23(23) | 25(26) | 31(30) |
| 2c | 341242114111213124 | 4111113 | 19(24) | 12(12) | 18(19) | 19(18) | 16(18) |
| 2d | 143244112111221122 | 4311111 | 21(25) | 10(13) | 17(22) | 15(18) | |
| 2e | 143212214131223122 | 4321133 | 17(17) | 6(8) | 4(5) | ||
| 2f | 121342114111323342 | 2111113 | 8(9) | ||||
| 2g | 143212114313223122 | 4311313 | 6(6) | ||||
| Total | 85(97) | 92(93) | 96(97) | 88(96) | 95(99) | ||
| Rh2 | 0.78 | 0.71 | 0.95 | 0.72 | 0.85 | ||
| Block 3g | |||||||
| 3a | 13243231413413212111 | 3242332211 | 19(22) | 36(36) | 38(38) | 18(18) | 21(21) |
| 3b | 31243431433233213114 | 1244332314 | 11(14) | 28(28) | 16(16) | 19(19) | 29(29) |
| 3c | 11243214413413212111 | 1242132211 | 21(22) | 12(13) | 24(26) | 24(24) | |
| 3d | 31243431431211333121 | 1244313311 | 14(14) | 19(19) | 9(9) | 19(19) | |
| 3e | 11243231413413212111 | 1242332211 | 7(8) | 18(18) | 9(8) | ||
| 3f | 31243431431211213311 | 1244312331 | 10(10) | 11(11) | |||
| 3g | 31223431433233213114 | 1224332314 | 7(7) | ||||
| 3h | 31441431233213213111 | 1444332311 | 9(9) | ||||
| 3i | 31243431431211213111 | 1244312311 | 6(6) | ||||
| Total | 83(91) | 90(91) | 91(91) | 96(98) | 93(93) | ||
| Rh2 | 0.82 | 0.93 | 1.00 | 0.95 | 1.00 | ||
aHaplotypes observed with ≥0.05 frequency in at least one ethnic group in the multiethnic panel.
bAA, African Americans; NH, Native Hawaiians; JA, Japanese; LA, Latinas; WH, whites.
cFull haplotypes, SNPs (1–7); htSNP haplotypes, htSNPs 2,3,4,7.
dThe percentage of all chromosomes accounted for by the common haplotypes.
eThe Rh2 that is given is the minimum Rh2 of the common haplotypes in each ethnic group.
fFull haplotypes, SNPs (9–26); htSNP haplotypes, htSNPs 10,11,15,16,18,19,23.
gFull haplotypes, SNPs (29–48); htSNP haplotypes, htSNPs 30,31,32,34,35,42,43,45,46,48.
Association between BRCA2 missense SNPs and breast cancer risk
| SNP no. | Position | Minor | Minor allele percentages among cases/controls (%)b,c | OR (95% Cl)d | ||||
|---|---|---|---|---|---|---|---|---|
| allelea | AA (n=362/658) | NH (n=115/296) | JA (n=453/422) | LA (n=359/680) | WH (n=426/446) | Carriers versus non-carriers | ||
| 15 | N289H | H | 3/2 | 3/4 | 12/13 | 5/7 | 3/4 | 0.87 (0.71–1.06) |
| 16 | N372H | H | 14/14 | 33/31 | 19/22 | 30/28 | 27/31 | 0.92 (0.80–1.06); 0.99 (0.76–1.30)e |
| 18 | M784A | M | 10/10 | 0.97 (0.69–1.36) | ||||
| 19 | N991D | N | 6/4 | 3/4 | 12/13 | 5/7 | 3/4 | 0.90 (0.74–1.09) |
| 31 | A2466V | A | 6/6 | 0.89 (0.59–1.33) | ||||
| 32 | I2490T | I | 8/8 | 1.03 (0.72–1.48) | ||||
| 46 | I3412V | I | 11/11 | 2/2 | 3/2 | 7/6 | 1.07 (0.87–1.34) | |
aAmong African American controls.
bAA, African Americans; NH, Native Hawaiians; JA, Japanese; LA, Latinas; WH, whites.
cMinor allele frequencies >1% are shown.
dORs are estimated using logistic regression adjusted for age and ethnicity. Calculated among groups shown.
eRare homozygotes versus common homozygotes.
Associations between BRCA2 haplotypes and breast cancer risk
| htSNP Haplotypes | Haplotype % (cases/controls)a,b | OR (95% CI)c | ||||||
|---|---|---|---|---|---|---|---|---|
| AA (n=362/658) | NH (n=115/296) | JA (n=453/422) | LA (n=359/680) | WH (n=426/446) | Heterozygous versus homozygous | Rare homozygous versus homozygous | ||
| Block 1d | ||||||||
| 1a | 3131 | 21/23 | 21/20 | 21/25 | 27/26 | 39/39 | 0.95 (0.83–1.09) | 0.92 (0.73–1.18) |
| 1b | 3331 | 30/29 | 24/25 | 20/20 | 28/29 | 20/22 | 0.98 (0.85–1.12) | 0.94 (0.72–1.22) |
| 1c | 1311 | 13/13 | 35/36 | 25/25 | 35/32 | 19/20 | 1.00 (0.87–1.15) | 1.10 (0.85–1.44) |
| 1d | 3313 | 13/12 | 15/15 | 14/13 | 16/16 | 19/17 | 1.04 (0.90–1.20) | 1.40 (0.92–2.13) |
| 1e | 3311 | 13/11 | 7/7 | 0.92 (0.73–1.17) | 0.56 (0.17–1.85) | |||
| 1f | 1331 | 12/10 | 1.26 (0.91–1.75) | 0.75 (0.20–2.80) | ||||
| 1ge | 1313 | |||||||
| Block 2f | ||||||||
| 2a | 4311113 | 29/28 | 39/40 | 37/35 | 23/24 | 31/28 | 1.00 (0.87–1.14) | 1.17 (0.93–1.47) |
| 2b | 4112113 | 14/14 | 34/30 | 19/22 | 29/28 | 26/30 | 0.93 (0.81–1.07) | 0.99 (0.75–1.30) |
| 2c | 4111113 | 25/23 | 17/13 | 16/15 | 18/17 | 21/18 | 1.08 (0.94–1.25) | 1.50 (1.08–2.09) |
| 2d | 4311111 | 20/23 | 6/10 | 5/5 | 23/23 | 18/18 | 0.87 (0.74–1.01) | 1.01 (0.70–1.44) |
| 2e | 4321133 | 3/2 | 3/4 | 12/13 | 5/7 | 3/7 | 0.86 (0.70–1.06) | 0.43 (0.13–1.38) |
| 2f | 2111113 | 6/7 | 0.77 (0.52–1.14) | 1.43 (0.38–5.36) | ||||
| 2g | 4311313 | 10/10 | 0.99 (0.70–1.40) | 0.95 (0.30–2.98) | ||||
| Block 3g | ||||||||
| 3a | 3242332211 | 21/21 | 36/37 | 46/44 | 20/19 | 22/21 | 0.97 (0.84–1.11) | 1.20 (0.95–1.53) |
| 3b | 1244332314 | 16/16 | 22/21 | 17/19 | 19/20 | 26/26 | 0.87 (0.75–0.99) | 1.19 (0.87–1.61) |
| 3c | 1242132211 | 17/21 | 9/11 | 5/5 | 27/26 | 25/25 | 0.89 (0.77–1.03) | 1.09 (0.79–1.52) |
| 3d | 1244313311 | 6/5 | 25/21 | 16/15 | 12/11 | 22/20 | 1.09 (0.93–1.27) | 1.50 (1.01–2.24) |
| 3e | 1242332211 | 9/10 | 3/5 | 12/14 | 6/8 | 3/5 | 0.83 (0.69–0.99) | 0.97 (0.44–2.13) |
| 3f | 1244312331 | 10/9 | 3/2 | 7/6 | 1.06 (0.84–1.33) | 2.36 (0.74–7.54) | ||
| 3g | 1224332314 | 8/8 | 1.05 (0.74–1.47) | 0.51 (0.10–2.51) | ||||
| 3h | 1444332311 | 6/6 | 0.84 (0.57–1.24) | 0.45 (0.05–4.05) | ||||
| 3i | 1244312311 | 6/5 | 0.95 (0.63–1.43) | 1.99 (0.39–10.21) | ||||
aHaplotypes observed with ≥2.5% frequency among cases or controls in at least one ethnic group.
bAA, African Americans; NH, Native Hawaiians; JA, Japanese; LA, Latinas; WH, whites.
cORs are estimated using logistic regression adjusted for age and ethnicity.
dhtSNP Haplotypes, htSNPs 2,3,4,7.
e<2.5% among cases and controls in all ethnic groups.
fhtSNP Haplotypes, htSNPs 10,11,15,16,18,19,23.
ghtSNP Haplotypes, htSNPs 30,31,32,34,35,42,43,45,46,48.
References
Eby, N., Chang-Claude, J. and Bishop, D.T. (
Lichtenstein, P., Holm, N.V., Verkasalo, P.K., Iliadou, A., Kaprio, J., Koskenvuo, M., Pukkala, E., Skytthe, A. and Hemminki, K. (
Peto, J. and Mack, T.M. (
Miki, Y., Swensen, J., Shattuck-Eidens, D., Futreal, P.A., Harshman, K., Tavtigian, S., Liu, Q., Cochran, C., Bennett, L.M., Ding, W. et al. (
Wooster, R., Bignell, G., Lancaster, J., Swift, S., Seal, S., Mangion, J., Collins, N., Gregory, S., Gumbs, C. and Micklem, G. (
Easton, D.F. (
Pharoah, P.D., Antoniou, A., Bobrow, M., Zimmern, R.L., Easton, D.F. and Ponder, B.A. (
Antoniou, A.C., Pharoah, P.D., McMullan, G., Day, N.E., Ponder, B.A. and Easton, D. (
Cui, J., Antoniou, A.C., Dite, G.S., Southey, M.C., Venter, D.J., Easton, D.F., Giles, G.G., McCredie, M.R. and Hopper, J.L. (
Daly, M.J., Rioux, J.D., Schaffner, S.F., Hudson, T.J. and Lander, E.S. (
Gabriel, S.B., Schaffner, S.F., Nguyen, H., Moore, J.M., Roy, J., Blumenstiel, B., Higgins, J., DeFelice, M., Lochner, A., Faggart, M. et al. (
Patil, N., Berno, A.J., Hinds, D.A., Barrett, W.A., Doshi, J.M., Hacker, C.R., Kautzer, C.R., Lee, D.H., Marjoribanks, C., McDonough, D.P. et al. (
Johnson, G.C., Esposito, L., Barratt, B.J., Smith, A.N., Heward, J., Di Genova, G., Ueda, H., Cordell, H.J., Eaves, I.A., Dudbridge, F. et al. (
Stram, D.O., Haiman, C.A., Hirschhorn, J.N., Altshuler, D., Kolonel, L.N., Henderson, B.E. and Pike, M.C. (
Ishitobi, M., Miyoshi, Y., Ando, A., Hasegawa, S., Egawa, C., Tamaki, Y., Monden, M. and Noguchi, S. (
Botstein, D. and Risch, N. (
Rosenberg, N.A., Pritchard, J.K., Weber, J.L., Cann, H.M., Kidd, K.K., Zhivotovsky, L.A. and Feldman, M.W. (
Barbujani, G., Magagni, A., Minch, E. and Cavalli-Sforza, L.L. (
Powell, S.N. and Kachnic, L.A. (
Healey, C.S., Dunning, A.M., Teare, M.D., Chase, D., Parker, L., Burn, J., Chang-Claude, J., Mannermaa, A., Kataja, V., Huntsman, D.G. et al. (
Spurdle, A.B., Hopper, J.L., Chen, X., Dite, G.S., Cui, J., McCredie, M.R., Giles, G.G., Ellis-Steinborner, S., Venter, D.J., Newman, B. et al. (
Bonnen, P.E., Wang, P.J., Kimmel, M., Chakraborty, R. and Nelson, D.L. (
Wacholder, S., Chanock, S., Garcia-Closas, M., El Ghormli, L. and Rothman, N. (
Kolonel, L.N., Henderson, B.E., Hankin, J.H., Nomura, A.M., Wilkens, L.R., Pike, M.C., Stram, D.O., Monroe, K.R., Earle, M.E. and Nagamine, F.S. (
Haiman, C.A., Stram, D.O., Pike, M.C., Kolonel, L.N., Burtt, N.P., Altshuler, D., Hirschhorn, J. and Henderson, B.E. (
Lewontin, R.C. (
Pritchard, J.K. and Przeworski, M. (
Hedrick, P.W. and Thomson, G. (
Excoffier, L. and Slatkin, M. (
Pike, M.C., Kolonel, L.N., Henderson, B.E., Wilkens, L.R., Hankin, J.H., Feigelson, H.S., Wan, P.C., Stram, D.O. and Nomura, A.M. (
