


Abstract
Angelman syndrome is a neurogenetic disorder caused by the loss of function of the imprinted UBE3A gene in 15q11–q13. In a small group of patients, the disease is due to an imprinting defect (ID) that silences the maternal UBE3A allele. The presence of a faint maternal band detected by methylation-specific PCR analysis of the SNURF-SNRPN locus in approximately one-third of patients who have an ID but no imprinting center deletion suggested that these patients are mosaics of ID cells and normal cells. In two patients studied, somatic mosaicism was proven by molecular and cellular cloning, respectively. X inactivation studies of cloned fibroblasts from one patient suggest that ID occurred before the blastocyst stage. To quantify the degree of mosaicism, we developed a novel quantitative methylation assay based on real-time PCR. In 24 patients tested, the percentage of normal cells ranged from <1% to 40%. Regression analysis suggests that patients with a higher percentage of normally methylated cells tend to have milder clinical symptoms than patients with a lower percentage. In conclusion, we suggest that the role of mosaic imprinting defects in mental retardation is underestimated.
INTRODUCTION
Most patients with Angelman syndrome (AS) (MIM 105830) have a large deletion of 15q11–q13, paternal uniparental disomy or a UBE3A mutation. Approximately 3–4% of patients have apparently normal chromosomes 15 of biparental inheritance, but a paternal imprint on their maternal chromosome 15. In some of these patients, the imprinting defect (ID) is the result of a microdeletion of the imprinting center (IC) (1). However, in the majority of cases (∼90%), ID appears to be a primary epimutation that occurred spontaneously in the absence of a DNA sequence change (2). However, patients with a large deletion, uniparental disomy or an IC deletion can easily be identified by methylation analysis (they lack a methylated SNURF-SNRPN allele), at least one-third of patients with a primary epimutation show a faint PCR band representing a small number of methylated SNURF-SNRPN alleles. This band can cause diagnostic problems (2,3). Furthermore, some of these patients have an atypical phenotype that is somewhat reminiscent of Prader–Willi syndrome (PWS) (4). In fact, in some of these patients the referral diagnosis was PWS. We have assumed that patients with a faint methylation-specific (MS) PCR band have cellular mosaicism, i.e. a mixture of normal cells and ID cells (2). However, we could not exclude that these patients have an incomplete methylation pattern along the maternal SNURF-SNRPN allele in each cell, which reduces but does not abolish the binding of the MS-PCR primer (in the following referred to as molecular mosaicism). Here, we describe the use of two different cloning strategies to distinguish between cellular and molecular mosaicism. Furthermore, we have developed a novel methylation assay to quantify the degree of mosaicism and have performed a regression analysis to investigate a correlation between the percentage of ID cells and the severity of the disease.
RESULTS
Methylation analysis in AS patients with a primary ID
Over the past few years, we have studied 85 AS patients who have an ID but no IC deletion (2 and unpublished data). MS-PCR analysis of the SNURF-SNRPN exon 1/promoter revealed a faint methylated band in 26/85 (31%) patients (Fig. 1). Although MS-PCR is not a quantitative method, differences in the intensity of the methylated band were clearly visible. In order to distinguish between cellular mosaicism and molecular mosaicism, we studied two patients by two different cloning techniques. Both patients have a relatively strong methylated band (ASID-138 and ASID-71, Fig. 1).
Bisulfite sequencing of cloned DNA fragments
Bisulfite-treated blood DNA from patient ASID-138 was amplified with SNURF-SNRPN primers which anneal to both the unmethylated and methylated alleles (5). The primers flank 23 CpGs within the promoter/exon 1 region. The resulting 346 bp PCR product was cloned in a plasmid vector. Among 10 clones analyzed, we found two clones in which each CpG dinucleotide was conserved (Fig. 2). These clones are derived from a completely methylated allele. Eight clones have a TpG dinucleotide at each CpG position. These clones are derived from a completely unmethylated allele. We did not observe a clone with an incomplete methylation pattern. These results suggest that patient ASID-138 has cellular mosaicism. If no PCR or cloning bias exists for one of the two alleles, the ratio of methylated to unmethylated sequences indicates that the patient has 40% normal blood cells and 60% ID cells. This estimate is in good agreement with the results obtained in the real-time PCR assay (see later).
Methylation analysis of cloned fibroblasts
In patient ASID-71, we used a more direct approach. From a short-term culture of skin fibroblasts, we picked 166 single cells and expanded them into clones. Sixty-four clones survived and were harvested after ∼20 doublings. Forty-eight clones were chosen at random and analyzed by MS-PCR. We obtained a typical AS methylation pattern, i.e. complete absence of a methylated band, in 34 cell lines, and a normal methylation pattern in 14 cell lines. Typical examples are shown in Figure 3. Since the SNURF-SNRPN methylation imprint is stable in fibroblast cultures for at least 30 doublings, these results prove the presence of two cell lines in the patient ASID-71. To exclude the formal possibility that the patient is a chimera, we genotyped one ID cell line and one normal cell line at 15 different microsatellite loci (D15S817-, D15S128-, D15S1234-, CYP19-, D15S100-, FES-, D3S1744-, D3S3050-, D3S2406-, D6S1019-, D6S1034-, D6S477-, TRPS-, EXT1- and D8S200). The finding of the same alleles in both cell lines (data not shown) makes chimerism highly unlikely and substantiates the notion that the patient has cellular mosaicism that results from a postzygotic ID.
Analysis of the X inactivation pattern in the fibroblast clones
To investigate the time at which the postzygotic ID occurred, we determined the pattern of X inactivation in the fibroblast clones. Random X inactivation is known to occur in the inner cell mass of the blastocyst (6–9). If the ID occurred before the onset of random X inactivation, we should find ID cells with an inactive paternal X chromosome and ID cells with an inactive maternal X chromosome. If ID occurred after random X inactivation, the same X chromosome should be inactivated in all ID cells. The patient was homozygous at the AR locus, which is most often used for X inactivation studies, but heterozygous at the FMR1 locus. As shown in Table 1, in 29 ID cell lines, the paternal X chromosome harboring 27 CGG repeats was inactivated; whereas in four ID cell lines, the maternal X chromosome harboring 29 CGG repeats was inactivated. The finding that cell line 1.13 has both an inactive maternal and an inactive paternal alleles may indicate a technical artifact or that this cell line is derived from two cells. Among 14 normal cell lines, the paternal X chromosome was inactive in 13 cell lines and the maternal X chromosome was inactive in one cell line. If the ID occurred only once in patient ASID-71, our findings suggest that it occurred before the onset of random X inactivation.
Quantitative analysis of cellular mosaicism
To quantify the relative amount of methylated alleles, we established a novel real-time PCR assay (QAMA, quantification of methylated alleles) (10). This assay is a modified version of the MethyLight PCR (11). In contrast to the MethyLight PCR, which is based on two independent MS-PCR assays for the methylated and unmethylated allele, QAMA is a one-tube reaction with a single primer pair and two TaqMan probes. For our analysis, we have chosen a pair of primers that amplifies 238 bp of the bisulfite-converted SNURF-SNRPN exon 1/promoter region. The primer binding sites lack CpG dinucleotides so that methylated and unmethylated sequences are amplified with the same efficiency. To determine the degree of methylation, two fluorescence-tagged probes specific for either the unmethylated (VIC) or the methylated (FAM) allele are included in the PCR. Thus, the amplification of the methylated allele is monitored by measuring the FAM marker dye, whereas the intensity of the VIC dye represents the amount of the unmethylated allele. A standard curve was constructed by mixing varying amounts of DNA from a PWS patient with uniparental disomy (two methylated gene copies) and an AS patient with a typical deletion (one unmethylated gene copy) before bisulfite treatment (Fig. 4). In 24/26 patients, DNA was available for testing. The percentage of normally methylated cells ranged from <1% to 40% (Fig. 5).
Regression analysis
To elucidate the connection of the percentage of ID cells and the severity of the disease, we collected clinical data with the help of a questionnaire. Nineteen questionnaires were returned (Table 2). Nine of the patients were originally suspected of having PWS. Five of them have been reported before (4). A complete data set was available for 17 patients. A scoring system was developed to quantify the severity of the disease (Fig. 6). The positive slope of the regression line (Fig. 7) indicates that patients with a higher percentage tend to have milder symptoms, but the correlation is not statistically significant. This is true for the sum of the clinical features (P=0.139) as well as for the individual features.
DISCUSSION
The human genome is estimated to contain 100–200 loci, which are subject to genomic imprinting. The presence of correct imprints at these loci is essential for normal mammalian development; aberrant imprints can cause genetic disease or cancer. Imprinting defects result from errors in imprint erasure, imprint establishment or imprint maintenance. The vast majority of imprinting defects in AS represent primary epimutations that occurred spontaneously in the absence of a DNA sequence change (2). They are characterized by the absence of methylation at the SNURF-SNRPN gene and other loci. It has been suggested that in ASID patients the maternal UBE3A allele is silenced by the SNURF-SNRPN sense/UBE3A antisense transcript (12–14). As the defect is found on the chromosome inherited from either the maternal grandfather or maternal grandmother, it cannot result from an error in imprint erasure, but must result from an error in imprint establishment before or around fertilization or an error in imprint maintenance after fertilization (2).
Imprint maintenance defects result in somatic mosaicism. If normal cells and ID cells contribute to the embryo, patients should be mosaics of ID cells and normal cells. This is exactly what we have found in one-third of ASID patients. Although we have demonstrated cellular mosaicism in only two patients, it is very likely that all patients with a faint methylated MS-PCR band have cellular mosaicism. We hypothesize that also a significant fraction of the ASID patients with a non-mosaic MS-PCR pattern have a postzygotic imprint maintenance defect. (1) In some patients the percentage of normal cells may be below the threshold of detection, or they have normal cells in other tissues that were not studied. (2) In other patients, the normal cell line may not have contributed to the embryo, but only to extra-embryonic tissues. It is known that only very few cells of the pre-embryo develop into the inner cell mass. If so, we should expect placental mosaicism. As we do not have placental tissues from these patients, we cannot prove this assumption.
On the other hand, we propose that a certain fraction of AS patients with a normal MS-PCR pattern and normal UBE3A sequence have an ID. AS patients with an unknown genetic defect account for ∼10–20% of all AS patients. In some of these patients, an ID cell line may have contributed to the brain and other tissues, but not to the blood system. One may consider testing fibroblasts in this class of patients, but, of course, this tissue does not reflect the situation in brain.
We also wish to propose that certain patients with mental retardation may have a mosaic ID on chromosome 15. In 1999, we described patients with a mosaic ID who at first glance look more like PWS than AS (4). In fact, the phenotypic spectrum of mosaic imprinting defects may be much larger and include cases of non-specific mental retardation. We are aware that it is difficult to test this hypothesis, because it might be necessary to study brain samples.
In principle, imprint maintenance defects can occur at every cell division. After DNA replication, the methylation pattern on the template strand is recognized by the maintenance DNA methyltransferase and copied onto the daughter strand. A failure to recognize or copy this pattern results in a methylated and an unmethylated strand of DNA, which will segregate in subsequent cell divisions. However, there is one specific time during development where imprint maintenance may be especially prone to errors. This is the period of global DNA demethylation during the very first few days of development.
The paternal genome is actively demethylated within the first few hours after fertilization, and the maternal genome is passively demethylated during subsequent cell divisions. The wave of global demethylation is followed by a wave of global remethylation, which is completed after the blastocyst stage (15). Gametic imprints survive the waves of global de- and remethylation, although it is unclear how they are protected against the global methylation changes. It is possible that the protection against demethylation occasionally fails so that a maternal imprint is lost in one cell. As imprints cannot be repaired in somatic cells, the daughter cells will inherit the ID.
To examine whether the imprinting defects occur within this critical period, we have studied the pattern of X inactivation in cloned fibroblasts from patient ASID-71. Random X inactivation occurs in the inner cell mass of the blastocyst (6–9). The finding of ID cells with an inactive maternal or an inactive paternal X chromosome suggests that the ID in ASID-71 occurred before the onset of random X inactivation. We are aware that this conclusion is only valid under the assumption that the ID was a single event. However, we consider it to be unlikely that multiple, independent imprinting defects occurred in the patient, because the methylation patterns of the clones are clear-cut. There is no evidence that the imprint is unstable.
We note that in most clones the paternal X chromosome is inactivated. Skewed X inactivation was also observed in the primary fibroblast sample (data not shown). We believe that this phenomenon is not related to the imprinting defects, because skewing occurs in 28% of women under 25 years (16).
We could not narrow down the time at which the ID occurred in the other patients. However, it is not unreasonable to assume that it occurred very early during development.
The development of a novel real-time based PCR assay for the detection of methylated and unmethylated SNURF-SNRPN alleles enabled us to determine precisely the percentage of normal cells and ID cells in our cohort of patients. We found that in 24 patients the percentage of normal cells ranged from <1% to 40%. Regression analysis indicated that patients with a higher percentage of normal cells tend to have a milder disease, but the correlation is not statistically significant. The lack of statistical significance is probably related to the fact that our cohort of patients is small and that some patients with the same ratio of normal and ID cells have a very different phenotype. This finding is probably due to the fact that we could examine only one tissue and that we do not know the distribution of the normal cells and ID cells in other tissues, especially brain. Also, unlinked genetic modifiers, variability in brain activity of the paternal UBE3A allele and environmental factors may contribute to the clinical variability.
Although all patients show developmental delay, most of them achieved much better skills than patients with typical AS do (Table 2). One of the most striking findings is that 9/17 patients are able to speak more than 10 words. Three patients even talk in simple sentences. Good comprehension skills are present in 10/17 patients. The mean age of walking is 21 months (range 13–36 months). This is much earlier than documented by Lossie et al. (17), who described that patients with AS due to an ID start walking at a mean age of 28 months. It should be noted, however, that the cohort described by Lossie et al. is likely to include patients with an IC deletion. Seizures are present in only 4/17 patients. In contrast to patients with AS due to a deletion, only 1/17 patients show microcephaly, which is in concordance with the findings of other groups (18,19). Ataxia, a major finding in patients with typical AS, was observed in only 7/17 patients. Obesity seems to be a frequent feature in patients with AS and an ID, and is present in 13/17 patients. The clinical pattern consisting of developmental delay and obesity due to hyperphagia explains why such patients are often misdiagnosed as having PWS.
In conclusion, patients with an ID tend to be less severely affected than patients with a deletion. Patients with a mosaic ID can have an even milder or an atypical phenotype. The ability to talk should not deter a clinician from consideration of the diagnosis of AS. Clinicians should initiate a methylation test in mentally retarded patients, if the following clinical signs are present: normal or high birth weight, developmental delay and obesity with food-seeking behavior. However, to detect mosaic methylation, it is necessary to use a quantitative test such as the QAMA test described in this study.
MATERIALS AND METHODS
Patients
Patients were examined by one of the authors (G.G.K.) or referring clinicians. Detailed clinical data were collected with the help of a questionnaire. To assess the severity of the phenotype, we developed a scoring system based on the following features: onset of walking, onset of speech, number of words and sentences, comprehension skills, seizures, ataxia and microcephaly. For each feature, a score between 0 (severe) and 1 (mild) was given. Patients were scored by two authors (G.G.K. and K.B.), who did not know the results of the methylation analysis.
Analysis of DNA methylation
Genomic DNA was purified from whole blood and treated with sodium bisulfite according to standard methods. MS-PCR analysis of the SNURF-SNRPN exon 1/promoter region was performed with primers described by Zeschnigk et al. (20).
Quantitative methylation analysis was carried out with a novel real-time PCR assay (10). Briefly, PCR primers were designed to amplify the bisulfite-converted SNURF-SNRPN promoter sequence (the amplicon covers exon 1 of the SNURF-SNRPN exon 1 from position −123 to +115). To determine the degree of methylation, a FAM and a VIC labeled MGB TaqMan® probe specific for the methylated and the unmethylated allele, respectively, were included in the reaction mixture. Real-time PCR was performed with optical tubes and caps in a final volume of 20 µl in an ABI Prism 7000 Sequence Detection System. Samples contained 10 µl of ABI Universal MasterMix (without AmpErase, UNG) 2 µl of bisulfite-treated DNA, additional 2.5 U AmpliTaq Gold (Perkin Elmer), 2.5 µm each of the primers SNRPNqmF and SNRPNqmR and 150 nm each of the fluorescently labeled probes SNRPNe1met and SNRPNe1un. Initial denaturation at 95°C for 10 min to activate AmpliTaq Gold DNA polymerase was followed by 40 cycles of denaturation at 95°C for 15 s and annealing and extension at 60°C for 1 min. The cycle number at which the fluorescence signal crosses a detection threshold is referred to as CT and the difference of both CT values within a sample (ΔCT) is calculated (ΔCT=CT-VIC−CT-FAM). All samples were measured in duplicate and the mean value was used for further analysis. Given that the percentage of methylated DNA molecules in a real-time PCR experiment is given by c, the resulting ΔCT equals log2(c/(1−c)). To account for differential efficacy of the PCR (methylated/unmethylated) and probe activity, we restate the model as ΔCT=a+b log2(c/(1−c)), with a and b representing these additional effects. These nuisance parameters are fitted by means of a linear regression from data of a control experiment.
These data were generated by mixing varying amounts of DNA from a PWS patient with maternal uniparental disomy (two methylated gene copies) and an AS patient with a typical deletion (one unmethylated gene copy) before bisulfite treatment and real-time PCR analysis. The percentage of methylated DNA was determined by the following equation that was deduced from this experiment (% methylation=100/(2−(ΔCT−1.61)/1.26+1)). The relative amount of either the methylated or unmethylated allele was set to 100% in case only one fluorescence signal crossed the threshold.
Regression analysis
To infer a relationship of degree of methylation and clinical features, a linear regression was performed (Software package R 1.8.1, http://r-project.org). Clinical features were coded according to severity on an interval scale as described earlier. The methylation analysis was carried out in Matematica 5.
DNA cloning and sequencing
PCR products derived from the bisulfite-converted SNURF-SNRPN promoter/exon 1 region were cloned into the pGEM-T easy vector (Promega). Ten clones were picked and analyzed by DNA sequencing using an ABI 3100 automatic capillary genetic analyzer and GeneScan and Genotyper software (Applied Biosystems, Foster City, CA, USA).
Cloning of fibroblasts
Skin fibroblasts were cultured in AmnioMax-Medium (Gibco Invitrogen, Karlsruhe, Germany). Under an inverted microscope (Zeiss), the cells were detached with Trypsin/EDTA and single cells were transferred with the help of an extended Pasteur pipette to a 96-well dish. Growing cultures were expanded in separate culture flasks.
X inactivation
To assess the inactivation status of the X chromosome, the methylation status of the fragile X mental retardation gene locus (FMR1) was studied. Undigested DNA samples and DNA samples digested with the methylation sensitive enzyme HpaII were amplified with fluorescence-tagged PCR primers flanking the CGG repeat within the FMR1 gene (21). DNA samples from the parents were used as controls and to determine the parental origin of the two X chromosomes in the patient. A PCR fragment derived from a plasmid vector containing four HpaII sites as well as DNA from male donor as included as a control for complete HpaII digestion. PCR products were analyzed on a capillary genetic analyzer (ABI 3100) as described earlier.
Microsatellite analysis
For microsatellite analysis, fluorescence-tagged PCR products were analyzed using an ABI 3100 automatic capillary genetic analyzer and GeneScan and Genotyper software (Applied Biosystems).
Primer and probes
Primer and probe sequences for quantitative methylation analysis by real-time PCR analysis of bisulfite modified DNA were selected with the help of the probe and primer test document included with Primer Express software (ABI): SNRPNqmF: 5′-GAG GGA GTT GGG ATT TTT GTA TTG-3′; SNRPNqmR: 5′-CCC AAA CTA TCT CTT AAA AAA AAC CAC-3′ and SNRPNe1met: 5′-(6FAM)-CGT TTG CGC GGT CG-(MGB)-3′; SNRPNe1un: 5′-(VIC)-AAG TAT GTT TGT GTG GTT GTA G-(MGB)-3′. The melting temperature (Tm) of the primers was adjusted to 58–60°C and the Tm of the MGB-probes was 68°C. For methylation analysis of single chromosomes, we used the primers Bi-SNP-F1, 5′-TCC AAA ACA AAA AAC TTT AAA ACC CAA ATT C-3′; Bi-SNP-R1, 5′-AGG TTT TTT TTT ATT GTA ATA GTG TTG TGG GG-3′; Bi-SNP-F2, 5′-TCA ATA CTC CAA ATC CTA AAA ACT TAA AAT ATC-3′; Bi-SNP-R2, 5′-TGT GGG GTT TTA GGG GTT TAG TAG TTT TTT TTT TTT AGG-3′ (5). Primer used for X inactivation were as follows: CGG-F, 5′-GCT CAG CTC CGT TTC GGT TTC ACT TCC GGT-3′; CGG-R 5′-(FAM)-AGC CCC GCA CTT CCA CCA CCA GCT CCT CCA-3′ (22).
ACKNOWLEDGEMENTS
We thank Drs K. Brockmann, J. Bürger, C. Camprubi, J. Clayton-Smith, V. Cohen, S. Demuth, A. Dobbie, D. Gläser, M. Hagen, R. Hennekam, J. Hurst, B. Janssen, P. Jonveaux, R. Koenig, B. Leheup, S. Mansour, R. McLeod, B. Mitulla, R. Newbury-Ecob, A. Petrick, H. Sawyer, S. Schuffenhauer, H. Seidel, A. Smith, M. Splitt, M. Suri, G. Tariverdian, U. Theile, L. Van Maldergem and P. Willems for sending DNA or blood samples and proven clinical and anthromometric data. We thank Danute Bergmann for technical assistance. Part of the work was supported by the Deutsche Forschungsgemeinschaft (BU907/1-2).
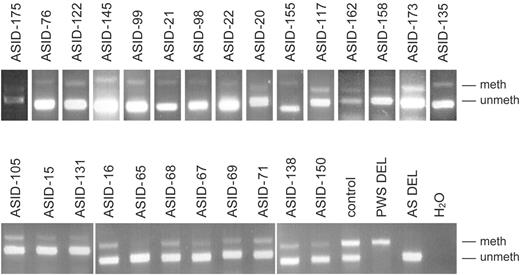
Figure 1. MS-PCR analysis of 26 AS patients who have an ID but no IC deletion. A faint methylated band is present in all ASID patients. The patients with a paternal (PWS DEL) or a maternal (AS DEL) deletion of 15q11–q13 show a typical PWS and AS methylation pattern, respectively. The normal control has two bands of equal intensity; meth, methylated and unmeth, unmethylated.
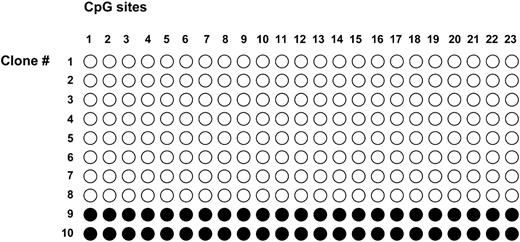
Figure 2. Methylation analysis of the SNURF-SNRPN promoter region in blood DNA from patient ASID-138. Genomic DNA was treated with sodium bisulfite, amplified by PCR and cloned in bacteria. Sequence analysis revealed that eight clones were derived from completely unmethylated sequences and two clones were derived from completely methylated sequences; open circle, unmethylated CpG and filled circle, methylated CpG.
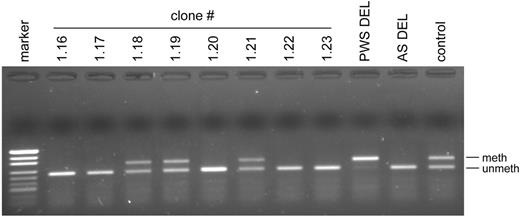
Figure 3. MS-PCR analysis of cloned fibroblasts from patient ASID-71. Clones 1.16, 1.17, 1.20, 1.22 and 1.23 show an AS pattern (lack of methylated band), whereas clones 1.18, 1.19 and 1.21 show a normal pattern. Abbreviations as in Figure 1.
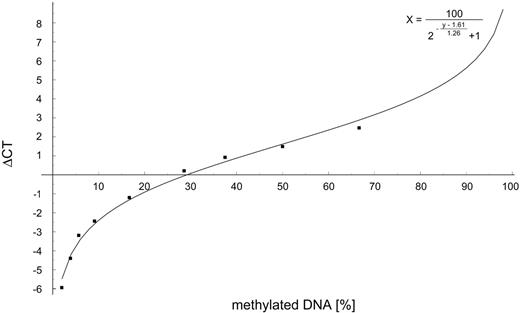
Figure 4. Standard curve for the quantitative analysis of DNA methylation. Varying amounts of DNA from a PWS patient with maternal uniparental disomy (two methylated gene copies) and an AS patient with a typical deletion (one unmethylated gene copy) were mixed, treated with bisulfite and subjected to real-time PCR analysis (for details, see Materials and Methods). The percentage of methylated DNA was determined by the following equation that was deduced from the experimental values (filled squares): % methylation=100/(2−(ΔCT−1.61)/1.26+1).
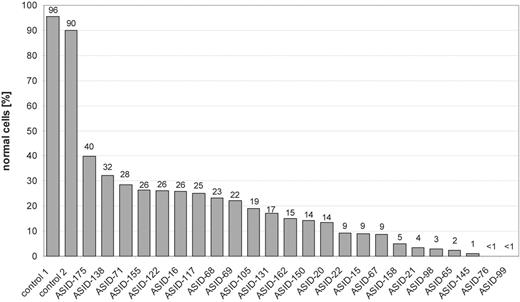
Figure 5. Degree of mosaicism in 24 patients. The percentage of normal cells in the patients ranges from <1% to 40%. Normal controls have a level close to 100%. Real-time PCR analysis in patients ASID-76 and ASID-99 clearly showed the presence of a methylated allele. However, the amplification curves for the methylated allele did not cross the threshold used in these experiments, so that exact quantitation was not possible.
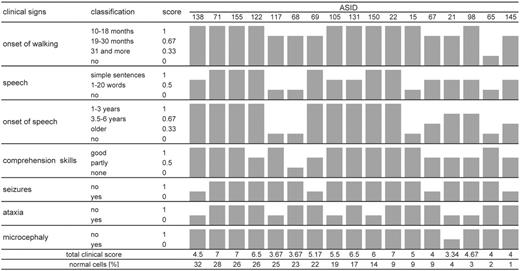
Figure 6. Clinical scores. For each feature, a score from 0 (severe) to 1 (mild) was given. The scores are shown as gray bars. The sum of the clinical score is given at the bottom of the figure. The patients are ordered according to the percentage of normal cells.
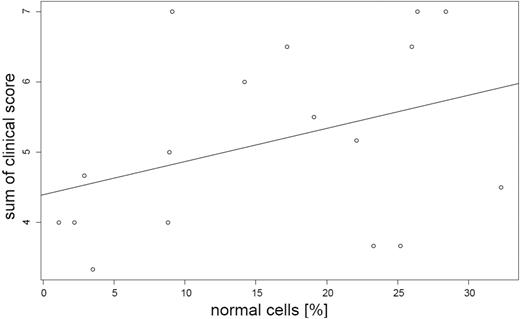
Figure 7. Linear regression analysis. The sum of the clinical scores is correlated to the percentage of the normal cells.
Parental origin of the inactive X in the fibroblast clones from patient ASID-71
| Clone number | Inactive X | |
|---|---|---|
| Paternal | Maternal | |
| ID cells | ||
| 1.2 | x | |
| 1.3 | x | |
| 1.4 | x | |
| 1.6 | x | |
| 1.7 | x | |
| 1.8 | x | |
| 1.10 | x | |
| 1.11 | x | |
| 1.12 | x | |
| 1.13 | x | x |
| 1.15 | x | |
| 1.16 | x | |
| 1.17 | x | |
| 1.20 | x | |
| 1.22 | x | |
| 1.23 | x | |
| 1.25 | x | |
| 1.27 | x | |
| 1.28 | x | |
| 1.30 | x | |
| 1.31 | x | |
| 1.36 | x | |
| 1.37 | x | |
| 1.38 | x | |
| 1.39 | x | |
| 1.41 | x | |
| 1.42 | x | |
| 1.43 | x | |
| 1.44 | x | |
| 1.45 | x | |
| 1.47 | x | |
| 1.49 | x | |
| 1.50 | x | |
| 1.51 | x | |
| Normal cells | ||
| 1.1 | x | |
| 1.5 | x | |
| 1.9 | x | |
| 1.14 | x | |
| 1.18 | x | |
| 1.19 | x | |
| 1.21 | x | |
| 1.24 | x | |
| 1.26 | x | |
| 1.32 | x | |
| 1.33 | x | |
| 1.34 | x | |
| 1.35 | x | |
| 1.48 | x | |
Anthropometric and clinical data. The patients are ordered according to the percentage of normal cells
| ID | ||||||||||
|---|---|---|---|---|---|---|---|---|---|---|
| ASID-138 | ASID-71 | ASID-155 | ASID-122 | ASID-16 | ASID-117 | ASID-68 | ASID-69 | ASID-105 | ASID-131 | |
| Age at study | 21.7 years | 13.1 years | 13.2 years | 7.9 years | 29.2 years | 11.3 years | 9.4 years | 10.4 years | 6.2 years | 8.3 years |
| Referral diagnosis | PWS | PWS | PWS | AS | MR | AS | PWS | PWS | AS | PWS |
| Anthropometric data at birth | ||||||||||
| Weight | 3540 g | 3000 g | 3650 g | 2900 g | n.d. | 2268 g | 4850 g | 3320 g | 3570 g | 3540 g |
| Height | 50.8 cm | 54 cm | 52 cm | 48 cm | n.d. | n.d. | 58 cm | 53 cm | n.d. | 54 cm |
| Head circumference | 35.2 cm (2 weeks after birth) | 34 cm | 35 cm | 33 cm | n.d. | n.d. | 38 cm | 35 cm | 35 cm | 35 cm |
| Muscular hypotonia in the newborn period | − | − | − | − | − | − | − | − | − | − |
| Feeding problems | + | − | − | − | + | + | + | − | − | − |
| Onset of walking | 18 month | 18 month | 15 month | 18 month | n.d. | 21 month | 24 month | 24 month | 14 month | 16 month |
| Onset of speech | 18 month | 2 years | 3 years | 1 year | n.d. | n.d. | n.d. | 2 years | 18 month | 1–1.5 years |
| Ability to speak | 10 words | Simple sentences | Simple sentences | 50 words | n.d. | No speech | No speech | 20–30 words | 20 words | 20 words |
| Comprehension skills | Good | Good | Good | Partly | Good | Good | None | Partly | Good | Good |
| Inappropriate laughter | + | − | − | + | + | − | − | − | − | − |
| Seizures | + | − | − | − | − | − | − | + | − | − |
| Ataxia | + | − | − | − | + | + | − | − | + | − |
| Microcephaly | − | − | − | − | n.d. | − | − | − | − | − |
| Obesity | + | + | + | + | + | − | + | + | − | + |
| Hyperphagia/food-seeking behavior | + | + | + | + | − | − | + | − | − | + |
| ASID-150 | ASID-22 | ASID-15 | ASID-67 | ASID-21 | ASID-98 | ASID-65 | ASID-145 | ASID-76 | ||
|---|---|---|---|---|---|---|---|---|---|---|
| Age at study | 9.8 years | 21.9 years | 13.2 years | 13.7 years | 8.5 years | 14.2 years | 15.9 years | 11.3 years | 27.5 years | |
| Referral diagnosis | PWS | AS | PWS | PWS | AS | AS | AS | AS | AS | |
| Anthropometric data at birth | ||||||||||
| Weight | 3820 g | 2740 g | 4050 g | 3800 g | 3190 g | 3100 g | 3400 g | 2830 g | 3750 g | |
| Height | 55 cm | 46 cm | 56 cm | 50 cm | 55 cm | 50 cm | n.d. | 54 cm | n.d. | |
| Head circumference | 35 cm | 33 cm | 36.5 cm | n.d. | 35.5 cm | 35 cm | n.d. | 34.5 cm | n.d. | |
| Muscular hypotonia in the newborn period | + | − | − | later | + | + | − | − | − | |
| Feeding problems | − | − | − | − | − | + | + | − | − | |
| Onset of walking | 18 month | 13 month | 16 month | 30 month | 31 month | 18 month | 36 month | 30 month | 10-30 month | |
| Onset of speech | 18 month | 2.5 years | n.d. | 7 years | 3.5 years | 4 years | n.d. | 7 years | n.d. | |
| Ability to speak | 60 words | Simple sentences | No speech | 2–3 words | 2 words | 7–8 words | No speech | 10 words | 6 words | |
| Comprehension skills | Good | Good | Good | Partly | Partly | Partly | Good | Partly | Partly | |
| Inappropriate laughter | − | + | − | − | + | + | + | − | + | |
| Seizures | − | − | − | + | − | − | − | + | + | |
| Ataxia | + | − | − | − | + | + | − | − | + | |
| Microcephaly | − | − | − | − | + | − | − | − | n.d. | |
| Obesity | + | + | + | + | − | + | − | − | + | |
| Hyperphagia/food-seeking behavior | + | − | + | − | − | + | + | − | − |
+, Present; −, absent; n.d., not documented.
References
Buiting, K., Saitoh, S., Gross, S., Dittrich, B., Schwartz, S., Nicholls, R.D. and Horsthemke, B. (
Buiting, K., Gross, S., Lich, C., Gillessen-Kaesbach, G., El-Maarri, O. and Horsthemke, B. (
Horsthemke, B., Lich, C., Buiting, K., Achmann, R., Aulehla-Scholz, C., Baumer, A., Burger, J., Dworniczak, B., Glaser, D., Holinski-Feder, E. et al. (
Gillessen-Kaesbach, G., Demuth, S., Thiele, H., Theile, U., Lich, C. and Horsthemke, B. (
El-Maarri, O., Buiting, K., Peery, E.G., Kroisel, P.M., Balaban, B., Wagner, K., Urman, B., Heyd, J., Lich, C., Brannan, C.I. et al. (
Monk, M. (
Huynh, K.D. and Lee, J.T. (
Mak, W., Nesterova, T.B., de Napoles, M., Appanah, R., Yamanaka, S., Otte, A.P. and Brockdorff, N. (
Okamoto, I., Otte, A.P., Allis, C.D., Reinberg, D. and Heard, E. (
Zeschnigk, M., Boehringer, S., Price, E.A., Onadim, Z., Maßhöfer, L. and Lohmann, D. (
Eads, C.A., Danenberg, K.D., Kawakami, K., Saltz, L.B., Blake, C., Shibata, D., Danenberg, P.V. and Laird, P.W. (
Runte, M., Huttenhofer, A., Gross, S., Kiefmann, M., Horsthemke, B. and Buiting, K. (
Runte, M., Kroisel, P.M., Gillessen-Kaesbach, G., Varon, R., Horn, D., Cohen, M.Y., Wagstaff, J., Horsthemke, B. and Buiting, K. (
Landers, M., Bancescu, D.L., Le Meur, E., Rougeulle, C., Glatt-Deeley, H., Brannan, C., Muscatelli, F. and Lalande, M. (
Reik, W., Dean, W. and Walter, J. (
Sharp, A., Robinson, D. and Jacobs, P. (
Lossie, A.C., Whitney, M.M., Amidon, D., Dong, H.J., Chen, P., Theriaque, D., Hutson, A., Nicholls, R.D., Zori, R.T., Williams, C.A. et al. (
Bürger, J., Buiting, K., Dittrich, B., Gross, S., Lich, C., Sperling, K., Horsthemke, B. and Reis, A. (
Saitoh, S., Buiting, K., Cassidy, S.B., Conroy, J.M., Driscoll, D.J., Gabriel, J.M., Gillessen-Kaesbach, G., Glenn, C.C., Greenswag, L.R., Horsthemke, B. et al. (
Zeschnigk, M., Lich, C., Buiting, K., Doerfler, W. and Horsthemke, B. (
Carrel, L. and Willard, H.F. (
