


Abstract
Germline mutations in the Exostoses-1 gene (EXT1) are found in hereditary multiple exostoses syndrome, which is characterized by the formation of osteochondromas and an increased risk of chondrosarcomas and osteosarcomas. However, despite its putative tumor-suppressor function, little is known of the contribution of EXT1 to human sporadic malignancies. Here, we report that EXT1 function is abrogated in human cancer cells by transcriptional silencing associated with CpG island promoter hypermethylation. We also show that, at the biochemical and cellular levels, the epigenetic inactivation of EXT1, a glycosyltransferase, leads to the loss of heparan sulfate (HS) synthesis. Reduced HS production can be reversed by the use of a DNA demethylating agent. Furthermore, the re‐introduction of EXT1 into cancer cell lines displaying methylation-dependent silencing of EXT1 induces tumor-suppressor-like features, e.g. reduced colony formation density and tumor growth in nude mouse xenograft models. Screening a large collection of human cancer cell lines (n=79) and primary tumors (n=454) from different cell types, we found that EXT1 CpG island hypermethylation was common in leukemia, especially acute promyelocytic leukemia and acute lymphoblastic leukemia, and non-melanoma skin cancer. These findings highlight the importance of EXT1 epigenetic inactivation, leading to an abrogation of HS biosynthesis, in the processes of tumor onset and progression.
INTRODUCTION
Hereditary multiple exostoses (HME) is an autosomal dominant disease with a prevalence of 1/50 000 (1), characterized by the formation of cartilage-capped tumors, known as osteochondromas or exostoses, which develop primarily on the long bones of affected individuals from early childhood until puberty (2,3). Moreover, individuals with HME have a significantly higher risk than the general population of developing malignancies such as chondrosarcomas and osteosarcomas (1,4). To date, three loci are known to be involved in the development of HME: EXT1 on chromosome 8q24.1 (5), EXT2 on chromosome 11p13 (6) and EXT3 located on the short arm of chromosome 19 (7). Mutational analysis of HME patients has shown that inactivating mutations in the EXT1 and EXT2 genes are responsible for the majority of familial cases: 60–70% of the cases have mutations in EXT1 and 30–40% have them in EXT2. Most HME cases arise from missense or frameshift mutations that lead to the synthesis of truncated forms of the EXT proteins (4,8). Besides the presence of exostoses in the isolated autosomal dominant subtype, HME is also observed in two contiguous gene syndromes: the Langer–Giedion syndrome and the proximal 11p deletion syndrome, which are produced by constitutional chromosomal deletions or structural rearrangements of 8q24.1 and 11p11–p12, respectively (9–11).
Despite extensive genetic characterization, the function of the EXT proteins remained unknown until 1998, when the study of a mouse fibroblast cell line deficient in heparan sulfate (HS) revealed that EXT1 is involved in HS biosynthesis (12). Following this lead, it has been demonstrated that EXT1 and EXT2 are glycosyltranferases required for the biosynthesis of heparan sulfate glycosaminoglycans (HSGAGs) (12,13). Both EXT1 and EXT2 have a predicted type II transmembrane glycoprotein structure that localizes predominantly to the endoplasmic reticulum. These two proteins form a hetero-oligomeric complex in vivo that leads to an accumulation of both proteins in the Golgi apparatus (14,15). Biochemical studies have confirmed that both EXT1 and EXT2 possess HS polymerase activity in vitro, i.e. the ability to add single D-glucoronic acid (GlcA) and N-acetylglucosamine (GlcNAc) molecules to an artificial substrate molecule (12,16). The expression of EXT1 is also able to rescue HS-deficient mutant Chinese hamster ovary cells that harbor missense mutations in EXT1 (17). An EXT1 knockout mouse model has shown that EXT1 is essential for HS biosynthesis in vivo (16).
Since patients with EXT1 and EXT2 germline mutations develop, with high penetrance, osteochondromas and the increased risk for chondrosarcomas and osteosarcomas, a tumor-suppressor function for the two genes has been assumed. This role is corroborated by the presence of loss of heterozygosity at the EXT1 and EXT2 loci in HME-related and sporadic chondrosarcomas (18–21) and by the presence of chromosomal abnormalities involving the EXT regions in chondrosarcomas (22,23). However, somatic mutations of EXT1 and EXT2 are extremely rare in sporadic neoplasms (21,24). Transcriptional inactivation by CpG island promoter hypermethylation is an alternative and emergent mechanism for the inactivation of tumor-suppressor genes (25–27). Familial tumor-suppressor genes, such as hMLH1 and BRCA1, which are very rarely mutated in sporadic tumors, undergo epigenetic inactivation by hypermethylation of these regulatory regions in non-inherited neoplasms (25–27).
In this manuscript, we demonstrate that EXT1, but not EXT2, undergoes CpG island promoter methylation-associated gene silencing in specific cell types of cancer cells. The hypermethylation of the EXT1 promoter leads to its loss of expression and the abrogation of HS synthesis, demonstrated at the biochemical and cellular levels. The epigenetic loss of EXT1 function can be rescued by the use of DNA demethylating agents. Furthermore, the reintroduction of EXT1 into those transformed cell lines with HS-deficiency due to hypermethylation provokes a reduction in colony formation and a decrease in growth of tumor xenografts, supporting the hypothesis of a tumor-suppressor role for EXT1. The analysis of a large panel of cancer cell lines and primary tumors shows that leukemia and non-melanoma skin cancer are the main tissue targets for EXT1 CpG island hypermethylation. These findings underline the significance of the impairment of HS production in the biology of malignant cells, and identify epigenetic silencing of EXT1 as one of its key steps.
RESULTS
EXT1 promoter CpG island hypermethylation leads to gene silencing
EXT1 and EXT2 are gene candidates for hypermethylation-associated inactivation in human cancer since a 5′-CpG island is located around the transcription start site of each gene (Fig. 1A). To analyze the methylation status of the promoter-associated CpG islands of both genes, we screened 79 human cancer cell lines from 26 tumor types using bisulfite genomic sequencing and methylation-specific PCR targeted to the area surrounding their corresponding transcription start sites, as described in Materials and Methods. All samples tested were found by both methods to be unmethylated at the EXT2 CpG island (Fig. 1A and B), but, strikingly, EXT1 CpG island promoter hypermethylation was found in three cancer cell lines, all of which were leukemia cell lines: HL-60 (acute promyelocytic leukemia), NB4 (acute promyelocytic leukemia) and REH (acute lymphoblastic leukemia) (Fig. 1A and B, Table 1). All normal tissues analyzed, including lymphocytes, bone marrow, breast, colon and skin, were completely unmethylated at the EXT1 and EXT2 promoters. These results were confirmed by bisulfite genomic sequencing and methylation-specific PCR (Fig. 1A and B). We also performed bisulfite genomic sequencing of the hSulf1 gene, a recently identified human sulfatase (28), and no methylation changes were observed between normal cells and HL-60, NB4 or KG1a (data not shown).
Having noted EXT1 promoter hypermethylation in the leukemia cell lines, we assessed the association between this epigenetic aberration and the putative transcriptional inactivation of the EXT1 gene at the RNA and protein levels. The leukemia cell lines, HL-60, REH and NB4, hypermethylated at the EXT1 CpG island, did not express any EXT1 RNA transcript, as determined by reverse-transcription PCR (RT–PCR) (Fig. 2B). However, another leukemia cell line, KG1a, the breast cancer cell line MCF7 and normal lymphocytes, unmethylated at the EXT1 promoter, strongly expressed EXT1 (Fig. 2B). The same pattern of EXT1 expression was obtained at the protein level by western blotting (Fig. 2C). We established a further link between EXT1 CpG island hypermethylation and its gene silencing by the treatment of the methylated leukemia cell lines with a DNA demethylating agent. The treatment of the HL-60, REH and NB4 leukemia lines with the demethylating drug 5-aza-2′-deoxycytidine (Fig. 2A) restored the expression of EXT1 RNA transcript and protein (Fig. 2B and C).
Reactivation of EXT1 expression by a demethylating agent restores HS synthesis
Unlike mutational inactivation, epigenetic loss of genes can be reversed by pharmacological means, such as the use of DNA demethylating agents, as we have shown earlier. It is not only a matter of restoring gene expression, but also of rescuing gene functionality. This is exemplified by several genes that undergo methylation-associated silencing, such as the DNA repair gene hMLH1, the pro-apoptotic gene DAPK and the MDM2-regulator p14ARF, where treatment with the demethylating agent induced recovery of gene functions: DNA mismatch repair activity, IFN-γ-induced apoptosis and sequestration of MDM2, respectively (29–31). As EXT1 exhibits glycosyltransferase activity that is involved in HS biosynthesis (12,16), we examined the impact of EXT1 methylation-mediated silencing in HS expression and the effect of restoring EXT1 expression by pharmacological means.
We first stained the HL-60 and REH leukemia cell lines, untreated or treated with the demethylating drug, with the dye Rubipy (tris(2,2′-bipyridine) ruthenium (II)), as described in Materials and Methods. Rubipy is used as a specific stain for sulfated polyanions such as HS groups (32). The untreated EXT1 methylated leukemia cell lines, HL-60 and REH, did not show cytoplasmic or membrane staining (Fig. 3A), but treatment with the demethylating agent 5-aza-2′-deoxycytidine restored cytoplasmic and membrane staining for sulfate polyanions. This latter staining pattern closely resembled that observed in the unmethylated leukemia and breast cancer cell lines KG1a and MCF-7 (Fig. 3A). To further differentiate between HS staining and other glycosaminoglycan (GAG) chains (which both stain with Rubipy), we took an additional biochemical approach. HL-60 cell extracts, before and after demethylating treatment, were digested with heparitinase, an enzyme that degrades specifically HSGAGs, or with heparinase, an enzyme that degrades other GAGs (such as chondroitin sulfate, dermatan sulfate and keratan sulfate), but not HS (33). In both cases, Rubipy staining of the digestion products in a gel produced smears representing the different sizes of the GAG chains originated by heparinase and heparitinase digestion. We found that, although the demethylating treatment produced no changes in the smear of GAG chains obtained from the heparinase digestion in the cells, 5-aza-2′-deoxycytidine induced a significant increase in the GAG smear obtained from heparitinase digestion (Fig. 3B). Thus, Rubipy staining of cells and the heparinase/heparitinase experiments suggest that HSGAG production is compromised in these leukemia cells and EXT1 re-expression induced by demethylation restores its synthesis.
Finally, to corroborate the above findings, we examined HS proteoglycan expression itself in living cells by flow cytometry and confocal microscopy using a monoclonal antibody against HS, as described in Materials and Methods. In the flow cytometry analysis, no HS proteoglycan expression could be detected in the untreated HL-60 or NB4 cell lines, which featured methylation-associated silencing of EXT1, whereas treatment of the same cell line with the demethylating drug yielded expression in 45% of the cells (Fig. 4A). This percentage of HS positivity was very similar to that observed in the EXT1 unmethylated cell line MCF-7 (52%) (Fig. 4A). The final proof of the close relationship between EXT1 epigenetic silencing and abrogation of HS biosynthesis was provided by the confocal microscopy study of living cells. HS expression was not detectable in HL-60 or NB4 cells (Fig. 4B), but treatment with 5-aza-2′-deoxycytidine induced strong staining for HS proteoglycans in the plasma membrane (Fig. 4B). The pattern of HS staining in HL-60 and NB4 cells after demethylating treatment was extremely similar to that observed in KG1a cells, a leukemia cell line with a similar cell morphology to that of HL-60 and NB4, but with an unmethylated and expressed EXT1 gene (Fig. 4B). Overall, these data are evidence of an essential role for EXT1 hypermethylation-mediated silencing in the inhibition of HS biosynthesis in transformed cells.
Re-introduction of EXT1 in deficient cancer cell lines has tumor-suppressor-like properties
Although the tumor-suppressor gene features of EXT1 have been proposed before, we assayed the ability of EXT1 to function as a suppressor of tumor growth in our model, using a leukemia cell line with EXT methylation-associated silencing. We first tested the inhibitory abilities of EXT1 in a colony-focus assay using G418 selection after transfection with the EXT1 gene (pEGFP–N1–EXT1) or the empty vector (pEGFP–N1). EXT1 expression and HS biosynthesis were monitored by RT–PCR and confocal microscopy using an anti-HS monoclonal antibody (10E4), respectively (Fig. 5A). Inhibition of tumor cell growth was assessed by seeding HL-60-transfected cells on methylcellulose, incubating for 15 days, and then scoring the number of colonies formed. EXT1 re-expression demonstrated tumor-suppressing activity with a marked reduction of 54% in colony formation density with respect to the empty vector (Fig. 5B).
We next tested the ability of EXT1-transfected HL-60 cells to form tumors in nude mice compared with empty vector-transfected HL-60 cells. The same mice were subcutaneously injected with 106 EXT1 (right flank) or empty vector-transfected (left flank) HL-60 cells (Fig. 5E). All mice were killed 8 days after the injection, and the tumors were dissected and weighed. Cells transfected with the empty vector (HL-60/pEGFP–N1) formed tumors rapidly, but cells infected with the EXT1 expression vector (HL-60/pEGFP–N1–EXT1) had much lower tumorigenicity (Fig. 5C). At the time of sacrifice, tumors were 10 times larger in those mice with the empty vector, 373.4±66.96 g, than in those xenografts arising in the mice transfected with EXT1, 37.0±11.59 g (Fig. 5D). The presence of transfected cells in the tumors was confirmed by the detection of GFP (Fig. 5E).
Profile of EXT1 CpG island hypermethylation in human primary malignancies
Following the demonstration of the epigenetic loss of function of EXT1 in cancer cell lines, we assessed the prevalence of EXT1 CpG island promoter hypermethylation in cancer patients. We examined 454 primary tumors corresponding to 11 different tissue types, as described in Materials and Methods. The highest prevalence of EXT1 hypermethylation was found in leukemias, especially acute lymphoblastic leukemia (32%, 12/37) and acute promyelocytic leukemia (25%, 8/31), followed at a more moderate rate by acute myeloblastic leukemia (7.4%, 2/27). This elevated frequency of EXT1 in primary hematological neoplasms closely resembled our findings in the transformed cell lines. The second most common target of CpG island hypermethylation of EXT1 was non-melanoma skin cancer, where 14.2% (4 of 28) of primary tumors featured the epigenetic aberration. This is a very exciting result because disruption of HS homeostasis is known to be a critical step in skin cancer tumorigenesis (34,35). In none of the other solid tumors analyzed, including breast, colon and lung neoplasias, did we find any evidence of EXT1 hypermethylation, again recapitulating our findings in the cancer cell lines. It is particularly interesting to note that neither chondrosarcomas nor osteosarcomas, the tumor types over-represented in HME patients, exhibited EXT1 hypermethylation. It is highly plausible that, in all these tumor types, overproduction of heparanase, rather than the inhibition of HS biosynthesis, plays a major role in the impairment of the extracellular matrix (36,37). Table 1 summarizes the data obtained from primary tumors, and examples of the methylation analyses are illustrated in Figure 6.
EXT1 CpG island promoter hypermethylation and clinical behavior
The high rate of EXT1 CpG island promoter hypermethylation observed in leukemias, specially in acute lymphoblastic leukemia and acute promyelocytic leukemia, prompted us to study if EXT1 epigenetic inactivation had any clinical impact in the natural history of these two diseases. The data are summarized in Table 2.
In the lymphoblastic lineage, we found that EXT1 hypermethylation was associated with those acute lymphoblastic leukemias with good cytogenetic prognostic factors, a recognized independent predictor of favorable outcome in these patients (38). We observed EXT1 CpG island hypermethylation in 54% (7 of 12) of acute lymphoblastic leukemias with good cytogenetic prognosis, whereas it was only found in 21% (5 of 24) of those patients with poor cytogenetic findings (Fisher's exact test P=0.04).
In the acute promyelocytic leukemias, we assessed the clinical response of our patients to the treatment with all-trans retinoic acid (ATRA) in relation to the methylation status of EXT1. Differentiation therapy with ATRA is highly effective in the treatment of acute promyelocytic leukemia (39), but still 10–15% of APL patients do not respond to ATRA treatment (40). Three acute promyelocytic leukemia samples did not receive ATRA therapy because they were diagnosed prior to 1993 when ATRA was not yet used as standard therapy for the disease and were excluded for this analysis. Among the remaining 28 acute promyelocytic leukemia samples, 50% (3 of 6) that had EXT1 methylation did not respond to the ATRA treatment, whereas the patients unmethylated at the EXT1 gene did not respond to the ATRA treatment only in 10% of cases (2 of 20). Thus, EXT1 CpG island hypermethylation was associated with a lack of clinical response to ATRA in our set of acute promyelocytic leukemia patients (Fisher's exact test P=0.05).
DISCUSSION
HSGAGs have a pivotal role in tumor growth, tumor-cell adhesion, invasiveness and metastasis (41,42). They are complex polysaccharides that are characterized by a repeat disaccharide unit of uronic acid (either iduronic or glucoronic acid) linked to a glucosamine. Along with other GAG chains, including chondroitin sulfate, dermatan sulfate and keratan sulfate, HSGAGs are present in the extracellular matrix and also at the cell surface of every eukaryotic cell. An ever-growing number of biological processes are regulated by the interaction of proteins with HSGAGs. These interactions are important not only in normal physiological processes, such as organogenesis, angiogenesis, blood coagulation, growth-factor signaling and lipid metabolism, but also in pathological processes like viral/bacterial adherence, tumor invasion and metastasis (41,42). Given the essential contribution of HSGAGs to multiple cellular pathways, the balance between their synthesis and degradation should be tightly controlled in a normal cell. This equilibrium undergoes drastic changes in a transformed cell: HSGAG degradation disintegrates the subendothelial basement membrane, consequently facilitating transendothelial migration of blood-borne cells (35,36). One component contributing to the imbalance was previously known: heparanase, the enzyme that degrades HSGAGs, is usually overexpressed in human tumors in association with the invasive and metastatic potential of lymphoma, fibrosarcoma, breast carcinoma and melanoma cells (35,36). We have now shown that not only is there increased degradation of HSGAGs in human malignancies, but also that there is a profound defect in their synthesis mediated by the epigenetic silencing of the EXT1 gene.
The EXT1 gene is the copolymerase responsible for HS formation. At the cellular level, EXT1 is able to restore viral susceptibility to the herpes virus (12), which requires HSGAGs for its introduction into the host cells. At the biochemical level, its glucuronic acid and N-acetyl-glucosamine transferase activities have been demonstrated (13,17,43). The contribution of EXT1 to human pathology was deduced from the finding that germline mutations in EXT1 were present in patients with HME (4,8), an inherited disease characterized by the formation of osteochondromas and an increased risk of chondrosarcomas and osteosarcomas (1,4). Thus, exostosis growth plates from HME patients feature the complete loss of HS (44). Futhermore, HS synthesis is abolished or decreased to 50% in EXT1 homozygous and heterozygous mutant mice, respectively (16). Our finding that transcriptional silencing of the EXT1 gene by promoter CpG island hypermethylation in malignant cells leads to the complete abolition of HS production, and that it can be reversed by the re-expression of EXT1 using demethylating agents, highlights the essential role of this gene in HS biosynthesis. Furthermore, it is important to note that this occurs in the context of an unmethylated and expressed EXT2 gene, underlining once more the primordial contribution of EXT1.
The role of EXT1 as a classical tumor-suppressor gene was strongly supported by two sets of observations: the formation of cartilage-capped tumors and a higher risk of cartilaginous and bone malignancies in HME patients (1,4), and the presence of genomic and chromosomal abnormalities at the EXT1 locus in sporadic neoplasms (22,23). Here we have taken an in vitro approach, the colony formation assay, and used an in vivo model, the xenograft implantation in nude mice, to provide additional functional data that demonstrate the capability of EXT1 to inhibit the growth of cancer cells.
The pattern of EXT1 CpG island promoter hypermethylation observed when we screened a large collection of cancer cell lines and primary tumors is very remarkable for two reasons. First, it was surprising to discover that neither chondrosarcomas nor osteosarcomas had aberrant methylation at the EXT1 locus. For other tumor-suppressor genes with methylation-dependent silencing that others and we have described (28,26), such as BRCA1 and hMLH1, the patterns of promoter hypermethylation in sporadic neoplasms recapitulate those tumor types observed in the inherited syndrome (42). However, this is not always the case and, for example, p16INK4a and E-cadherin are hypermethylated in many different tumor types (45), and are not restricted to those types where germline mutations in each gene confer an increased risk respectively of pancreas and stomach cancer. Second, the profile of hypermethylation showed that, in addition to non-melanoma skin tumors, for whose biology an important role for HS has been proposed (33,34), the most common target for EXT1 methylation-associated silencing was leukemia, in particular acute promyelocytic leukemia and acute lymphoblastic leukemia. In relation to this last type of malignancy and inheritance of EXT1 defects, it has occasionally described the association between HME and leukemia (46). Although the most extensive natural history studies of HME have not consistently reported this observation (1,47). For non-melanoma skin tumors, oral and skull exostoses have been associated with dermatofibromas an other proliferative skin lesions (48,49) and simultaneous generation of skin and bone tumors are common in irradiated mice (50).
We have demonstrated that the main malignancy type undergoing EXT1 CpG island hypermethylation is leukemia. It is known that cells from some patients with acute lymphoblastic leukemia, acute promyelocytic leukemia and acute myeloblastic leukemia are defective in their ability to interact with stromal cells and consequently cannot survive in stromal cell-mediated long-term marrow cultures (51). The leukemic cell populations residing within the bone marrow microenvironment relates to the presence of adhesion biomolecules (52–54). Especially in the bone marrow, HSGAGs bind growth factors involved in the control of hematopoiesis and thereby regulate leukemic cell differentiation (55). Consistent with this finding, a HS-associated fraction of the bone marrow matrix induces maturation of leukemia cells in vitro (56). Thus, the transendothelial migration of undifferentiated leukemic cells from the bone marrow could be explained at least in part by the absence of HS biosynthesis induced by EXT1 promoter hypermethylation. Furthermore, acute myelogenous leukemia, the leukemia type with the lowest frequency of EXT1 methylation, is that with the highest level of heparanase expression (57). This latter observation again suggests that the two pathways by which HS levels are disrupted in cancer cells are excluded: the blocking of HS production by hypermethylation of EXT1 as occurs in APL and ALL, and the increase in the degradation of HS by overexpression of heparanase, as occurs in the vast majority of solid tumors, probably including chondrosarcomas and osteosarcomas.
The detection of EXT1 hypermethylation in leukemias, particularly in APL, may have a very important clinical consequence. One of the most serious problems in the management of patients with APL is hemorrhagic complication, which often leads to early death. Up to 90% of patients present with hemorrhagic complications, secondary to disseminated intravascular coagulation (DIC). The frequency of DIC in APL patients is reported to be between 63 and 97% at presentation and during remission induction chemotherapy. In DIC, an increase of free thrombin in the circulation is followed by the upregulation of plasmin production that is responsible for the thrombotic and hemorrhagic manifestations characteristic of this pathology. HS proteoglycans can act as anticoagulant molecules by binding factors involved in the coagulation cascade (antithrombin III, TFPI) (58,59), and so it is reasonable to speculate that the EXT1 promoter hypermethylation demonstrated in APL patients could be one of the factors contributing to the development of the DIC that is characteristic of these patients.
In summary, our results suggest that the epigenetic silencing of EXT1 is a crucial event in the disruption of HS synthesis in transformed cells and an important step in the development of certain types of leukemia that may contribute to the physiopathologic and clinical features of this group of malignancies.
MATERIALS AND METHODS
Cell lines and tumor samples
The 79 human cancer cell lines examined in this study were obtained from the American Type Culture Collection (ATCC) (Rockland, MD, USA), the German Collection of Microorganisms and Cell Cultures (DSMZ, Braunschweig, Germany) or established at the Spanish National Cancer Centre. Twenty-six different tumor types were represented in our set of 79 tumoral cell lines: breast (MCF-7, T47D, SK-BR-3, CAMA1, ZR-75-2, MDA-MB-231, MDA-MB-453, MDA-MB-435), colon (SW48, DLD-1, HCT-116, CACO2, LoVo, RKO, SW620), lung (A549, DMS53, U1752, NCI-H522, NCI-H1770, NCI-H1299, NCI-H249, NCI-H209, NCI-H157, NCI-H5578, NCI-H80, NCI-H1990), prostate (PC-3, LnCAP), leukemia (MOLT-4, MOLT-16, HUT78, MV4-11, REH, HEL-R, THP-1, U-937, KG1a, HL-60, NB4, K562, Jurkat), melanoma (SK-MEL-3, SK-MEL-19, SK-MEL-18, SK-MEL-8), bladder (T24, RT-4), head and neck (UMSCC1), thyroid (TT), lymphoma (RAJI, KARPAS-422), liver (Hep G2), liposarcoma (SW-872, SR2103/1A, SR2103/1B), osteosarcoma (Saos-2, MG-63, SR0312), rhabdomyosarcoma (A-673), chondrosarcoma (Hs-819T, Cal-78, SW-1353), cervix (Hela, Hela-S3, SiHa, Ca Ski), ovary (MDAH-2774), teratocarcinoma (NTERA-2), choriocarcinoma (JEG-3), myeloma (U-266), brain (Daoy), non-melanoma skin cancer (HAKT), neuroblastoma (RS0306), leiomyosarcoma (CA1010, SR2410, LS0904), pleural fibrous tumor (SR2205) and Ewing's sarcoma (SR2910). Cell lines were maintained in appropriate media and treated with 3 µM 5-aza-2′-deoxycytidine (Sigma) for 3 days to achieve demethylation, as previously described (30).
The collection of primary tumor samples analyzed has been described elsewhere (41). New samples from chondrosarcomas, osteosarcomas and non-melanoma skin cancer were included in the current study. The Ethics Committee approved the study protocol. All samples were frozen in liquid nitrogen immediately after resection and stored at −80°C until processing. DNA was extracted by standard methods. The primary tumors analyzed (n=454) consisted of non-melanoma skin cancer (n=28), chondrosarcoma (n=52), osteosarcoma (n=28), lung (n=12), breast (n=12), colon (n=18), stomach (n=18), thyroid (n=40), endometrium (n=27), glioma (n=17), neuroblastoma (n=20), lymphoma (n=55), myelodysplastic syndrome (n=16) and leukemia (n=110).
DNA methylation analysis of the EXT1 and EXT2 genes
We established EXT1 and EXT2 CpG island methylation status by PCR analysis of bisulfite-modified genomic DNA, which induces chemical conversion of unmethylated, but not methylated, cytosine to uracil, using two procedures.
First, methylation status was analyzed by bisulfite genomic sequencing of both strands of the corresponding CpG islands. The primers used for EXT1 were 5′-GGG TTA TGA ATG GGY GTA GC-3′ (sense) and 5′-CTC ACA AAT CCC TAC ATC TCT C-3′ (antisense), located −149 bp and +236 bp from the transcription start site. The primers used for EXT2 were 5′-GTT TGT TGG AAT GAA GGG TAT TAG-3′ (sense) and 5′-CRC CAC TAC CAA AAC CRA AT-3′ (antisense), located −178 bp and +201 bp from the transcription start site.
The second analysis used methylation-specific PCR using primers specific for either the methylated or modified unmethylated DNA (60). Primer sequences of EXT1 for the unmethylated reaction were 5′-GGT TGT GTG GAT GGA TGA GGT TAG T-3′ (sense) and 5′-AAC AAC ACT TCA CAA ACC CCC AC-3′ (antisense) and for the methylated reaction, 5′-GGT TGC GTG GAT GGA TGA GGT TAG C-3′ (sense) and 5′-AAC AAC GCT TCG CAA ACC CCC GC-3′ (antisense). Primers were located −82 (sense) and +54 (antisense) from the transcription start site. Primer sequences of EXT2 for the unmethylated reaction were 5′-AGT ATT TTA TTG TGG AGT TTG AGT-3′ (sense) and 5′-TCT AAA CTA ACA AAC AAC AAA CAA-3′ (antisense) and for the methylated reaction, 5′-AGT ATT TTA TTG CGG AGT TTG AGC-3′ (sense) and 5′-TCT AAA CTA ACG AAC AAC GAA CGA-3′ (antisense). Primers were located +7 (sense) and +182 (antisense) from the transcription start site. The annealing temperature for both unmethylated and methylated reactions was 63°C for EXT1 and 56°C for EXT2. Bisulfite genomic sequencing analysis of the hSulf1 gene was developed using the primers 5′-TTG TGT TTG GAG TTT GGA TTT TAT T-3′ (sense) and 5′-ATA AAA AAT CCA ATA TCT CAC CCA A-3′ (antisense), which encompass its ATG translational start site. DNA from normal lymphocytes treated in vitro with SssI methyltransferase was used as a positive control for methylated alleles. DNA from normal lymphocytes was used as a positive control for unmethylated alleles. PCR products were loaded onto non-denaturing 3% polyacrylamide gels, stained with ethidium bromide and visualized under a UV transilluminator.
EXT1 RNA and protein analysis
An aliquot of RNA was isolated using TRIzol (Life Technologies, Gaithersburg, MD, USA). 2 µg of RNA was reverse-transcribed using SuperScript II reverse transcriptase (Gibco/BRL) and amplified using specific primers for EXT1 (forward: 5′-TTG GGT CCT TCA GAT TCC TG-3′, reverse: 5′-TCC TCC AGG ATG TTT GTT CC-3′) and for GAPDH (forward: 5′-TCT TCT TTT GCG TCG CCA G-3′, reverse: 5′-AGC CCC AGC CTT CTC CA-3′). PCR was performed for 35 cycles (94°C for 30 s, 57°C for 30 s and 72°C for 30 s) in a final volume of 25 µl containing 1× PCR buffer (Gibco/BRL), 1.5 mM MgCl2, 0.3 mM of dNTP, 0.25 mM of each primer and 2 U of Taq polymerase (Gibco/BRL). RT–PCR primers were designed between different exons and encompassing large introns to avoid any amplification of genomic DNA. GAPDH was used as an internal control to ensure cDNA quality and loading accuracy. The amplification products were resolved by 2% agarose gel electrophoresis and visualized by ethidium bromide staining.
Cell lysates for protein analysis were prepared and analyzed by western blotting using the EXT1 antibody N-16 (goat polyclonal antibody IgG; Santa Cruz Biotechnology, Santa Cruz, CA, USA). Equal loading was tested by reprobing with a polyclonal antibody against human topoisomerase I (Topogen, Inc., Columbus, OH, USA). Gels were cast using the XCell SureLock Mini-Cell system (Invitrogen Corp./NOVEX, Carlsbad, CA, USA) and developed using ECL immunodetection reagents (Amersham Pharmacia Biotech, Piscataway, NJ, USA).
Rubipy staining of cells
Cells were stained with Rubipy (tris(2,2′-bipyridine) ruthenium (II)), a cationic fluorochrome with affinity for polyanionic sulfates, as previously described (31). Cytospins prepared from cancer cell lines were fixed in 4% paraformaldehyde for 10 min at room temperature. Fixed slides were washed in phosphate-buffered saline (PBS), permeabilized with 0.5% Triton X-100 in PBS for 10 min, stained with 10 µg/ml Rubipy for 30 min, washed with distilled water, dehydrated in ethanol, cleared in xylene and mounted in DePeX (Serva, Heidelberg, Germany).
Heparitinase digestion of cell extracts
The heparitinase digestion of cancer cell extract was carried out as previously described (32). Cells were washed and resuspended in PBS supplemented with 1 mM CaCl2, 1 mM MgCl2 and protease cocktail inhibitors. Each aliquot of 106 cell/ml was digested with 1 U/ml of heparitinase or 1 U/ml heparinase at 37°C for 24 h. The digestion products were diluted in SDS–Laemli sample buffer, developed in 10% PAGE, detected by Rubipy staining (50 µg/ml in distilled water) and visualized in a UV transilluminator. The smear observed in the heparitinase-treated samples show the products of HS digestion because this enzyme is specific for HS and not for other GAGs (32).
Confocal microscopy analysis
Live HL-60, REH and KG1a cells were separated by floating on Ficoll solution, washed twice with PBS and resuspended in PBS (106 cells/ml). An aliquot of 500 µl of cell suspension was incubated with 2 µg of mouse IgM or 10E4 mAB for 30 min at 4°C, washed twice with PBS and incubated with 2 µg of Alexa 488-coated anti-mouse IgM at 4°C for 30°min. After antibody incubations, cells were washed and resuspended in 100 µl PBS and visualized by confocal microscopy.
Flow cytometric assays
Flow cytometric was performed as previously described (61). Briefly, cells were washed once and resuspended PBS/FBS (PBS supplemented with 1 mM MgCl2, 1 mM CaCl2 and 1% heat-inactivated FBS). Aliquots of each sample containing 5×10⁵ cells/0.5 ml were incubated with 2 µg of mouse IgM or 10E4 mAB (an IgM mAb to the native HS chain of proteoglycans; USBiological, Swampscott, MA, USA) at RT for 1 h, washed with PBS/FBS and incubated with 2 µg of Alexa 488-coated anti-mouse IgM at RT for 1h. Finally, cells were washed and resuspended in 500 µl of PBS/FBS for immediate flow cytometric analysis.
EXT1 Transfection
For transfection experiments, we used the pEGFP–N1 vector containing the EXT1 gene, kindly provided by Dr. Esko, or the pEGFP–N1 empty vector. Transfection of HL-60 cells was performed by electroporating 107 cells in 0.8 ml PBS with 40 µg of the vector at 250 V and 975 µF. After electroporation, cells were washed with PBS and seeded with 106 cells/ml in fresh medium containing 20% FBS. Transfected cells were selected by the addition of G418 (600 µg/ml).
Colony formation assay
Colony formation on methylcellulose medium (Stemcell Technologies) was assayed. Transfected cells were added to a medium containing 80% methylcellulose and 20% conditioned medium from HL-60 cultures and 600 µg/ml of G418. The mixture was then placed in a six-well plate and incubated for 15 days. Colonies containing more than 20 cells were scored as positive.
Mouse xenograft model
Six-week-old female athymic nude mice nu/nu (Harlam Sprague Dawley, Indianapolis, IN, USA), housed under specific pathogen-free conditions (Institutional Animal Welfare Committee Agreement), were used for HL-60 tumor xenografts. Five specimens were used. Both flanks of each animal were injected s.c. with 106 cells in a total volume of 200 µl of PBS. The right flank was always used for EXT1-HL-60-transfected cells and the left for empty-vector HL-60 control cells. Tumor development at the site of injection was evaluated daily. Animals were sacrificed at 8 days. The tumors were then excised and weighed.
ACKNOWLEDGEMENTS
This work has been supported by the I+D project SAF 2001-0059 and Fondo de Investigación Sanitaria FIS99/0235. S.R. is funded by the Comunidad Autonoma de Madrid.
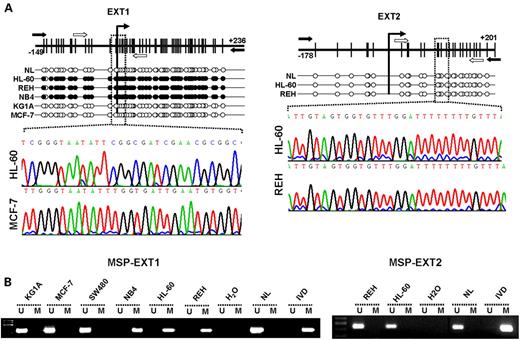
Figure 1. Analysis of EXT1 and EXT1 CpG island promoter methylation status in human cancer cell lines. (A) Schematic depiction of the EXT1 and EXT2 CpG islands around the corresponding transcription start sites (long black arrows). CpG dinucleotides are represented as short vertical lines. Location of bisulfite genomic sequencing PCR primers are indicated as black arrows and methylation-specific PCR primers as white arrows. Representative examples of the chromatograms obtained by bisulfite genomic sequencing of human cancer cell lines are shown (a magnified boxed fragment is displayed). The presence of ‘Cs’ in the dinucleotide CpG reflects methylated cytosines (black dots), whereas the presence of ‘Ts’ in the dinucleotide CpG reflects unmethylated cytosines (white dots). (B) Methylation-specific PCR for the EXT1 and EXT2 genes in human cancer cell lines. The presence of a PCR band under the lane M indicates methylated genes, whereas the presence of a PCR band under the lane U indicates unmethylated genes. Normal lymphocytes (NL) and in vitro methylated DNA (IVD) are used as negative and positive control for unmethylated and methylated genes, respectively.

Figure 2. EXT1 CpG island methylation is associated with EXT1 gene silencing. (A) Methylation-specific PCR showing demethylation of the HL-60 cell line following treatment with the demethylating agent 5-aza-2-deoxycytidine (lane HL-60 AZA). (B) RT–PCR analysis of EXT1 expression. The EXT1 hypermethylated cell lines, HL-60, REH and NB4, do not express the EXT1 transcript. The treatment with the demethylating agent reactivates EXT1 gene expression (lanes HL-60 AZA, REH AZA and NB4 AZA). The unmethylated cell lines MCF7 and KG1a express EXT1 transcript. GAPDH expression is shown as loading control. (C) Western blot analysis of EXT1 expression. The EXT1 hypermethylated cell lines, HL-60 and REH, do not express the EXT1 protein. The treatment with the demethylating agent reactivates EXT1 gene expression (lanes HL-60 AZA and REH AZA). Loading control is shown below.
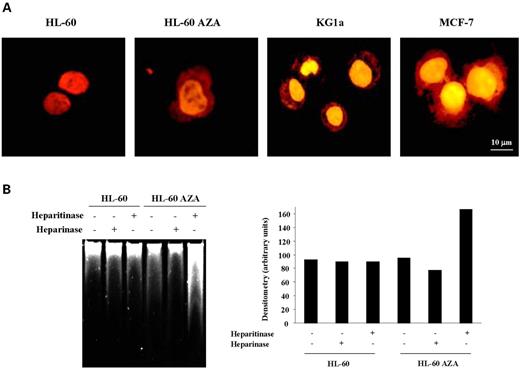
Figure 3. Analysis of sulfated polyanions in human cancer cell lines. (A) Specific detection of sulfated polyanions with the cationic complex of ruthenium, Rubipy, in human cells after re-expression of EXT1 induced by demethylating treatment. HL-60 control cells showed Rubipy staining only in chromatin. In sharp contrast, HL-60 cells treated with the demethylating drug showed Rubipy staining of phosphate polyanions in chromatin as well as a strong signal in the cytoplasm and plasma membrane, mainly attributable to sulfated polyanions (GAGs). KG1a and MCF7 cells, unmethylated and expressing EXT1, showed a Rubipy staining pattern similar to that observed in 5-aza-2-deoxycytidine-treated cells. (B) HL-60 cell extracts, before and after demethylating treatment, were digested with heparitinase, an enzyme that degrades specifically HSGAGs, or with heparinase, an enzyme that degrades other GAGs. 5-Aza-2′-deoxycytidine induced a significant increase in the GAG smear obtained from running the heparitinase digestion in a gel (left) and its densitometric analysis developed on cells that are below saturation (right).
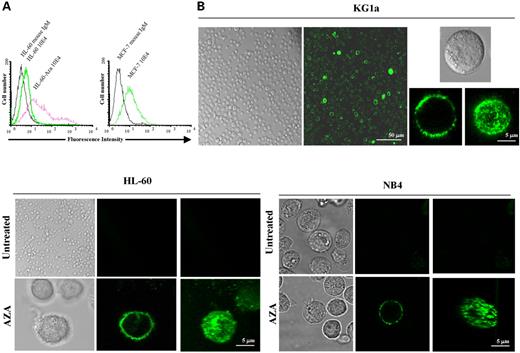
Figure 4. HS expression is abolished in EXT1-methylation-deficient cancer cell lines. (A) Flow cytometry analysis of HS expression in untreated HL-60 cells and after 5-aza-2′-deoxycytidine treatment using the 10E4 (a mAb to HS). MCF-7 cells were used as control cells unmethylated and expressing EXT1. A mouse IgM that does not bound neither HL-60 nor MCF-7 was used as control for the absence of fluorescence. Lack of HS expression is observed in HL-60 cells and it is restored by treatment with the demethylating agent. Results are presented as histograms of the log fluorescence intensisities from 2×10⁴ cells. (B) Confocal microscopy analysis of HS expression in HL-60 and NB4 cells before and after 5-aza-2′-deoxycytidine treatment. KG1a cell line was used as control cells unmethylated and expressing EXT1. Cells were incubated with specific HS antibody. Both HL-60 and NB4 cells are completely deficient in HS expression, and the demethylating drug restores its expression, as it demonstrated in the transversal sections of the cells and the three-dimensional reconstruction.
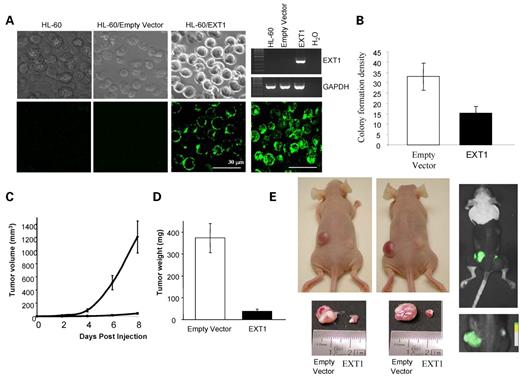
Figure 5. Tumor-suppressor-like properties of EXT1 re-introduction. (A) EXT1 expression monitored and HS biosynthesis in untransfected, empty vector-transfected and EXT1-transfected HL-60 cells monitored by RT–PCR or confocal microscopy using an anti-HS monoclonal antibody (10E4), respectively. (B) Densitometric quantification of the colony formation density of HL-60 cells tranfected with the empty vector or with EXT1. Three independent experiments were carried out. (C) Effect of EXT1 transfection on the in vivo growth of HL-60 cells. Tumor size was monitored over time, and size is shown in cubic milimeters. (D) Tumoral weight data at 8 days from empty vector- and EXT1-transfected HL-60 xenografts presented as mean±SD. (E) Female athymic nude mice 8 days after injection of 106 HL-60 cells (left). Note the large tumor on the left flank, corresponding to empty vector-HL-60 cells, and the small tumor on the opposite flank, corresponding to EXT1-HL-60 cell injection. Tumors were excised cautiously to avoid skin contamination and then weighed. Tumor detail and weight in mg. Positive transfected cells were detected by direct eGFP measurements (right).
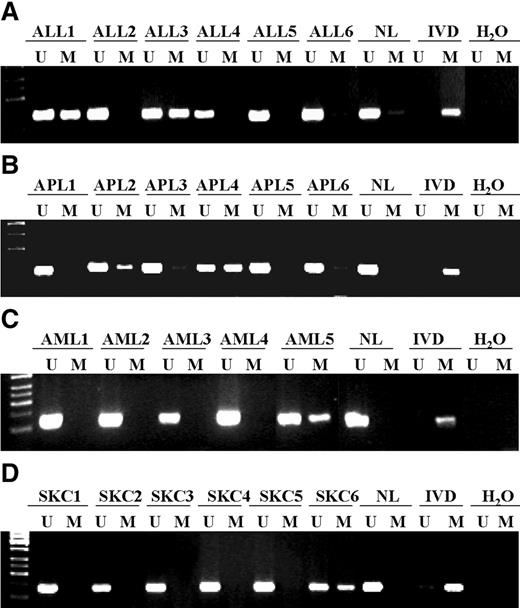
Figure 6. Analysis of EXT1 CpG island hypermethylation in primary human malignancies. (A) Acute lymphoblastic leukemias (ALL1-6). (B) Acute promyelocytic leukemias (APL1-6). (C) Acute myelogenous leukemias (AML1-5). (D) Non-melanoma skin cancer (SKC1-6). The presence of a PCR band under the lane M indicates methylated genes, whereas the presence of a PCR band under the lane U indicates unmethylated genes. Normal lymphocytes (NL) and in vitro methylated DNA (IVD) are used as negative and positive control for unmethylated and methylated genes, respectively.
Profile of EXT1 CpG island hypermethylation in human primary malignancies
| Types of malignancy | ||||||||||||
|---|---|---|---|---|---|---|---|---|---|---|---|---|
| APL | ALL | AML | CML | MDS | SKC | Other tumor typesa | ||||||
| Primary tumors (n=454) | 25% (8/31) | 32% (12/37) | 7.4% (2/27) | 0% (0/17) | 0% (0/16) | 14.2% (4/28) | 0% (0/299) | |||||
| Cell lines (n=79) | 100% (2/2) | 20% (1/5) | 0% (0/4) | 0% (0/1) | – | 0% (0/1) | 0% (0/66) | |||||
APL, acute promyelocytic leukemia; ALL, acute lymphoblastic leukemia; CML, chronic myeloid leukemia; MDS, myelodysplastic syndrome; SKC, non-melanoma skin cancer.
aAs described in Materials and Methods.
Clinical significance of EXT1 hypermethylation in leukemias
| ALL (n=37) | APL (n=28) | |||
|---|---|---|---|---|
| Good cytogenetic prognosis | Poor cytogenetic prognosis | ATRA response | ATRA lack of response | |
| Methylated | 7 | 5 | 3 | 3 |
| Unmethylated | 6 | 19 | 20 | 2 |
| P=0.04 | P=0.05 | |||
| ALL (n=37) | APL (n=28) | |||
|---|---|---|---|---|
| Good cytogenetic prognosis | Poor cytogenetic prognosis | ATRA response | ATRA lack of response | |
| Methylated | 7 | 5 | 3 | 3 |
| Unmethylated | 6 | 19 | 20 | 2 |
| P=0.04 | P=0.05 | |||
ALL, acute lymphoblastic leukemia; APL, acute promyelocytic leukemia. P-values were obtained by Fisher's exact test.
References
Schmale, G.A., Conrad, E.U. and Raskind, W.H. (
Wuyts, W. and Van Hul, W. (
Cook, A., Raskind, W., Blanton, S.H., Pauli, R.M., Gregg, R.G., Francomano, C.A., Puffenberger, E., Conrad, E.U., Schmale, G., Schellenberg, G. et al. (
Wu, Y.Q., Heutink, P., de Vries, B.B., Sandkuijl, L.A., van den Ouweland, A.M., Niermeijer, M.F., Galjaard, H., Reyniers, E., Willems, P.J. and Halley, D.J. (
Le Merrer, M., Legeai-Mallet, L., Jeannin, P.M., Horsthemke, B., Schinzel, A., Plauchu, H., Toutain, A., Achard, F., Munnich, A. and Maroteaux, P. (
Francannet, C., Cohen-Tanugi, A., Le Merrer, M., Munnich, A., Bonaventure, J. and Legeai-Mallet, L. (
Langer, L.O., Krassikoff, N., Laxova, R., Scheer-Williams, M., Luter, L.D., Gorlin, R.J. and Jennings C.J. (
Bartsch, O., Wuyts, W., Van Hul, W., Hecht, J.T., Meinecke, P., Hogue, D., Werner, W., Zabel, B., Hinkel, G.K., Powell, C.M., Shaffer, L.G. and Willems, P.J. (
Wuyts, W., Bartsch, O., Wilkie, A.O., Meinecke, P. and Van Hul, W. (
McCormick, C., Leduc, Y., Martindale, D., Mattison, K., Esford, L.E., Dyer, A.P. and Tufaro, F. (
Lind, T., Tufaro, F., McCormick, C., Lindahl, U. and Lidholt, K. (
Kobayashi, S., Morimoto, K., Shimizu, T., Takahashi, M., Kurosawa, H. and Shirasawa, T. (
McCormick, C., Duncan, G., Goutsos, K.T. and Tufaro, F. (
Lin, X., Wei, G., Shi, Z., Dryer, L., Esko, J.D., Wells, D.E. and Matzuk, M.M. (
Wei, G., Bai, X., Gabb, M.M.G., Bame, K.J., Koshy, T.I., Spear, P.G. and Esko, J.D. (
Hecht, J.T., Hogue, D., Strong, L.C., Hansen, M.F., Blanton, S.H. and Wagner, M. (
Raskind, W.H., Conrad, E.U., Chansky, H. and Matsushita, M. (
Hogue, D.A., Clines, G., Lovett, M., Hansens, M.F. and Hecht, J.T. (
Hecht, J.T., Hogue, D., Wang, Y., Blanton, S.H., Wagner, M., Strong, L.C., Raskind, W., Hansen, M.F. and Wells, D. (
Mertens, F., Rydholm, A., Kreicbergs, A., Willen, H., Jonsson, K., Heim, S., Mitelman, F. and Mandahl, N. (
Bridge, J.A., Bhatia, P.S., Anderson, J.R. and Neff, J.R. (
Bovee, J.V., Cleton-Jansen, A.M., Wuyts, W., Caethoven, G., Taminiau, A.H., Bakker, E., Van Hul, W., Cornelisse, C.J. and Hogendoorn, P.C. (
Esteller, M. (
Herman, J.G. and Baylin, S.B. (
Lai, J.P., Chien, J.R., Moser, D.R., Staub, J.K., Aderca, I., Montoya, D.P., Matthews, T.A., Nagorney, D.M., Cunningham, J.M., Smith, D.I. et al. (
Herman, J.G., Umar, A., Polyak, K., Graff, J.R., Ahuja, N., Issa, J.P., Markowitz, S., Willson, J.K., Hamilton, S.R., Kinzler, K.W. et al. (
Katzenellenbogen, R.A., Baylin, S.B. and Herman, J.G. (
Esteller, M., Cordon-Cardo, C., Corn, P.G., Meltzer, S.J., Pohar, K.S., Watkins, D.N., Capella, G., Peinado, M.A., Matias-Guiu, X., Prat, J. et al. (
Bertolesi, G.E., Trigoso, C.I., Espada, J. and Stockert, J.C. (
Rozenberg, G.I., Espada, J., de Cidre, L.L., Eijan, A.M., Calvo, J.C. and Bertolesi, G.E. (
Oguro, K., Kazama, T., Isemura, M., Nakamura, T., Akai, S. and Sato, Y. (
Kazama, T., Isemura, M., Nakamura, T. and Ito, M. (
Vlodavsky, I., Mohsen, M., Lider, O., Svahn, C.M., Ekre, H.P., Vigoda, M., Ishai-Michaeli, R. and Peretz, T. (
Vlodavsky, I., Friedmann, Y., Elkin, M., Aingorn, H., Atzmon, R., Ishai-Michaeli, R., Bitan, M., Pappo, O., Peretz, T., Michal, I. et al. (
Mrozek, K., Heerma, N.A. and Bloomfield, C.D. (
Tallman, M.S., Andersen, J.W., Schiffer, C.A., Appelbaum, F.R., Feusner, J.H., Ogden, A., Shepherd, L., Willman, C., Bloomfield, C.D., Rowe, J.M. et al. (
Melnick, A. and Licht, J.D. (
Bernstein, L.R. and Liotta, L.A. (
Sasisekharan, R., Shriver, Z., Venkataraman, G. and Narayanasami, U. (
Senay, C., Lind, T., Muguruma, K., Tone, Y., Kitagawa, H., Sugahara, K., Lidholt, K., Lindahl, U. and Kusche-Gullberg, M. (
Hecht, J.T., Hall, C.R., Snuggs, M., Hayes, E., Haynes, R. and Cole, W.G. (
Esteller, M., Corn, P.G., Baylin, S.B. and Herman, J.G. (
Gozdasoglu, S., Uysal, Z., Kurekci, A.E., Akarsu, S., Ertem, M., Fitoz, S., Ikinciogullari, A. and Cin, S. (
Wicklund, C.L., Pauli, R.M., Johnston, D. and Hecht, J.T. (
Chaudhry, S.I., Tappuni, A.R. and Challacombe, S.J. (
Viljoen, D.L., Versfeld, G.A,, Losken, W. and Beighton, P. (
Ootsuyama, A., Tanaka, K. and Tanooka, H. (
Dexter, T.M., Coutinho, L.H., Spooncer, E., Heyworth, C.M., Daniel, C.P., Schiro, R., Chang, J. and Allen, T.D. (
Reuss-Borst, M.A., Buhring, H.J., Klein, G. and Muller, C.A. (
Makrynikola, V. and Bradstock, K.F. (
Dexter, T.M., Coutinho, L.H., Spooncer, E., Heyworth, C.M., Daniel, C.P., Schiro, R., Chang, J. and Allen, T.D. (
Luikart, S.D., Maniglia, C.A., Furcht, L.T., McCarthy, J.B. and Oegema, R., Jr (
Bitan, M., Polliack, A., Zecchina, G., Nagler, A., Friedman, Y., Nadav, L., Deutsch, V., Pecker, I., Eldor, A., Vlodavsky, I. et al. (
Jin, L., Abrahams, J.P., Skinner, R., Petitou, M., Pike, R.N. and Carrell, R.W. (
Ho, G., Broze, G.J. and Schwartz, A.L. (
Herman, J.G., Graff, J.R., Myohanen, S., Nelkin, B.D. and Baylin, S.B. (
