


Abstract
It is well established that gene interactions influence common human diseases, but to date linkage studies have been constrained to searching for single genes across the genome. We applied a novel approach to uncover significant gene–gene interactions in a systematic two-dimensional (2D) genome-scan of essential hypertension. The study cohort comprised 2076 affected sib-pairs and 66 affected half-sib-pairs of the British Genetics of HyperTension study. Extensive simulations were used to establish significance thresholds in the context of 2D genome-scans. Our analyses found significant and suggestive evidence for loci on chromosomes 5, 9, 11, 15, 16 and 19, which influence hypertension when gene–gene interactions are taken into account (5q13.1 and 11q22.1, two-locus lod score=5.72; 5q13.1 and 19q12, two-locus lod score=5.35; 9q22.3 and 15q12, two-locus lod score=4.80; 16p12.3 and 16q23.1, two-locus lod score=4.50). For each significant and suggestive pairwise interaction, the two-locus genetic model that best fitted the data was determined. Regions that were not detected using single-locus linkage analysis were identified in the 2D scan as contributing significant epistatic effects. This approach has discovered novel loci for hypertension and offers a unique potential to use existing data to uncover novel regions involved in complex human diseases.
INTRODUCTION
Hypertension is the pathological elevation of arterial blood pressure and is a modifiable risk factor for cerebrovascular and coronary heart disease. Genetic factors are implicated, but estimates of the risk ratio to siblings of affected individuals are modest (1.5–3.5) and heritability estimates, which vary between populations of differing ancestries and environments, range from 30 to 50% in the UK (1). The clinical importance of essential hypertension and the desire to identify susceptibility genes that might provide clues for novel treatments have motivated numerous gene-mapping studies; however, genome-wide linkage scans have shown inconsistent results (2–5).
Linkage analysis in cohorts of informative families is typically applied to map individual susceptibility genes for human complex disease by searching the entire genome in a one-dimensional (1D) genome-scan. Difficulties in mapping susceptibility loci have delayed progress in this field, perhaps because of insufficient sample sizes or low power to detect loci of modest effects. An alternative explanation is that the substantial contribution of epistasis (gene interaction) to many human diseases reduces the power of single-locus linkage analysis (6–8). The presence of epistatic interactions and locus heterogeneity in the underlying genetics of hypertension may explain the lack of replicated linkage to date (9). Linkage tests for multiple susceptibility loci have been developed and applied to human data (10,11), but these methods have examined only pre-selected regions.
Multidimensional scans of complex traits in model organisms have successfully identified novel loci that act through epistatic pathways. For example, Sen and Churchill (12) have investigated strategies for simultaneous genome scans that demonstrate evidence for interactions among novel loci that have no significant single-locus effects in experimental (murine) line-crosses. Similar studies have been performed in different model organisms for a range of complex phenotypes (13,14), including hypertension in rats (15). The results indicate that these approaches can identify novel regions that contribute to the traits through a genetic interaction and determine the most likely epistatic or additive model for each pair of contributing loci. The success of studies using model organisms suggests that there is intrinsic merit in considering linkage methods that jointly model multiple susceptibility loci and search for multiple interacting genes simultaneously across the genome (8) and encourages the application of analogous approaches to the numerous existing human linkage data sets (16,17). Although several studies have examined interactions between specific genes involved in hypertension in humans (9,18), there has been no systematic genome-wide scan for epistasis derived from human linkage data sets.
We have developed a novel computational strategy to perform a simultaneous genome-wide search for linkage in affected sibling pairs (ASPs) in humans under a flexible model of epistasis. Our approach is an extension of the two-locus non-parametric linkage methods of Cordell et al. (10) and Farrall (19). This enabled us to undertake a systematic two-dimensional (2D) linkage scan of the British Genetics of HyperTension (BRIGHT) study data set. The cohort represents one of the largest homogenous genetic studies of hypertension, with over 2000 strictly defined ASPs (4). Genome-wide significance thresholds for 2D scans were obtained using typical ASP linkage data. Our analysis identified significant peaks in the 2D surface, indicating novel loci for hypertension, which were examined to determine the exact model of epistasis that best fit each pairwise interaction.
RESULTS
Genome-wide significance thresholds
It is necessary to establish appropriate significance thresholds in multidimensional genome-scans to determine the overall significance of the results (20). Genome-wide significance thresholds were obtained using 2D genome-wide simulations of typical ASP linkage screens with missing parental data, average marker spacing of 8 cM and partially informative markers. In the simulations, we compared the general two-locus genetic model, including interaction effects, with a null genetic model, in which neither gene in the pair contributes to the trait. The resulting two-locus maximum lodscore (MLS) thresholds over the entire 2D surface for the general genetic model were 5.84 and 6.77, for type 1 error rates of 0.05 and 0.01, respectively. These thresholds were used to assess genome-wide significance for the majority of tests in the 2D surface (95%), which involve non-syntenic pairs of loci. However, for syntenic loci, the distribution of the MLS in the absence of linkage is a function of the recombination fraction that separates the pair of loci, for instance, in the case of two fully informative markers, more tightly linked genes have lower nominal significance thresholds (Fig. 1A). Therefore, two-locus MLSs have a different interpretation depending on whether two genes map close together or further apart. The genome-wide significance thresholds used for syntenic loci should be comparable to those used for non-syntenic loci, and therefore, we adjusted them to take into account the recombination fraction separating the pair of loci. To achieve this, an adjustment in lod units is made to each of the observed syntenic MLS in the calculation of the genome-wide P-value using MLS thresholds on the basis of the entire 2D surface (5.84 and 6.77), which is predominantly composed of pairs of non-syntenic loci. The magnitude of adjustment depends on the recombination fraction separating the two syntenic loci and was estimated using a portion of the 2D simulation results from syntenic pairs of loci (Fig. 1B).
2D linkage analysis
We performed a 2D linkage scan by computing the two-locus MLS at each marker-pair, so as to form a 2D irregular grid of marker coordinates across the genome (Fig. 2A). Several peaks in the 2D surface identified pairs of loci that interact and significantly contribute to hypertension susceptibility (Table 1). These regions did not have significant (21) effects on hypertension in the single-locus scan (Fig. 2B). For each peak, we examined two-locus genetic models in detail, starting with a general model that fits a wide range of epistatic models, and then restricted the number of free parameters in a stepwise manner to estimate the model that best fits the interaction (Table 1). To determine the degree of epistasis in the genetic model, we used the maximum likelihood estimate of the epistatic parameter, ε, supported by the difference in MLS computed under different epistatic models. The results from the 2D non-syntenic and syntenic regions are presented separately along with estimates of nominal and genome-wide significance for the peak findings.
For non-syntenic regions, the highest peak over the 2D surface was obtained for two loci on chromosomes 5 and 11 (Table 1). The two loci mapped to chromosomes 5q13.1 and 11q22.1, both of which showed suggestive evidence for linkage in the 1D linkage scan. The two-locus MLS was 5.45 increasing to 5.72 under a fine-scale grid scan at an average spacing of 2 cM (Fig. 3A) and was marginally genome-wide significant at P=0.08 with a confidence interval of (0.06–0.1). There was evidence of epistasis at this coordinate as suggested by significant differences between the MLS under the general (5.45) and additive (3.84) models (difference=1.61, P=0.0013) and the general and multiplicative (4.05) two-locus models (difference=1.4, P=0.0016) and a two-locus MLS of 5.45 under the ε-epistatic model with a maximum-likelihood estimate of ε at 100 (1-lod unit support interval: 4–103). The second highest non-syntenic peak in the surface also involved region 5q13.1 in a pairwise interaction with a locus on 19q12 (Table 1). The lodscore for this interaction increased from 5.12 under the sparse search to 5.35 under a fine-grid scan (Fig. 3B), with a genome-wide P=0.15. The best genetic model describing this interaction was a model of strong epistasis (ε≥103), supported by a significant difference between the general (5.12) and additive (2.85) models (difference=2.27, P=0.0001) and the general and multiplicative models (difference=2.14, P=4×10⁻⁵). The 2D genome-scan also identified a potential interaction between regions 9q22.3 and 15q12 (Fig. 3C) with a two-locus MLS of 4.8 approximated by a strong epistatic model (Table 1) and several other interactions between non-syntenic regions that reached genome-wide suggestive evidence for linkage (Table 2).
For syntenic regions, the most significant result identified two loci on chromosome 16 (16p12.3 and 16q23.1), which have no significant or suggestive effect on hypertension under single-gene models, but contribute to the phenotype under a two-locus model of strong epistasis (Table 1). The two loci underlying this peak are separated by 0.33 units of recombination, resulting in an adjustment of 0.14 lod units when evaluating the genome-wide P-value. The resulting genome-wide P-value is 0.34, whereas the interaction is nominally significant at P<1×10⁻⁴. A fine-grid scan of this region at an average 2 cM density for the analysis resulted in an MLS increase from 4.37 to 4.5 (Fig. 3D). The best-fitting model for this coordinate on chromosome 16 is an extreme epistasis model (ε≥103), supported by a highly significant difference between the MLS computed under the general (4.37) and additive (0.53) two-locus models (difference=3.84, P<1×10⁻⁵) and the general and multiplicative (0.63) genetic models (difference=3.74, P<1×10⁻⁵). The 2D scan also identified novel regions on chromosomes 5 and 9, which again involve pairs of syntenic loci (Table 2) and were nominally significant; however, the two-locus MLS results for these regions did not reach genome-wide significance. In both cases, there was suggestive evidence for linkage to one region in each pair in the 1D scan (MLS>1).
For each syntenic and non-syntenic 2D interaction, we obtained the 1-lod unit (LU) support intervals as a means of narrowing down chromosomal regions within which to search for underlying genetic variants (Table 2). For the four most significant pairwise interactions, we also compared confidence intervals obtained from the 1D scan for loci with single-locus MLS>1 (5q13.1, 9q31.1, 11q22.1 and 15q12) to support intervals from the 2D scan. On chromosome 5, the support region obtained from the 2D results was 13.7 cM (79.1–92.8) when compared with 23.5 cM obtained from the 1D results. The 2D interval on chromosome 9 was 22.7 cM (93.7–116.4), compared with the 1D support interval of 39 cM. On chromosome 11, the 2D support interval was 19.5 cM (106.8–126.3), falling from 29.3 cM under single-locus analysis. Finally, on chromosome 15, the 2D 1-LU support interval was 18.5 cM (5–23.5), which was reduced from 23 cM in the 1D results.
Sensitivity to map specification
We examined the results of the 2D analysis under three different genetic maps, Rutgers (22), deCode (23) and Marshfield (24). Variation in the two-locus MLS score across different genetic maps was observed, in particular, for pairs of loci which both mapped to the same chromosome. Table 2 presents the two-locus MLS results for significant and suggestive 2D peaks from the Rutgers map computed under the three different genetic maps. The MLS at the peak coordinates in the Rutgers map differs across analyses performed by assuming the Marshfield and deCode maps. The peak MLS often shifts to a coordinate in the proximity of the original peak when computed under a different genetic map. Of the 2D peaks obtained under the Rutgers map, the chromosome 16 syntenic peak achieved genome-wide significance under the Marshfield map (P=0.02) and the peak interactions involving 5q13.1 reached genome-wide P-values under the deCode map similar to those obtained under the Rutgers genetic map (5q13.1 and 11q22.1, P=0.07; 5q13.1 and 19q12, P=0.09).
Locus-counting analyses
The method of locus-counting (25) is complementary to estimating genome-wide significance levels and may be used to evaluate the joint significance of complex-trait genome-scan results. This approach estimates the probability of observing a number of linkage peaks above a pre-defined MLS threshold when compared with the number expected under no genetic influence. First, we extended this approach to two loci by counting the number of times that a 2D peak surpassed a given lodscore threshold per 2D scan by re-examining the 2D simulations, focusing only on coordinates which involved genes located on different chromosomes. Our results indicate that significantly more peaks between markers on different chromosomes contributed to hypertension than expected by chance alone (Fig. 1C). For example, the probability of observing 10 peaks above or at a two-locus MLS threshold of 4.31 was only 0.009 under the null hypothesis of no linkage. On the basis of our findings, a two-locus MLS of 4.3 is expected to occur once by chance in a 2D genome-scan, hence we can use 4.3 as the threshold to designate a two-locus peak as showing ‘suggestive’ evidence for linkage in a 2D scan with an average spacing of 8 cM. Second, we determined whether any region was over-represented among the 2D peaks than was expected by chance. We counted the number of times that the same region was involved in the top 10 peaks per simulated 2D scan for genes on different chromosomes. The simulation results indicated that the same region would be expected to be represented, on average, 3.01 times in the 10 peak coordinates, whereas we found that chromosome 5q13.1 was represented six times (Table 2).
DISCUSSION
We have shown that it is computationally feasible to apply a novel approach, a simultaneous search, to calculate a 2D linkage grid for typical human genome-scan data. The purpose of performing a 2D linkage scan is 2-fold: first, to identify novel regions that contribute to the trait via a genetic interaction, and second, to detect interactions between pairs of contributing loci and describe the best genetic model that fits the interaction.
The 2D scan of hypertension identified regions that have no significant or suggestive (21) effect on hypertension in the single-locus scan, but that contribute to the phenotype under two-locus models. Of particular interest is the interaction of two linked loci on chromosome 16, for which we do not find evidence for linkage in the single-locus analysis. The region on chromosome 16p13.1 was previously implicated in systolic blood pressure in different studies (2,5). A genome-wide scan of both systolic and diastolic blood pressures reports suggestive evidence for linkage to 16p13 in 114 African American families (3). In addition, Xu et al. (26) performed a single-locus linkage scan of systolic blood pressure in 99 low-concordant sibling pairs, which indicated a linked region on chromosome 16 between 16p13.1 and 16q23.1, maximizing at 16q12.1. Our analysis is consistent with the hypothesis that these linkage results are due to two separate loci, each mapping on opposite flanks of the single-locus peak, the effects of which superimpose to generate a single-locus peak mid-way between the two loci. Similarly, on chromosome 5, the 1D peak in our data mapped between the two loci identified from the 2D scan. These results suggest that signals from two separate loci superimpose to generate a single-locus peak between the two contributing loci in our data. There is prior evidence for linkage of systolic blood pressure to a region at 5q14 (5) and diastolic blood pressure to 5q15 (27), 15 and 23 cM distal to 5q13.3, respectively. However, we are not aware of previous studies implicating either 5p14.1 or locus on chromosome 9 (9p24.2 and 9q31.1) in the 2D scan syntenic results.
The highest peak over the entire 2D surface was obtained between chromosomes 5q13.1 and 11q22. We obtained suggestive evidence for linkage to both regions from the 1D scan, and previous studies have shown linkage to regions distal to the locus on chromosome 5 (5,27) and have implicated 11q21 (3). The two-locus analysis indicated that these two loci interact epistatically, however, the evidence for epistasis on chromosome 16 is stronger. Chromosome 5q13.1 was involved in several of the highest 2D peaks in the surface, including the interaction with a locus on 19q12, which is 20 cM distal to a previously reported linkage signal for systolic blood pressure (27). The regions involved in the 2D significant and suggestive interactions were examined to define support intervals for localization of contributing loci using the 1-LU support intervals. There was a reduction in the support intervals obtained from the 1D scan for loci with suggestive single locus evidence for linkage. On chromosome 5, we observed three 2D support intervals, two of which (at 5q13.1 and 5q13.3) overlap. It is possible that the underlying interaction model involving chromosomes 5 and 11 is a three-locus genetic model, with an interaction between 5p14.1, 5q13.3 and 11q22, although no significant evidence for epistasis was obtained between 5p14.1 and 11q22.
The 1-LU support intervals from the most significant pairwise interactions allowed us to narrow down regions containing putative susceptibility loci. The size of each region varied and there were many potential candidate genes underlying the peaks. Identifying genes in the same of related pathways, for example, using KEGG (28), could be a first step in identifying the genes that interact. For the interacting loci found on chromosome 16, KEGG analysis reveals genes involved in oxidative metabolism, glycerolphospholipid metabolism and aminoacyl-tRNA biosynthesis. Alternatively, genes could be selected for specific analysis if there were data indicating a role in blood pressure regulation. For some of the epistatic loci detected in our 2D analysis, there are interesting potential candidates, which might be further explored, for example, sodium–hydrogen exchanger, 11 betahydroxysteroid dehydrogenase, Nedd 4-like E3 ligase, epithelial sodium-channel subunits and a dopamine receptor. However, a more comprehensive strategy would be to fine map all the regions first allowing for epistasis. This approach would facilitate exploration of the relationship between statistical and biological epistases in more detail and would aid interpretation of our findings in a biological context (29,30).
Multidimensional grid searches involve multiple testing, making it crucial to control the overall type 1 error (20). Lander and Botstein (16) suggested using an n-fold higher threshold for the linkage test statistic before declaring significance in an n-dimensional scan, but choosing an excessively conservative threshold reduces the power to find significant interactions or any linkage at all. To avoid the reduction in power, the search for interactions could be restricted to a limited number of pre-selected portions of the genome that have detectable main effects (31) or are plausible biological candidates (32,33). This approach will reduce the number of tests performed but would fail to detect interactions among loci that have no significant or suggestive main effects. It is possible to obtain large epistatic effects in the absence of single-locus effects in association analysis (34), but for multilocus linkage methods, this may depend on whether one performs conditional (11,31) or joint (10, present study) two-locus linkage analysis. Although most of the 2D coordinates identified in our study include at least one region which shows suggestive single-locus evidence for linkage (MLS>1), we do obtain evidence for interactions among regions (chromosome 16) that do not have significant or suggestive single-locus effects on the trait. This is consistent with the results from previous multidimensional scans on the basis of genotype data in model organisms, which detect evidence for epistatic loci with no marginal effects.
The 2D scan strategy requires that we resolve how to consider pairs of genes that map close together on the same chromosome as opposed to genes that localize further apart or on different chromosomes. Under the null hypothesis of no linkage, the distribution of the test-statistic depends on the recombination fraction. Under two-locus additive and epistatic models, the power to detect a second susceptibility gene in the presence of a disease locus increases for greater recombination fractions between the two loci (19) and a bias in estimating the locations of the two genes may be observed if they map close together (35). In addition, there are fewer tests involving two closely linked loci. It therefore appears that a two-locus MLS has a different interpretation depending on whether two genes map close together or further apart. There are different approaches to establish genome-wide significance criteria for pairs of syntenic loci, which would be equivalent to non-syntenic thresholds and would take recombination into account. We have applied a simple adjustment in two-locus syntenic MLS while establishing the P-values on the basis of thresholds calculated from the entire surface. However, there may be more powerful statistical approaches to interpret the overall significance of the results.
We have found that our two-locus linkage method is sensitive to map mis-specification. This result is unsurprising because it has been previously shown that varying the genetic map affects multipoint linkage results in single-locus analysis (36). However, our peak coordinates were generally consistent across different genetic maps. An ideal genetic map would be based on accurate marker ordering information from genome sequencing studies and recombination fraction estimates for adjacent markers from as many meioses as possible. According to these criteria, the Rutgers map (22) is currently the best compromise because it is based on a recent release of the human genome sequence and incorporates information from both the DeCode (23) and Marshfield (24) genetic studies.
Complex traits likely involve interactions among more than two loci, so it is of considerable interest to extend the search to multilocus models. However, higher dimension scans are statistically and computationally prohibitive. It has been argued that a 2D search can capture a significant amount of the underlying trait complexity (12). In this respect, there are two aspects of statistical inference that we explored in the context of systematic 2D scans. We extended the locus-counting strategy (25) to two loci, and we estimated how often one expects to see the same region appears in the 10 highest peaks involving loci on different chromosomes. It appears that there are significantly more 2D peaks than expected under the null in the 2D surface, and region 5q13.1 is involved in more interactions than expected by chance alone. These approaches could highlight loci that may form part of networks of etiological variants and might identify frameworks of epistatic interactions involved in genetic pathways (37).
Tremendous effort over the past decade has generated databases of genotype data for human families affected by complex diseases. These data have been predominantly analysed using single-disease gene models and have found little consistent evidence for particular genes. 2D linkage approaches can add considerable value to such genome-scan data by identifying loci that interact epistatically. We have shown that it is computationally feasible to calculate 2D linkage grids for typical human genome-scan data and we were able to detect loci involved in hypertension that have no apparent effect in single-locus scans. These results therefore provide a compelling rationale for re-examining existing genome-wide linkage data sets using the 2D strategy to provide an even greater insight into the complex interaction of genetic factors involved in common human disease.
MATERIALS AND METHODS
Two-locus linkage analysis
We used a two-locus affected-relative-pair linkage test, which is based on expressing the relative recurrence risk as a function of the population prevalence (K) and the variance components at two disease loci (10,19). The relative recurrence risk is a function of the covariance between relatives. The covariance between affected full-siblings has previously been extended to two loci and can be expressed in terms of the additive variance components for loci 1 and 2 (VA1 and VA2); the dominance variances for loci 1 and 2 (VD1 and VD2); the four epistatic variances: the additive-by-additive variance (VA1A2), the additive-by-dominance variance (VA1D2), the dominance-by-additive variance (VD1A2), the dominance-by-dominance variance (VD1D2); and the recombination fraction (𝛉) between the two loci (19). For half-siblings, we derive an analogous expression for the two-locus covariance of two half-sibs. We substitute the corresponding covariance into the relative recurrence risk expression to obtain the risk ratio for sibs, λS, and for half-sibs, λHS.
Two-locus genetic models
We specify the most general two-locus model to maximize over all eight variance component parameters to fit the full range of epistasis models for affected sib-pairs. Specific nested genetic models can be fitted to the data by restricting the number of free variance component parameters in the model. For instance, for single-locus models, the additive and dominance effects attributed to locus 1 (VA1 and VD1) are maximized and all other variance component parameters are fixed at 0. Two specific two-locus models (additive and multiplicative) have been previously shown to be nested within the general variance components framework (39). The additive model includes locus-specific additive and dominance effects only (i.e. VA1, VD1, VA2 and VD2) and so ignores epistasis. We designate this model as a ‘main-effects-only’ model and it closely approximates the classic heterogeneity model. The multiplicative model contains a fixed degree of epistasis, so that if two unlinked loci contribute to the trait multiplicatively, the overall λS is the product of the two risk-ratio factors defined in terms of the penetrances for the two contributing loci, λS= λS1×λS2, where λS1 and λS2 are the risk ratios for siblings for locus 1 and locus 2, respectively. The multiplicative model can be expressed in terms of the variance components (40), so that the four epistatic variance components are expressed as a function of the corresponding single-locus variance components, for example, for the additive-by-additive variance component, VA1A2= (VA1×VA2)/K2. This formulation suggests a modification to model a wide range of levels of epistasis, by adding a single parameter, ε, to the expression as follows, VA1A2=(ε/K2)×(VA1×VA2), and similarly for the remaining epistatic variance components, VD1A2=(ε/K2)×(VD1×VA2), VA1D2=(ε/K2)×(VA1×VD2) and VD1D2=(ε/K2)×(VD1×VD2). We can fit different multilocus models by varying the value of ε. In the additive model, ε is 0, and under the multiplicative model, ε is fixed to 1. Greater degrees of epistasis are modelled with increasing values of ε, setting a range of plausible values from 0 to an upper bound of 103. In the present study, we first fit the general two-locus model over the entire 2D surface and then evaluate the fit of nested two-locus models (additive and multiplicative) at specific coordinates of interest.
BRIGHT study
Ascertainment criteria for the BRIGHT study (http://www.brightstudy.ac.uk/) have been previously detailed (4). The cohort consists of 1639 families with at least two extremely hypertensive siblings (each affected individual’s blood pressure is greater than the 95th percentile for the general population after adjustment for age and sex), resulting in 2076 affected full-sibling pairs and 66 affected half-siblings, after Relpair (41) analyses. Genotypes were obtained for 447 autosomal microsatellite markers, selected to include markers used in the original genome scan and 34 additional markers in regions of interest on chromosomes 2, 5, 6, 8, 9, 11, 13 and 15. Parental genotypes were unavailable for the majority of the families. The average marker spacing was 8 Kosambi cM and the largest inter-marker distance was observed for the most distal marker pair on chromosome 5q (28 cM). We used the Rutgers genetic map (22), which integrates physical and genetic mapping data, and a consensus marker order that agreed with three releases of UCSC (http://genome.ucsc.edu/), April 2003, July 2003 and May 2004. We calculated two-locus MLS for the peaks in the 2D surface under three different genetic maps, Rutgers (22), deCode (23) and Marshfield (24).
Significance thresholds in a 2D genome-scan
To obtain the significance thresholds for the entire 2D surface, we simulated genotypes using Merlin for 414 markers in 100 ASPs selected from the BRIGHT data set under the null hypothesis of no linkage. The missing data patterns and distribution of sibship sizes for the family set (sibling pairs, trios and quartets) were representative of the entire BRIGHT sample. We analysed 1000 replicates of the 2D surface under the general two-locus genetic model to obtain the 5% and 1% 2D genome-wide significance thresholds. The MLS threshold for a 5% type 1 error over the entire 2D surface was estimated to be 5.84 under the general two-locus model. The majority of the surface (95%) includes loci that fall on separate chromosomes. Along the diagonal, the MLS thresholds depend on the exact value of the recombination fraction, 𝛉, because the distribution of the test statistic is a function of the recombination fraction. To investigate the relationship between 𝛉 and the MLS thresholds, we simulated 1 000 000 replicates of 100 completely informative ASPs in the absence of linkage. In order to determine the genome-wide significance for syntenic regions, we introduced an adjustment factor to increment each syntenic MLS while determining the genome-wide P-values based on simulations performed in the entire 2D surface. We used the 2D genome simulations by taking one coordinate per chromosome to determine the value of the scaling factor at each value of 𝛉, calculating lod (𝛉=0.5)−lod (𝛉<0.5). For example, a syntenic MLS of 4 obtained at 𝛉=0.3 would be adjusted by adding 0.15 units to it (calculated from Fig. 1B), and the estimated genome-wide significance is calculated as that for a non-syntenic MLS of 4.15 in 2D genome-wide simulations, resulting in P=0.43.
For each coordinate that surpassed genome-wide suggestive evidence for linkage (two-locus non-syntenic MLS=4.3), we examined the fit of nested two-locus genetic models. To examine genetic models in more detail, we simulated 100 000 replicates of 100 completely informative ASPs under a nested model of interest to evaluate the fit of different nested models compared with the general two-locus model at a specific coordinate. To assess the significance for the fit of the additive model compared with the general epistatic model, we generated replicates under an additive model by sampling from the observed two-locus IBD distribution calculated under the additive model (at the peak MLS) during the linkage analysis of the BRIGHT data. We used the same approach to assess the deviation from multiplicative and single-locus null genetic models.
The locus-counting method was extended to two loci by defining independent-linked coordinates as pairs of regions showing evidence for two-locus linkage and separated by at least 40 Kosambi cM at both marker locations. We used the BRIGHT 2D genome simulations (1000 replicates) to obtain the null distribution of independent 2D peaks under the general epistasis model and calculated the 0.05 and 0.01 significance thresholds for 1–10 independent peak coordinates in a 2D genome-scan.
ACKNOWLEDGEMENTS
We acknowledge the families who participated in the BRIGHT study. The BRIGHT study was supported by the UK Medical Research Council, the British Heart Foundation, the Wellcome Trust, the British Hypertension Society and the Barts and the London Charitable Foundation. We thank the reviewers for their helpful comments and suggestions. J.T.B. was funded by scholarships from the Natural Sciences and Engineering Research Council of Canada, the Fonds quebecois de la recherche sur la nature et les technologies and the Clarendon Fund. C.W. was funded by grant number RAB03/PJ/01 from the Barts and the London Charitable Foundation Research Advisory Board. S.W. is a Wellcome Trust Career Development Fellow. Funding to pay the Open Access Publication charges for this article was provided by The Medical Research Council.
Conflict of Interest statement. None declared.
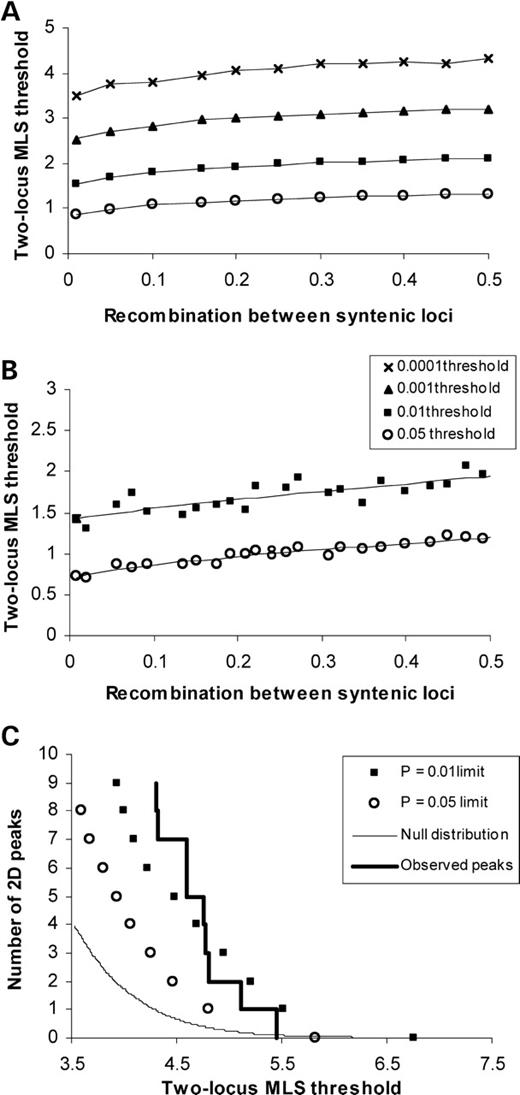
Figure 1. Two-locus MLS thresholds as a function of the recombination fraction, 𝛉, in (A) 100 fully informative ASP with 1 000 000 replicates and (B) in the BRIGHT 2D simulations with 1000 replicates taking one pair of loci from each chromosome. These thresholds are uncorrected for multiple testing. The simulations were performed in the absence of linkage and MLSs were calculated under the general two-locus model. Least-squares fits using a power function show the smoothed empirical distribution of thresholds. (C) 2D locus-counting results for non-syntenic loci. The two lines represent the null distribution of expected number of independent peaks from the 2D simulations and the observed distribution of non-syntenic 2D peaks in the BRIGHT data, along with significance limits for 0.05 and 0.01 2D genome-wide type 1 error rates.
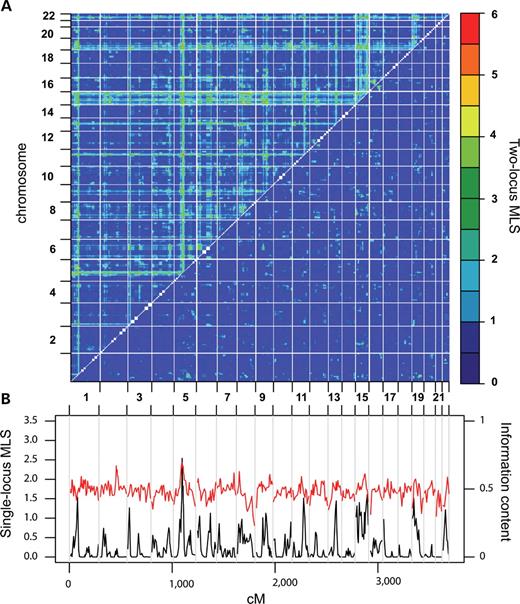
Figure 2. Genome scans of essential hypertension. (A) 2D genome-wide linkage scan estimating the MLS under two-locus genetic models. Calculations were performed at every coordinate in the 2D genome sparse marker grid at an average coordinate density of 8 cM. Two-locus MLSs calculated under the general two-locus model are presented above the diagonal. The highest peak over the 2D sparse grid for the general model was obtained on chromosome 5q13.1 and 11q22.1. The difference in the MLS for the fit between the general and additive two-locus models is presented below the diagonal. (B) Single-locus genome-scan of essential hypertension. The single-locus MLS (black line) and the genome-wide information content (red line) for the BRIGHT data. The highest peak in the 1D scan is on chromosome 5q13.1 (MLS=2.54), but no region surpasses the genome-wide significance threshold.
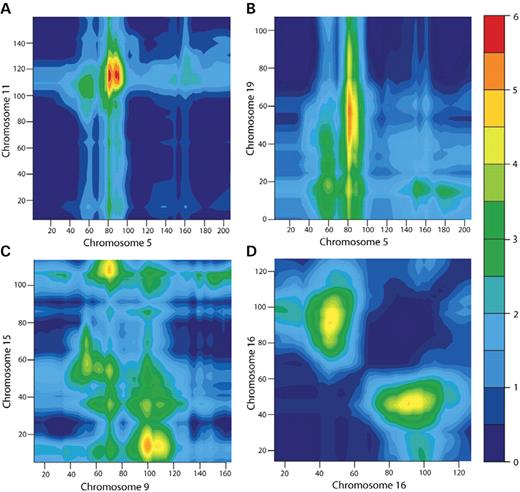
Figure 3. Fine-grid 2D genome-scan analysis of the four most significant syntenic and non-syntenic peaks. The two-locus MLS is calculated under the general two-locus model. (A) Coordinate density is at an average of 1.51 cM on chromosome 5 and 2.1 cM on chromosome 11. The sparse-grid peak of 5.45 increases to 5.72 under the fine-grid, with a coordinate shift from (chr 5: 80.56; chr 11: 109.32) to (chr 5: 90.65; chr 11: 117.86). (B) Chromosome 5 and chromosome 19: coordinate density on chromosome 19 is at an average of 2.06 cM. The sparse-grid peak of 5.12 increases to 5.35 under the fine-grid, with a distal coordinate shift on chromosome 19 of 2.34 cM. (C) Coordinate density is at an average of 1.54 cM on chromosome 9 and 1.7 cM on chromosome 15. The sparse-grid peak two-locus MLS remains unchanged in value and location. (D) Chromosome 16: coordinate density is at an average of 2.3 cM. The sparse-grid peak of 4.37 increases to 4.50 under the fine-grid, with a proximal coordinate shift of 5.5 cM on 16q23.1.
Most significant findings in the genome-wide 2D scan
| Locus 1a | 𝛉 | Locus 2a | Two-locus MLS | ||||
|---|---|---|---|---|---|---|---|
| Generalb | ε=1c | ε=0d | εe (1-LU SI) | P-value (95% CI)f | |||
| Pairs of loci on different chromosomes | |||||||
| 5q13.1 D5S2019, 2.5 | 0.5 | 11q22.1 D11S898, 1.5 | 5.45 | 4.05 | 3.84 | 100 (4–103) | 0.08 (0.06–0.10) |
| 5q13.1 D5S2019, 2.5 | 0.5 | 19q12 D19S414, 0.5 | 5.12 | 2.98 | 2.85 | 103 (21–103) | 0.15 (0.12–0.17) |
| 9q22.3 D9S287, 1.1 | 0.5 | 15q12 D15S1002, 1.3 | 4.80 | 2.44 | 2.28 | 103 (41–103) | 0.28 (0.26–0.31) |
| Pairs of syntenic loci | |||||||
| 16p12.3 D16S3046, 0.5 | 0.33 | 16q23.1 D16S515, 0.1 | 4.37 | 0.63 | 0.53 | 103 (170–103) | 0.34 (0.31–0.37) |
aFor each region, we present the chromosome location, peak marker under the sparse grid and single-locus MLS. Models are differentiated by an epistasis parameter ε, with ε=0, 1 and >1 corresponding to additive, multiplicative and epistatic models.
bTwo-locus MLSs were computed under the general two-locus model.
cTwo-locus MLSs were computed under the multiplicative model.
dTwo-locus MLSs were computed under the additive two-locus models for the sparse grid. For syntenic regions we present the non-adjusted two-locus MLS.
eThe maximum-likelihood estimate of ε and the corresponding 1-LU support interval (SI). All peaks show a significant difference between the general and the additive and the general and the multiplicative models (P<0.01).
fThe estimated genome-wide P-value corresponds to the two-locus general model MLS under the sparse grid and is given along with the 95% confidence interval (95% CI) of the estimate.
Suggestive and significant peak coordinates in the 2D linkage scan
| Locus 1a | Locus 2a | Two-locus MLS | |||||
|---|---|---|---|---|---|---|---|
| Generalb (Rutgers) | Generalc (Marshfield) | Generald (deCode) | Expected 2D peakse | P-value | 1-LU support intervals (cM)f | ||
| Pairs of loci on different chromosomes | |||||||
| 5q13.1 D5S2019, 2.5 | 11q22.1 D11S898, 1.5 | 5.45 | 4.81 | 5.15 | 0.06 | 0.08 | (79.1–92.8) (106.8–126.3) |
| 5q13.1 D5S2019, 2.5 | 19q12 D19S414, 0.5 | 5.12 | 4.67 | 5.13 | 0.12 | 0.15 | (78.6–90) (32.9–67.7) |
| 9q22.3 D9S287, 1.1 | 15q12 D15S1002, 1.3 | 4.80 | 4.23 | 5.06 | 0.37 | 0.28 | (93.7–116.4) (5–23.5) |
| 5q13.1 D5S2019, 2.5 | 9q22.3 D9S287, 1.1 | 4.77 | 4.32 | 4.74 | 0.39 | 0.28 | (73.5–85.1) (91.8–111.6) |
| 8p12 D8S505, 0.4 | 15q11.2 D15S128, 1.0 | 4.76 | 4.55 | 4.88 | 0.40 | 0.28 | (50.9–74.1) (0–13.6) |
| 1p33 D1S2797, 1.5 | 5q13.1 D5S2019, 2.5 | 4.60 | 4.06 | 4.56 | 0.55 | 0.36 | (69.4–88.1) (76.5–90.5) |
| 5q13.1 D5S2019, 2.5 | 14q32.3 D14S292, 0.1 | 4.60 | 4.61 | 4.60 | 0.55 | 0.36 | (78.6–90.7) (104.2–q-ter) |
| 3p26.1 D3S1304, 1.3 | 19p13.3 D19S894, 1.5 | 4.33 | 5.31 | 2.36 | 0.93 | 0.54 | (4.5–30.5) (0–24.4) |
| 3p12.3 D3S3681, 0.6 | 5q13.1 D5S2019, 2.5 | 4.31 | 4.48 | 4.29 | 0.98 | 0.55 | (95.2–123.2) (76.5–85.1) |
| 1p36.1 D1S234, 0.4 | 19q13.3 D19S420, 0.4 | 4.31 | 4.24 | 4.23 | 0.98 | 0.55 | (48–79.9) (62.6–74.8) |
| Pairs of syntenic loci | |||||||
| 16p12.3 D16S3046, 0.5 | 16q23.1 D16S515, 0.1 | 4.37 | 6.01 | 4.26 | 0.67 | 0.34 | (39.7–55.2) (76.4–106) |
| 9p24.2 D9S288, 0.1 | 9q31.1 D9S1690, 1.1 | 4.01 | 3.64 | 4.07 | 1.56 | 0.69 | (p-ter–16.2) (95.6–114.1) |
| 5p14.1 D5S419, 0.2 | 5q13.3 D5S424, 1.8 | 3.75 | 3.04 | 4.10 | 2.01 | 0.78 | (33.4–58) (85.2–93.8) |
aFor each region, we present the chromosome location, peak marker under the sparse grid and single-locus MLS.
bTwo-locus MLSs were computed under the general two-locus model using the Rutgers map.
cTwo-locus MLSs were computed under the general two-locus model using the Marshfield map.
dTwo-locus MLSs were computed under the general two-locus model using the deCode genetic map. All region pairs apart from 1p33 and 5q13.1 show a significant difference (P<0.01) between the fit of nested additive and multiplicative models when compared with the general model under the Rutgers map.
eThe expected number of peaks genome-wide reaching the same or higher lod as the observed two-locus MLS value obtained under Rutgers. For syntenic regions, we use the adjustment from Figure 1B to scale the syntenic MLS to be comparable with the non-syntenic results.
f1-LU support intervals in Kosambi cM (Rutgers map) are given for locus 1 and locus 2 in each pair using the fine-grid two-locus MLS.
References
Ward, R. (
Harrap, S.B., Wong, Z.Y., Stebbing, M., Lamantia, A. and Bahlo, M. (
Rice, T., Rankinen, T., Chagnon, Y.C., Province, M.A., Perusse, L., Leon, A.S., Skinner, J.S., Wilmore, J.H., Bouchard, C. and Rao, D.C. (
Caulfield, M., Munroe, P., Pembroke, J., Samani, N., Dominiczak, A., Brown, M., Benjamin, N., Webster, J., Ratcliffe, P., O'Shea, S. et al. (
Yang, X., Wang, K., Huang, J. and Vieland, V.J. (
Templeton, A.R. (
Carlborg, O. and Haley, C.S. (
Williams, S.M., Ritchie, M.D., Phillips, J.A., III, Dawson, E., Prince, M., Dzhura, E., Willis, A., Semenya, A., Summar, M., White, B.C. et al. (
Cordell, H.J., Todd, J.A., Bennett, S.T., Kawaguchi, Y. and Farrall, M. (
Cox, N.J., Frigge, M., Nicolae, D.L., Concannon, P., Hanis, C.L., Bell, G.I. and Kong, A. (
Sen, S. and Churchill, G.A. (
Carlborg, O., Kerje, S., Schutz, K., Jacobsson, L., Jensen, P. and Andersson, L. (
Shimomura, K., Low-Zeddies, S.S., King, D.P., Steeves, T.D., Whiteley, A., Kushla, J., Zemenides, P.D., Lin, A., Vitaterna, M.H., Churchill, G.A. et al. (
Sugiyama, F., Churchill, G.A., Higgins, D.C., Johns, C., Makaritsis, K.P., Gavras, H. and Paigen, B. (
Lander, E.S. and Botstein, D. (
Dupuis, J., Brown, P.O. and Siegmund, D. (
Staessen, J.A., Wang, J.G., Brand, E., Barlassina, C., Birkenhager, W.H., Herrmann, S.M., Fagard, R., Tizzoni, L. and Bianchi, G. (
Farrall, M. (
Lander, E. and Kruglyak, L. (
Kong, X., Murphy, K., Raj, T., He, C., White, P.S. and Matise, T.C. (
Kong, A., Gudbjartsson, D.F., Sainz, J., Jonsdottir, G.M., Gudjonsson, S.A., Richardsson, B., Sigurdardottir, S., Barnard, J., Hallbeck, B., Masson, G. et al. (
Broman, K.W., Murray, J.C., Sheffield, V.C., White, R.L. and Weber, J.L. (
Wiltshire, S., Cardon, L.R. and McCarthy, M.I. (
Xu, X., Rogus, J.J., Terwedow, H.A., Yang, J., Wang, Z., Chen, C., Niu, T., Wang, B., Xu, H., Weiss, S. et al. (
Cooper, R.S., Luke, A., Zhu, X., Kan, D., Adeyemo, A., Rotimi, C., Bouzekri, N. and Ward, R. (
Ogata, H., Goto, S., Sato, K., Fujibuchi, W., Bono, H. and Kanehisa, M. (
Cordell, H.J. (
Moore, J.H. and Williams, S.M. (
Holmans, P. (
Fijneman, R.J., de Vries, S.S., Jansen, R.C. and Demant, P. (
Marchini, J., Donnelly, P. and Cardon, L.R. (
Culverhouse, R., Suarez, B.K., Lin, J. and Reich, T. (
Biernacka, J.M., Sun, L. and Bull, S.B. (
Daw, E.W., Thompson, E.A. and Wijsman, E.M. (
Segre, D., Deluna, A., Church, G.M. and Kishony, R. (
Abecasis, G.R., Cherny, S.S., Cookson, W.O. and Cardon, L.R. (
Risch, N. (
Cordell, H.J. (
