


Abstract
Huntington disease is caused by the expansion of a CAG repeat encoding an extended glutamine tract in a protein called huntingtin. Here, we provide evidence supporting the hypothesis that somatic increases of mutation length play a role in the progressive nature and cell-selective aspects of HD pathogenesis. Results from micro-dissected tissue and individual laser-dissected cells obtained from human HD cases and knock-in HD mice indicate that the CAG repeat is unstable in all cell types tested although neurons tend to have longer mutation length gains than glia. Mutation length gains occur early in the disease process and continue to accumulate as the disease progresses. In keeping with observed patterns of cell loss, neuronal mutation length gains tend to be more prominent in the striatum than in the cortex of low-grade human HD cases, less so in more advanced cases. Interestingly, neuronal sub-populations of HD mice appear to have different propensities for mutation length gains; in particular, smaller mutation length gains occur in nitric oxide synthase-positive striatal interneurons (a relatively spared cell type in HD) compared with the pan-striatal neuronal population. More generally, the data demonstrate that neuronal changes in HD repeat length can be at least as great, if not greater, than those observed in the germline. The fact that significant CAG repeat length gains occur in non-replicating cells also argues that processes such as inappropriate mismatch repair rather than DNA replication are involved in generating mutation instability in HD brain tissue.
INTRODUCTION
Huntington disease (HD) is an inherited neurological disorder characterized by progressive movement, psychiatric and cognitive disturbances. Neurodegenerative changes in the brain of affected individuals follow a typical pattern, with early cellular dysfunction and loss of medium spiny neurons in the striatum, followed by more generalized cell loss across many brain regions later in the disease course (1). The causal mutation is the expansion of a CAG trinucleotide repeat tract in exon 1 of a large gene on chromosome 4 that results in the extension of a polyglutamine tract at the N-terminus of the encoded, ubiquitously expressed protein called huntingtin (2). Germline instability of the mutant CAG repeat tract leads to inter- and intra-generational variability in mutation length. This phenomenon has clinical consequences because the inherited mutation length is inversely correlated with the age-at-onset of symptoms; longer mutations result in accelerated pathology (2). A number of studies have demonstrated that the HD mutation is also unstable in somatic tissues, most notably in the brain (3–6). Sensitive small pool PCR (SP–PCR) analyses of HD mouse brain tissue (7) revealed that dramatic age-dependent, expansion-biased changes in mutation length occur in the striatum, and to a lesser extent in the cortex. More recently, studies carried out on human HD autopsy material that was assigned Grade 0 status (no sign of widespread pathological cell loss in the striatum), indicated a significant proportion (∼10%) of striatal cells with mutation lengths >200 CAG repeats (8). In some (∼0.1%) cells, the mutation lengths exceeded 1000 CAG repeats, about 25 times the size of the mutant CAG repeat tract inherited from the affected parent. The resulting increase in cellular polyglutamine load/length effects may predispose striatal cells with the largest mutations to accelerated downstream pathology. This speculation is supported by the observation that very large somatic length gains (of up to 500 CAG repeats) are present in the cortex, but not in the striatum of end-stage patients, suggesting that striatal cells with the largest HD mutation expansions may be preferentially lost during the disease process. This correlation between mutation length profiles in different regions of the brain and the topography and temporal order of neuropathological involvement is consistent with the notion that mutation length variability in somatic tissues may contribute to both the progressive nature and cell-selective aspects of human HD pathogenesis.
In previous studies, we used SP–PCR to visualize HD mutation length profiles in different brain tissues (7,8). This technique allows the detection of products from single amplifiable molecules, achieved by serial dilution of DNA prepared from bulk tissue homogenates. Although the approach provides quantitative measures of mutation size and mutational load within particular tissues, it cannot distinguish between the relative contributions of different cell types to the overall mutation length profile. The aim of this study was to determine the size of the HD mutation in defined neuronal cell types at different stages of disease progression as this information has implications for understanding both the mechanistic basis of the instability process and its role in HD pathology.
RESULTS
Mutation length profiles in late-stage human HD brain tissue
To investigate the relationship between somatic mutation length and cell-type specific neuropathological involvement, we first studied tissues from two affected identical twins, T-213 and T-216 (Table 1 and Materials and Methods). Blood analysis indicated that the number of CAG repeats in the disease allele was ∼49–50 in both cases. Neuropathological examination of the two cases revealed them both to be late-stage, Vonsattel Grade 3 and Grade 4. Brain tissues were dissected from three areas: temporal pole (TP), hippocampal formation (HF) and caudate nucleus, accumbens, putamen (CAP) region. A comparison of the mutation profiles in neuron-rich (grey matter) and glial-rich (white matter) samples of each region is given in Figure 1. All mutation length data are available in the Supplementary Materials.
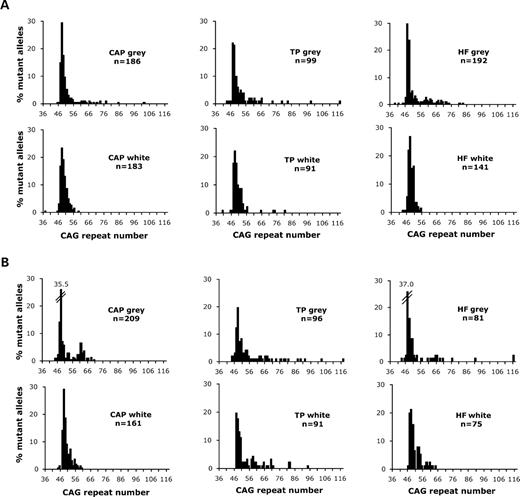
Mutation length profiles of cells from advanced grade human HD brain. The histograms show the distribution of mutation lengths obtained from the caudate nucleus, accumbens, putamen region (CAP), temporal pole of the cortex (TP) and hippocampal formation (HF) of two HD cases, T-213 (A) and T-216 (B). Only data from CAG repeat alleles with ⩾36 repeats are plotted. For each tissue the data from grey matter (neuron-rich) are shown above data from white matter (glia-rich) and the number of mutant alleles (n) examined is indicated. The mutant HD allele in blood samples from both T-213 and T-216 carries 49–50 CAG repeats.
Summary details of human tissue used in the study
| Sample | Age of onset (years) | Age of death (years) | Disease allele CAG repeat lengtha | Vonsattel HD Grade | Sex |
|---|---|---|---|---|---|
| B2055 | NK | 40 | 42 | 0 | M |
| B2505 | NK | 64 | 45 | 1 | M |
| T-213 | 27 | 52 | 49–50 | 4/4 | F |
| T-216 | 27 | 50 | 49–50 | 3/4 | F |
| No. 1682 | 26 | 48 | 50 | NK | M |
aAssessed from blood.
NK, not known; M, male; F, female.
All of the samples showed variation in the repeat length of the disease allele. Particularly striking was the fact that larger mutation length gains tended to occur in the samples enriched for grey matter. A standard comparison of median mutation lengths between the white and grey matter of each region sampled using the Mann–Whitney statistic [as used in previous studies of mutation length profiles (7–9)] did not reveal any significant differences, perhaps because the grey matter samples contained some non-neuronal cell types. However, if another indicator of CAG repeat instability was used, e.g. the proportion of cells that have substantial length gains (⩾20% inherited mutation length; 10 repeats in this case), a comparison of CAP white and grey tissue homogenates from T-213 (Fig. 1A) indicated that disease alleles with ⩾60 repeats were significantly more prevalent in grey matter tissue enriched in neuronal cell bodies (P < 0.001, χ2=19.7, df = 1) than in glia-enriched white matter. Similar significant results were observed when white and grey matter tissues from the HF or the TP were compared (P < 0.001, χ2=25.3, df = 1; P < 0.035, χ2=4.4, df = 1, respectively), demonstrating that the largest repeats were observed in neuron-rich samples of all three brain regions investigated.
In the case of T-216 (Fig. 1B), a similar pattern was observed. The CAP tissue comparison was the most significant (P < 0.001, χ2=32.3, df = 1), whereas the HF comparison was on the borderline of significance (P = 0.046, χ2=3.9, df = 1), and the TP grey and white matter comparison showed no significant difference (P = 0.28, χ2=1.2, df = 1).
Comparison of the mutation profiles in the corresponding tissues of the twins revealed no significant differences except for the HF white matter (P < 0.01, χ2=9.62, df = 1) and TP white matter (P < 0.01, χ2=8.09, df = 1). These differences cannot be accounted for by the differences in disease course length, which are similar in both individuals (Table 1). Therefore, as they are monozygotic twins, it is likely that the inter-individual tissue differences arise either for technical reasons, such as random sampling artefacts, or environmental influences.
In summary, our data from these monozygotic twins demonstrate that neuron-rich tissues were more likely to have substantial mutation length gains (⩾10 repeats) than glia-enriched tissues. The basis for any differences between the twins in their mutation profiles must be due to factors other than DNA sequence variation.
Mutation length profiles in individual laser-dissected cells from early grade human HD brain tissue
As our results indicated that greater mutation length gains were observed in neuron-enriched tissue from advanced grade HD brain samples, we decided to examine the mutation length profile of individual cell types by employing the more direct approach of laser capture microdissection (LCM). Previous studies of HD brain tissue homogenates suggested that region-specific mutation length profiles vary significantly at different stages of the disease process (8). This pattern is most likely the consequence of two processes: a tendency for CAG repeat mutation size to increase over time and an alteration in the residual cell profiles of a tissue as vulnerable neurons die and other cells, such as glia, proliferate. We therefore decided to focus the LCM-based study on investigating mutation length profiles during early stages of the disease process. Grade 0 and Grade 1 striatal tissues were compared in order to test whether mutation length gains were more prominent in vulnerable (neurons) or spared (glia) cell types. All mutation length data are available in the Supplementary Material. Although both cell types displayed mutation length variability (Fig. 2A), the median mutation length of the neuronal cells was greater than that of the glial cells in both samples (P < 0.0001 for Grade 0, P < 0.0004 for Grade 1, Mann–Whitney U test). The largest mutation length detected in the Grade 0 sample of neurons and glia was 110 CAG repeats and 47 CAG repeats, respectively, whereas the largest mutation length detected in Grade 1 sample of neurons and glia was 304 and 82 CAG repeats, respectively.
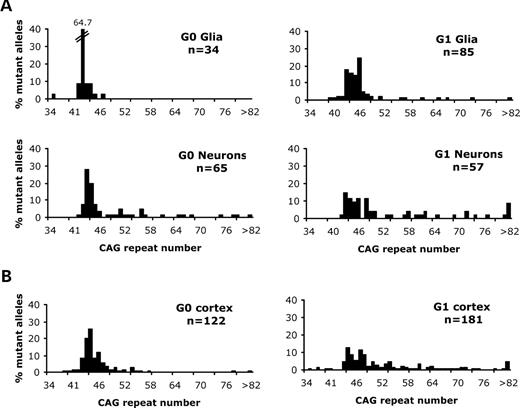
Mutation length profiles of laser-dissected cells from sections of human HD brain. The histograms show the distribution of mutation lengths within samples of neurons and glia obtained from Grade 0 (G0) and Grade 1 (G1) striatum (A) and cortex (B). In each case, the number of mutant alleles (n) examined is indicated. The mutant HD allele in blood from the Grade 0 and Grade 1 cases carry 42 and 45 CAG repeats, respectively. (A) The median mutation length of G0 neurons (median = 44 CAG repeats) is significantly greater (P < 0.0001, Mann–Whitney U test) than that of G0 glia (median = 42 CAG repeats). The median mutation length of G1 neurons (median = 48 CAG repeats) is significantly greater (P < 0.0004, Mann–Whitney U test) than G1 glia (median = 45 CAG repeats). The >82 CAG repeat category on the histograms comprises a mutant allele of 110 CAG repeats (Grade 0 neurons) and alleles of 87, 89, 109 and 304 CAG repeats (Grade 1 neurons). (B) The distribution of mutation lengths detected in Grade 0 cortical neurons (median = 44 CAG repeats) and Grade 1 cortical neurons (median = 48 CAG repeats). The >82 CAG repeat category on the histograms comprise a mutant allele of 206 CAG repeats in the Grade 0 cortical neuron sample and alleles of 86, 87, 119, 122, 137, 148 and 167 CAG repeats in the Grade 1 neuron sample. One allele of 33 CAG repeats detected in the Grade 1 cortical neuron sample is not included in the histogram.
Although we did not perform the corresponding investigations of cortical samples from the Grade 0 and Grade 1 cases studied here, LCM-based data from temporal cortex tissue of a further ungraded brain sample (case no. 1682) showed the same pattern (Fig. 3). The median mutation length of the neuronal cells (n = 129) was significantly greater (P < 0.0001) than that of the glial cells (n = 240) with a maximum length of 185 and 67 repeats detected in the neuronal and glial populations, respectively. We then went on to investigate whether the distribution of striatal mutation length gains increases as the disease pathology progresses by comparing neuronal mutation length profiles in the HD Grade 0 and Grade 1 LCM samples. Although the inherited mutation lengths of the HD cases were similar, they were not identical (42 CAG repeats in Grade 0 case, 45 repeats in Grade 1 case). As inherited mutation length is known to influence the resulting mutation length profiles (8), particularly the median mutation length detected, the Grade 0 and Grade 1 mutation length distributions could not be directly compared using the Mann–Whitney statistic. If the previously described additional indicator of instability was used, i.e. the proportion of striatal neurons that have substantial length gains (gains ⩾20% inherited mutation length), then mutation length instability in Grade 0 neurons was slightly less than in Grade 1 neurons (Grade 0: 29%; Grade 1: 35%) although this did not achieve statistical significance (P > 0.05, χ2=0.48, df = 1). However, it is notable that the largest striatal mutation length in the Grade 1 neuronal sample (304 repeats) was much greater than that found in the Grade 0 neuronal sample (110 repeats). In common with the Grade 3/4 HD twin data, the Grade 0/1 data indicated that mutation length gains were more prominent in affected striatal neurons than in spared striatal glia and appeared to increase with advancing pathology during early stages of the disease course. We then went on to compare mutation length variability in striatal neurons (a brain region that shows earliest pathological involvement) with cortical neurons (a region that generally shows later involvement). In both Grade 0 and Grade 1 tissue, the median mutation length in the striatum did not significantly differ from that in the cortex (P > 0.05, Mann–Whitney U test). However, when longer repeat alleles in Grade 0 striatal and cortical neurons were compared, the proportion of cortical neurons that had CAG repeat gains ⩾20% inherited mutation length, i.e. ⩾50 repeats, was significantly less than striatal neurons (striatum: 29%; cortex: 11.5%; P < 0.01; χ2=9.2; df = 1). In contrast, the proportion of the Grade 1 striatal and cortical neurons containing longer repeats was similar (⩾54 repeats, striatum: 35%, cortex: 30%, P > 0.05, χ2=0.44, df = 1). Cortical mutation length instability appeared to correlate with advancing pathology as gains ⩾20% inherited mutation length were significantly greater (P < 0.001, χ2=14.8, df = 1) in Grade 1 cortical tissue (30%) than Grade 0 cortical tissue (11.5%).
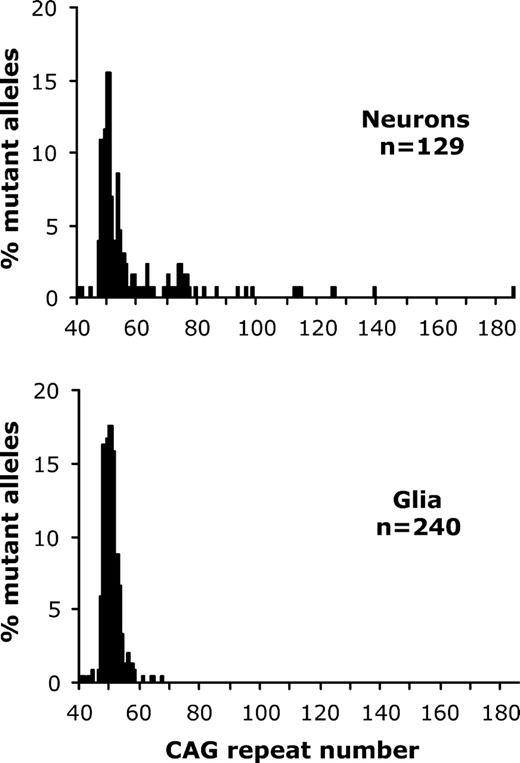
A comparison of mutation lengths present in neurons and glia from the same human HD brain. The histograms show the distribution of mutation lengths within samples of laser-dissected neurons and glia obtained from temporal cortex of an unstaged HD brain (no. 1682). The mutant HD allele in blood from this case carries 50 CAG repeats. The number of mutant alleles (n) examined is indicated on each histogram. The median mutation length of the neurons (median = 51 CAG repeats) is significantly greater (P < 0.0001, Mann–Whitney U test) than that of glia (median = 50 CAG repeats).
Mutation length profiles differ in striatal inter-neurons and projection neurons within HD mouse striatum
In order to further evaluate the cell-type specificity of mutation length variability within the striatum, neurochemically distinct striatal cell populations were identified using rapid immunostaining protocols for nNOS and NeuN developed in the laboratory (10). nNOS-immunostaining was used to identify nNOS interneurons, considered relatively resistant to HD pathology, and NeuN-immunostaining was used to identify all neuronal cell types. The medium-spiny projection neurons, which are highly vulnerable to the deleterious effects of the HD mutation, constitute approximately 90% of all striatal neurons, and so this population of NeuN neurons can be regarded as being highly enriched for medium spiny projection neurons (MSNs). Because of the high levels of auto-fluorescent endogenous lipofuscin in human striatum, these studies were carried out in 24–27-month-old knock-in HD mice (11). Three populations of striatal cells were investigated: aspiny nitric oxide synthase (NOS)/somatostatin interneurons, visualized using an anti-NOS antibody, glia visualized by direct staining with ethidium bromide followed by morphological identification and MSNs, visualized using an anti-NeuN antibody that is commonly used to distinguish neurons from other cell types such as glia. After laser dissection, DNA was harvested from the isolated cells and subjected to PCR amplification to determine the size of the HD mutation (see Fig. 4 for representative data). All mutation length data are available in the Supplementary Material. Statistical comparison of the mutation profiles for each of the three cell types indicated that the median mutation length in glia was significantly smaller than that in the MSNs (P < 0.005, Mann–Whitney U test) and NOS+ interneurons (P < 0.04, Mann–Whitney U test), but there was no significant difference in the median mutation lengths of the NOS+ interneurons and NeuN+ MSNs. Similar trends were observed in mutation data from three further 24-month-old HD mice investigated. Although glia had smaller mutation length gains than neurons, the cell-type specific neuronal data do not appear to support the prediction that neurons more vulnerable to HD pathology (i.e. the majority of cells within the NeuN+ population) will have larger mutation length gains than spared cells (e.g. NOS+ interneurons). However, previous SP–PCR studies of these HD mice indicated that mutation length variability is an age-dependent process (7,8), and as the mice used for this part of the study were 24–27 months of age, we wondered whether the resulting NeuN+ and NOS+ data were being influenced by the consequences of extreme age, rather than truly reflecting the relative susceptibility of different neuronal sub-types to mutation length changes. For this reason, further mutation length profiles were determined for striatal NeuN+ MSNs and NOS+ interneurons in younger HD mice at 6 months of age. The resulting data for two young HD mice are shown in Figure 5 (and in the Supplementary Material) and findings in a third showed the same trends (data not shown). In all three animals, striatal NOS+ interneurons had significantly shorter mutation length gains than NeuN+ MSNs. Therefore, these data provide compelling support for the hypothesis that a predisposition to mutation length gains correlates with a vulnerability to HD pathology.
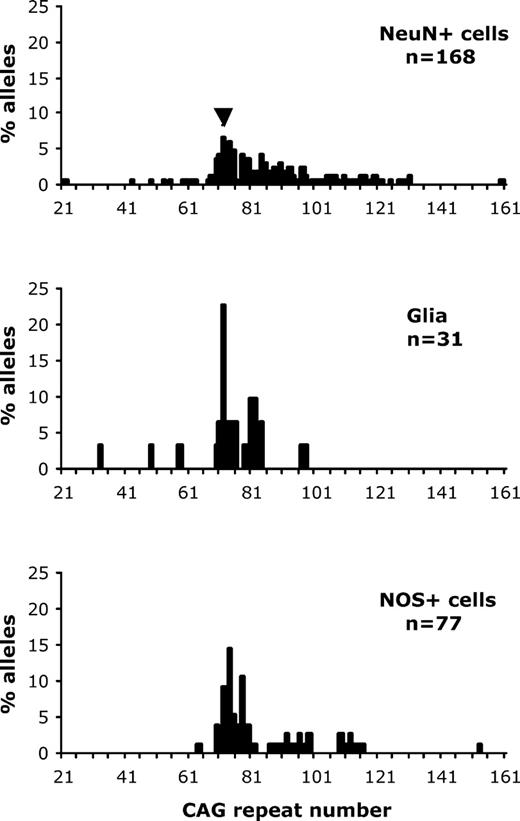
CAG repeat length profiles of different populations of laser-dissected cells from sections of old HD mouse striatum. All data presented in this figure were obtained from non-WT alleles of the same 27-month-old HD mouse with an inherited mutation length of 72 CAG repeats (indicated by an arrowhead). The top, middle and bottom panels indicate the CAG repeat length profile of striatal NeuN+ neurons (median = 80.5 CAG repeats), striatal glia (median = 75 CAG repeats) and striatal NOS+ cells (median = 78 CAG repeats), respectively. In each case the number of mutant alleles (n) examined is indicated. The median mutation length of the glia is significantly smaller than that of the NeuN+ cells (P < 0.005, Mann–Whitney U test) and NOS+ cells (P < 0.04, Mann–Whitney U test) but there is no significant difference in the median mutation lengths of the NOS+ and NeuN+ cells.
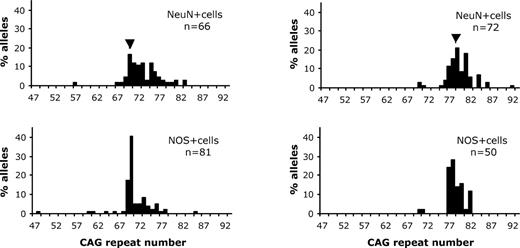
Mutation length profiles in different populations of laser-dissected cells from sections of 6-month-old HD mouse striatum. (A) Mutation lengths of NeuN+ (upper panel) and NOS+ (lower panel) cells from a 6-month-old HD mouse with an inherited mutation length of 70 CAG repeats. Statistical comparison of mutation profiles of NeuN+ and NOS+ indicates that the median mutation length in NeuN+ cells (73 CAG repeats) is significantly larger (P < 0.0001, Mann–Whitney U test) than the median mutation length in the NOS+ cells (70 CAG repeats). (B) Mutation lengths of NeuN+ (upper panel) and NOS+ (lower panel) cells from a 6-month-old HD mouse with an inherited mutation length of 78 CAG repeats. Statistical comparison of mutation profiles derived from NeuN+ and NOS+ indicates that the median mutation length in NeuN+ cells (80 CAG repeats) is significantly larger (P < 0.0001, Mann–Whitney U test) than the median mutation length in the NOS+ cells (78 CAG repeats). In (A) and (B) the number of mutant alleles (n) examined is indicated.
DISCUSSION
Although considerable progress in understanding HD pathogenesis has been made over the recent years, one particular feature of the disease remains a puzzle. Given that mutant huntingtin protein is present at similar levels in many central nervous system (CNS) and non-CNS tissues (2,12), it is unclear why striatal MSNs neurons are selectively vulnerable to the disease process. In this study we present current efforts to test our hypothesis proposing that tissue- and cell-type-specific differences in mutation length profiles play a role in the vulnerability of cells to HD pathogenesis.
The results obtained in this study confirm and extend previously published SP–PCR data showing significant levels of mutation length variability within different regions of the mouse and human HD brain (7,8). Furthermore, they demonstrate directly that the HD-associated CAG repeat stretch in neurons is capable of length changes that are at least as great, if not greater, than those observed in the germline. Although mutation lengths of approximately 300 CAG repeats were detected in this study, the rare, extremely large alleles (>500 CAG repeats) observed in previous SP–PCR-based investigations of human HD brain material (8) were not seen. This is most likely due to the fewer number of individual cells sampled by LCM compared with the dilutions of bulk tissue DNA typically used in SP–PCR.
In both human and mouse HD brain, neuronal mutation length mosaicism is present before significant levels of cell loss (8). Previous molecular and behavioral studies of the knock-in HD mice used in the study (8,11,13–15) have suggested that they are accurately modeling early stages of the disease—a situation typically associated with minimal striatal cell loss (Grade 0) in human cases. Neuronal mutation lengths that were two to three times that of the inherited allele were detected in both the Grade 0 human striatum (Fig. 2A) and HD mouse striatum (Fig. 4) sampled, despite differences in the way that cells were isolated (NeuN+ immunofluorescence in mouse and methylene blue staining in human). Such findings are consistent with the idea that the mutation lengths of striatal neurons start to increase very early in the disease process, although the descriptive nature of this study does not reveal whether mutation expansion is a cause or consequence of pathological changes.
Our data from the human cases tested suggest that patterns of mutation length variability may alter as disease pathology progresses. Although neuronal mutation length gains tend to be more prominent in the striatum than in the cortex in the low-grade HD cases sampled (Fig. 2), this distinction becomes less obvious in the more advanced (Grade 3/4) cases (P > 0.05, Mann–Whitney U test, χ2 test for proportion of mutation lengths ⩾60 repeats, Fig. 1). Do the data presented support a model proposing that mutation length gains contribute to both the progressive nature and cell-selective aspects of HD? Certainly, it is generally accepted that there is a correlation between increasing mutation length and accelerated pathology [for reviews of the evidence, see (16,17)] and so our findings are consistent with the idea that disease progression may be, in part, driven by neuronal mutation length gains. However, this is only part of the story as the patterns of neuronal cell vulnerability and loss typically vary in a region-specific manner throughout the brain. Neurodegenerative changes complicate the interpretation of mutation length data even in Grade 1 material where striatal neuronal loss can be as high as 50%. If mutation length gains do contribute to cellular pathology then surviving (and therefore sampled) neurons will tend to have lower CAG repeat lengths. This may help to explain that while neuronal mutation length in Grade 0 striatum tended to be higher than in Grade 0 cortex (Fig. 2), there was no significant difference in neuronal mutation length distributions of similar regions sampled in Grade 1 brain (Fig. 2) and Grade 3/4 brain (CAP and TP in Fig. 1). It is interesting to note, however, that even in advanced Grade 3/4 brains, regions such as the hippocampus (HF in Fig. 1) tended to have a lower median neuronal mutation lengths than the CAP (P ⩽ 0.05 for both T-213 and T-216, Mann–Whitney U test) and TP (P < 0.005 for T-216, Mann–Whitney U test). However, for the sake of balance it should also be pointed out that our results might be due to the effects of random sampling, e.g. differences in the number of neurons sampled per tissue or the use of non-matched sub-region-specific tissue samples across different HD cases. These caveats notwithstanding, if the modest number of human cases investigated here is representative of the wider picture, the resulting data broadly support the model proposing that neuronal mutation length gains contribute to patterns and progression of disease pathology in HD.
The case for a direct influence of mutation length gains on pathology was further investigated by determining whether the mutation length profiles of different sub-populations of cells within HD striatum and cortex varied according to their putative involvement in the disease process. First, we demonstrated that while the mutation length did vary within glial cells, mutation length gains within the corresponding neuronal populations tended to be significantly higher in all human (Grade 0 and Grade 1 striatum, Grade 3/4 CAP, TP and HF, ungraded cortex) and HD mouse tissues (27-month-old striatum) tested. This finding does not rule out a role for mutation length in any glial-mediated pathology, only that it may be a secondary phenomenon and/or more important in the later stages of the disease process. On this point, it is interesting to note that a recent study of spinocerebellar ataxia 7 mice demonstrated glial-induced cerebellar neurodegeneration caused by mutant ataxin-7 protein containing an expanded polyglutamine repeat (18). Our findings indicated that the relative magnitude and variability of glial mutation length changes appeared to increase in a manner that typically mirrored changes in the corresponding neuronal mutation profiles. An alternative reason for the presence of longer CAG repeats in neurons compared with glial cells may be related to differences in the turnover rates between these two cell types. It is possible that the presence of long repeats is detrimental, implying that glial cells with shorter repeats might have a selective advantage over those with long repeats, resulting in the ability of the former to outgrow the latter as the glial cell pool turns over. If this were the case, the insignificant turnover rate of neurons in adults would then account for the retention of a measurable number of cells with very long repeats.
We then took the investigation of cell-type specific mutation lengths a step further as it is well established that vulnerability to HD-related pathology varies within sub-sections of the neuronal population (1). For example, in the striatum, the numerically more numerous MSNs appear more vulnerable to dysfunction than the neighboring NOS+/somatostatin+ interneurons (1,19). A number of technical obstacles hampered our initial efforts to directly test the correlation between vulnerability/resistance to HD pathology and the propensity of immuno-defined neurons to mutation length gains. These included significant levels of background auto-fluorescence in human brain tissue and a lack of antibodies that selectively stain the cell body (and therefore the nucleus) of MSNs exclusively, in the mouse or human striatum. We therefore chose to compare mutation length changes in the pan-striatal neuron population (as identified by NeuN+ staining) with a ‘resistant’ population of striatal interneurons (as defined by NOS+ staining) in HD mice, reasoning that as most striatal cells are MSNs, this strategy would maximize the likelihood of detecting a difference in mutation length profiles, should it be present. Preliminary studies in 27-month-old HD mice striatum (Fig. 4) indicated no significant differences between the distribution of mutation lengths in MSNs and NOS+ interneurons. However, the extreme age of the mice tested raised the question of whether this ‘end picture’ was a true reflection of the relative susceptibility of different neuronal sub-types to mutation length changes. To address this concern we repeated the experiment using the striatum of much younger (6-month-old) mice (Fig. 5). In all three young mice tested, the median mutation length of the MSNs was significantly greater than the NOS+ interneurons. Although vulnerable medium-spiny neurons present a good candidate population for early mutation length gains since they constitute >90% of NeuN+ striatal cells, this prediction still requires formal confirmation in future studies.
Several key points emerge from the data generated in this study. It appears that different cell types within the brain do not uniformly contribute to the patterns of mutation length variability. Although the HD-associated CAG repeat was unstable in all cell types tested, glia tended to have smaller mutation length gains than neurons, although we cannot rule out the possibility that glial cells are more sensitive to expanded alleles since cell number would not noticeably decrease. Moreover, mouse studies indicated that neuronal sub-populations have different propensities for mutation length increases (e.g. those in NOS+ interneurons were significantly smaller than those in the broader group of NeuN+ neurons). Importantly, the neuronal data from both species provide additional support for the hypothesis that posits the involvement of inappropriate mismatch repair rather than replication in the mechanism responsible for mutation expansion in somatic tissues such as the brain [for a more in-depth discussion of the possible mechanisms, see (20,21)]. This is exemplified by the age-related mutation length gains in (presumed) non-replicating mouse neuronal cells, as observed by comparing NeuN+ profiles in Figures 4 and 5 derived from old and young mice that carry similar-sized inherited mutation lengths. Although non-replication-based mechanisms are likely to account for most of the mutation length changes observed in neurons, a contribution from replication-associated processes cannot be completely ruled out, particularly in the light of a recent study that detected cell proliferation (both neurons and glia) in response to cell death in the basal ganglia of HD brains (22). Moreover, our data do not shed further light on the cell-type-specific determinants that directly or indirectly induce the different levels of mutation instability observed. Even in the human and mouse germlines where HD expansion mutations are detected in the dividing spermatogonial cell population (23), we cannot be sure that replication rather than defects in repair are the predominant cause of the expansion process.
In summary, we have provided direct evidence to support the hypothesis that mutation length profiles in different regions of the brain may influence the topography and temporal order of neuropathological involvement in HD. Does this mean that mutation length variability in somatic tissues may also contribute to the progressive nature and cell-selective aspects of other diseases associated with triplet repeat expansions? Over the past few years, more and more evidence has been accumulating that correlates tissue-specific changes in mutation length with the symptoms of myotonic dystrophy [for a full discussion of this topic, see (20)]. In contrast, there is little support for the involvement of mutation length gains in the distinct, tissue-specific cell death and dysfunction observed in the non-HD polyglutamine diseases (24–28). However, few such studies have used sensitive techniques such as small pool or single molecule PCR, that, unlike amplification of bulk genomic DNA, serve to reveal the full range of mutation lengths present in a tissue or cell sample. Studies that have used laser capture microdissection to study mutation lengths in the cells of DRPLA patients, demonstrated that the mutation length in neurons tended to be more stable than glia in both cerebellum (26,29) and cortex (26). These particular studies may or may not serve to illustrate a further common problem encountered when trying to interpret mutation length profiles of somatic tissues such as brain—the use of tissue from patients who have died after a long disease course. Typically, the residual cell profile of end-stage tissue is much altered due to the loss of vulnerable neurons and the proliferation of cells such as glia. Therefore, in order to ultimately establish whether there is a relationship between the somatic mutation length and pathological vulnerability in the non-HD polyglutamine diseases, key evidence from defined cell types in candidate brain regions of the rare early cases of the disease (where cell loss is minimal) will be required.
MATERIALS AND METHODS
Human and mouse brain tissue
All human brain samples came from pathologically and genetically confirmed cases of HD and were acquired under appropriate IRB approval. Human striatal tissue blocks from one HD Vonsattel Grade 0 (B2055) and one HD Vonsattel Grade 1 (B2505) brain were kindly provided by the Harvard Brain and Tissue Resource Center (Belmont, MA, USA) [for more details of the Vonsattel scale, see (30)]. Fresh frozen 8 µm thick hemi-coronal tissue sections were cut through the body of the caudate-putamen and mounted onto Superfrost microscope slides. Frozen tissue from the temporal cortex of a further HD patient (case no. 1682) was also obtained from the same Center. In addition, frozen brain tissues from a pair of twins (T-213 and T-216, Vonsattel Grades 4/4 and 3/4, respectively) were obtained from the New York Brain Bank in the Department of Pathology at the College of Physicians and Surgeons of Columbia University. The genetic relationship between the twins was assessed using a panel of nine microsatellite markers (AmpFlSTR® Profiler Plus® PCR Amplification Kit): allele calling was made using GeneMapper 4.0. T-213 and T-216 brain DNA had identical microsatellite genotypes. In addition, each twin's DNA was genotyped using a human 100K Illumina SNPchip using the procedures recommended by the manufacturer. Of the 109 365 SNPs on the chip, 108 860 gave a result for each twin (99.53% call rate). The twins had identical genotypes at all but five of the 108 860 loci (99.995% identical). The difference between the two samples falls within the range seen in replicate studies using a single DNA sample in the laboratory that carried out the experiment and is almost identical to the expected results based on a twin study using Affymetrix chip methodology (31). Details of the human tissue samples used in the study are summarized in Table 1. Brain tissue was harvested from heterozygous Hdh6/Q72 and Hdh4/Q80 mice (11) (hereafter referred to as HD mice) of various ages and frozen at −80°C prior to use. All mice used in this study were maintained on a DBA/2 background and all procedures were carried out in accordance with local ethical guidelines and UK Home Office legislation.
Analysis of grey and white matter
Dissections were carried out to obtain grey and white matter from the TP, HF and CAP from HD cases T-213 and T-216 (Table 1). We estimate that the grey matter contains up to 50% neuronal cell bodies depending upon the disease stage and the white matter is devoid of neuronal cell bodies. DNA isolation and CAG repeat copy number determination used methods described previously (23).
Defining and harvesting different neuronal cell types using LCM
Pools of 20–50 neurons or glia were harvested from 8 µm thick fresh frozen cryostat tissue sections using a PixCell II (Arcturus) essentially as described previously (10,32). Striatal and cortical neurons were visualized using either methylene blue staining (human tissue) or NeuN-immunofluorescence (mouse tissue). Neu-N staining was performed by incubating the frozen tissue section with a 1:100 dilution of MAB377 (Chemicon) for 1 h at room temperature. Microglia were visualized using ethidium bromide staining (10 mg/ml) and nNOS-immunopositive striatal interneurons were visualized using a standard rapid-immunofluorescence protocol. Briefly, tissue was incubated with a 1:500 dilution of the N1755 nNOS antibody (Sigma) for 10 min at room temperature (10,32). In the case of the temporal cortex sample from case no. 1682, the frozen tissue was gradually fixed in ethanol, paraffin-embedded, cut into 5 µm sections and lightly stained with hematoxylin. Laser capture of glial and neuronal cells from this material was also carried out with a PixCell II instrument in a manner previously described (23).
Preparation of genomic DNA from laser-dissected cells and CAG repeat copy number determination
Following laser-dissection, genomic DNA was recovered from the captured cells by digestion with proteinase K at 65°C (Pico Pure DNA Extraction Kit, Arcturus). Following a 5 min heat inactivation at 95°C, samples were cooled to room temperature and stored at −80°C prior to use. The DNA samples and negative controls (comprising DNA extraction buffer only) were then subjected to a nested PCR protocol in order to determine the length of the CAG repeat at the HD locus. Initially, dilutions of the DNA samples were performed such that each first-round reaction tube contained one to two cells worth of input DNA. The mouse samples were then amplified in 10% DMSO, 1× Custom PCR buffer (45 mm Tris–HCl, pH 8.8, 11 mm (NH4)2SO4, 4.5 mm MgCl2, 0.113 mg/ml BSA, 4.4 µm EDTA, 1 mm dATP, 1 mm dCTP, 1 mm dGTP and 1 mm dTTP) (ABgene) 2.4 µm MHD16 (5′-CCCATTCATTGCCTTGCTGCTAAG-3′), 2.4 µm MHD18 (5′-GACTCACGGTCGGTGCAGCGGTTCC-3′), 0.1 U/µl Taq DNA polymerase (Sigma) and subjected to the following PCR protocol: 94°C for 4 min followed by 20 cycles of 94°C for 30 s, 60°C for 45 s, 72°C for 30 s and a final extension step of 72°C for 10 min. The resulting product was diluted 1:100 with ultra-pure water (Sigma) and 1 µl was added to second round PCR amplification mixture containing 10% DMSO, 1× Custom PCR buffer (ABgene as above), 2.4 µm MHD7 (5′-TAGTGCCAGTAGGCTCCAAG-3′) 2.4 µm MHD50 (5′-AGCGGTTCCTCTGCCGGACCTG-3′), 0.1 U/µl Taq DNA polymerase (Sigma). The reactions were subjected to the following PCR protocol: 94°C for 4 min followed by 25 cycles of 94°C for 30 s, 60°C for 45 s, 72°C for 30 s and a final extension step of 72°C for 10 min. The human samples were amplified in 10% DMSO, 1× Custom PCR buffer (ABgene as above), 2.4 µm LKH1 (5′-CCCATTCATTGCCCCGGTGCTG -3′), 2.4 µm LKH5 (5′-TGGGTTGCTGGGTCACTCTGTC-3′), 0.1 U/µl Taq DNA polymerase (Sigma) and subjected to the following PCR protocol: 94°C for 4 min followed by 20 cycles of 94°C for 30 s, 60°C for 45 s, 72°C for 30 s and a final extension step of 72°C for 10 min. The resulting product was diluted 1:100 with ultra-pure water (Sigma) and 1 µl was added to second round PCR amplification mixture containing 10% DMSO, 1× Custom PCR buffer (ABgene as above), 2.4 µm HU3 and HDF primers (33) 0.1 U/µl Taq DNA polymerase (Sigma). The reactions were subjected to the following PCR protocol: 94°C for 4 min followed by 28 cycles of 94°C for 30 s, 62°C for 45 s, 72°C for 60 s and a final extension step of 72°C for 10 min. The products were visualized and sized either by Southern blot analysis as previously described (7) or by utilizing a MHD7 or HU3 primer with 5′-HEX fluorescent tags followed by electrophoresis on an ABI Prism373 DNA Sequencer system (Applied Biosystems) (4.75% polyacrylamide gel) and sizing using Genescan software (Applied Biosystems) after mixing samples with the Rox1000 size standard (Applied Biosystems). The MHD7 and MHD50 primers amplify a 245 bp product from the WT Hdh mouse locus with a repeat configuration of (CAG)2 CAA(CAG)4. Using HU3 and HDF primers, a 149 bp product is amplified from an unaffected human HD locus with a repeat configuration of (CAG)22CAACAG. All reactions were set up in a laminar flow hood and no contaminating alleles were detected in the ∼20% of reactions per run that were zero DNA controls.
Statistical analysis
Comparisons of intra-individual CAG repeat mutation length profiles in different tissues were performed using the Mann–Whitney U test. Differences in the proportion of alleles with specified number of repeats were investigated using the Chi-square test.
SUPPLEMENTARY MATERIAL
Supplementary Material is available at HMG Online.
ACKNOWLEDGEMENTS
Thanks to Darren Monckton and the rest of the University of Glasgow Dynamic Mutation Group for helpful discussions as well as Colin Chapman and Colin Hughes for expert technical assistance. We also thank the USC Norris Cancer Center genotyping core for the twin zygosity determinations and the Harvard Brain Tissue Resource Center, McLean Hospital, Belmont, MA for tissue samples. This study was funded by grants from the Hereditary Disease Foundation (in the form of a Cure HD Initiative award to P.F.S and S.J.A.), the National Institute of General Medical Sciences (GM36745 to N.A.) and the Department of Defense (OC300012 to L.D.).
Conflict of Interest statement. None declared.
