


Abstract
Caffeine is the most widely consumed psychoactive substance in the world and presents with wide interindividual variation in metabolism. This variation may modify potential adverse or beneficial effects of caffeine on health. We conducted a genome-wide association study (GWAS) of plasma caffeine, paraxanthine, theophylline, theobromine and paraxanthine/caffeine ratio among up to 9,876 individuals of European ancestry from six population-based studies. A single SNP at 6p23 (near CD83) and several SNPs at 7p21 (near AHR), 15q24 (near CYP1A2) and 19q13.2 (near CYP2A6) met GW-significance (P < 5 × 10⁻⁸) and were associated with one or more metabolites. Variants at 7p21 and 15q24 associated with higher plasma caffeine and lower plasma paraxanthine/caffeine (slow caffeine metabolism) were previously associated with lower coffee and caffeine consumption behavior in GWAS. Variants at 19q13.2 associated with higher plasma paraxanthine/caffeine (slow paraxanthine metabolism) were also associated with lower coffee consumption in the UK Biobank (n = 94 343, P < 1.0 × 10⁻⁶). Variants at 2p24 (in GCKR), 4q22 (in ABCG2) and 7q11.23 (near POR) that were previously associated with coffee consumption in GWAS were nominally associated with plasma caffeine or its metabolites. Taken together, we have identified genetic factors contributing to variation in caffeine metabolism and confirm an important modulating role of systemic caffeine levels in dietary caffeine consumption behavior. Moreover, candidate genes identified encode proteins with important clinical functions that extend beyond caffeine metabolism.
Introduction
Caffeine (1,3,7 trimethylxanthine, 137X) is the most widely consumed psychoactive substance in the world (1). Although naturally present in coffee, tea and chocolate, caffeine is also increasingly added to a variety of foods and beverages and this has fostered interest and concern regarding potential health effects of caffeine in the diet (1,2).
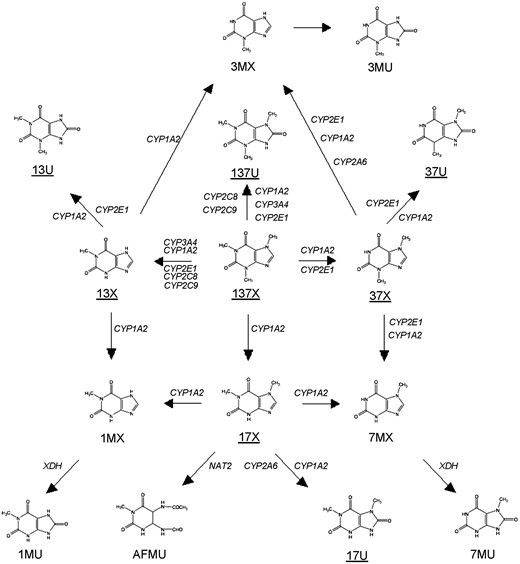
Our current understanding of caffeine metabolism in humans. Metabolites underlined are amongst those examined in the current study. 137X: 1,3,7-trimethylxanthine (caffeine); 17X: 1,7-dimethylxanthine (paraxanthine); 13X: 1,3-dimethylxanthine (theophylline); 37X: 3,7-dimethylxanthine (theobromine); 137U:1,3,7-trimethyluric acid; 17U: 1,7-dimethyluric acid; 13U:1,3-dimethyluric acid; 37U: 3,7-dimethyluric acid; 1MX: 1-methylxanthine; 3MX: 3-methylxanthine; 7MX: 7-methylxanthine; 1MU: 1-methyluric acid; 3MU: 3-methyluric acid; 7MU: 7-methyluric acid; AFMU: 5-acetylamino-6-formylamino-3-methyluracil. Data from (7, 8).
Clinical pharmacokinetic studies have identified a number of environmental and biological factors impacting caffeine metabolism and, more specifically, its CYP1A2-mediated metabolism (5–7,9). However, much of the variation in caffeine metabolism is heritable and clinical studies have limited power in identifying the precise genetic factors (6,9). Population-based genome-wide association studies (GWAS) have identified eight loci associated with self-reported coffee and caffeine intake (10,11). The most prominent loci map near AHR and CYP1A2, which code for biological candidate proteins involved in caffeine metabolism. Moreover, GWAS of the human metabolome identified a significant association between cross-sectional measures of plasma caffeine levels and the same loci near AHR (12, 13). In the current study, we build on our previous work to identify loci associated with different aspects of caffeine metabolism in a larger sample and with a more comprehensive analysis of the caffeine metabolic pathway. The results are additionally mined to gain insight to loci previously associated with dietary caffeine intake behavior.
Results
Genome-wide association studies
We performed a meta-analysis of GWAS summary statistics from six population-based studies of European ancestry to detect single-nucleotide polymorphisms (SNPs) that are associated with plasma 137X, 17X, 13X, 37X, 1,3,7-trimethyluric acid (137U) and the plasma ratio: 17X/137X (Supplementary Material, Table S1–S3, Fig. 1). Study participant characteristics closest to the time of blood collection are presented in Supplementary Material, Table S2. Overall, men (36%) and women (64%) were aged ∼48 to 71 years and 17% reported currently smoking. GW-significant SNPs were identified for 137X (n = 25), 17X (n = 1), 13X (n = 1) and 17X/137X (n = 103), and together mapped to 22 independent SNPs (defined as r2 < 0.3 or distance >500 kb) in four genomic regions (Table 1, Supplementary Material, Table S4, Supplementary Material, Figs. S1–S8). Within two of the four candidate regions, 7p21 and 19q13.2, we identified 13 GW-significant indel associations with 17X/137X (Supplementary Material, Table S5). Four of these indels did not correlate with GW-significant SNPs in these regions (Table 1). Heterogeneous allelic effects (I2 > 50%) were observed at 7p21 and 19q13.2 for 17X/137X. Although most index SNPs were imputed by contributing studies, imputation quality was excellent (Supplementary Material, Table S6).
SNPs associated with plasma caffeine and its primary metabolites
| Locus | Chr:Position | Index SNP | EA/NEA | EAF | 137Xa | 17Xa | 13Xa | 37Xa | 137Ua | 17X/137Xa | ||||||
|---|---|---|---|---|---|---|---|---|---|---|---|---|---|---|---|---|
| N: 9054-9876 | N:5371-6204 | N:5261-6057 | N:8009-8835 | N:3562 | N:5323-6147 | |||||||||||
| Z | P | Z | P | Z | P | Z | P | Z | P | Z | P | |||||
| 6p23 | 6:14161434 | rs62391270 | T/C | 0.82 | −3.38 | 7.4 × 10⁻⁴ | −5.54 | 3.0 × 10⁻⁸ | −3.77 | 1.6 × 10⁻⁴ | −3.55 | 3.9 × 10⁻⁴ | −2.79 | 5.3 × 10⁻³ | −0.03 | 0.98 |
| 7p21 | 7:17284577 | rs4410790b | T/C | 0.36 | 7.36 | 1.8 × 10⁻¹³ | 1.9 | 0.06 | 3.15 | 1.6 × 10⁻³ | 2.63 | 8.6 × 10⁻³ | 0.12 | 0.9 | −8.07 | 7.2 × 10⁻¹⁶ |
| 7:17287106 | rs6968554b | A/G | 0.37 | 7.22 | 5.4 × 10⁻¹³ | 1.42 | 0.15 | 2.78 | 5.4 × 10⁻³ | 2.73 | 6.3 × 10⁻³ | 0.08 | 0.93 | −8.44 | 3.2 × 10⁻¹⁷ | |
| 7:17303778 | rs10275488 | T/C | 0.1 | 5.85 | 4.8 × 10⁻⁹ | 1.83 | 0.07 | 3.46 | 5.5 × 10⁻⁴ | 1.65 | 0.1 | 0.11 | 0.91 | −5.98 | 2.3 × 10⁻⁹ | |
| 7:17324624 | rs2892838 | A/C | 0.56 | −4.55 | 5.4 × 10⁻⁶ | −0.44 | 0.66 | −1.96 | 0.05 | −0.77 | 0.44 | −0.17 | 0.86 | 6.01 | 1.8 × 10⁻⁹ | |
| 7:17385506 | rs11400459 | A/AT | 0.64 | −4.52 | 6.3 × 10⁻⁶ | −0.82 | 0.41 | −1.81 | 0.07 | −1.07 | 0.28 | 0.19 | 0.85 | 6.23c | 4.6 × 10⁻¹⁰ | |
| 7:17396746 | rs10683220 | G/GTTAACA | 0.63 | −4.7 | 2.6 × 10⁻⁶ | −0.74 | 0.46 | −1.63 | 0.1 | −1.06 | 0.29 | −0.07 | 0.94 | 6.11c | 1.0 × 10⁻⁹ | |
| 15q24 | 15:74782356 | rs12909047 b | A/G | 0.51 | −6.77 | 1.3 × 10⁻¹¹ | −3.62 | 3.0 × 10⁻⁴ | −5.7 | 1.2 × 10⁻⁸ | −2.59 | 9.6 × 10⁻³ | −0.03 | 0.97 | 5.15 | 2.6 × 10⁻⁷ |
| 15:74817689 | rs35107470 b | A/G | 0.68 | 8.2 | 2.4 × 10⁻¹⁶ | 3.25 | 1.2 × 10⁻³ | 5.18 | 2.2 × 10⁻⁷ | 2.56 | 0.01 | −0.23 | 0.82 | −7.58 | 3.5 × 10⁻¹⁴ | |
| 15:74890981 | rs62005807 | C/G | 0.11 | −5.92 | 3.2 × 10⁻⁹ | −1.32 | 0.19 | −2.98 | 2.9 × 10⁻³ | −0.18 | 0.86 | −0.61 | 0.54 | 6.65 | 2.9 × 10⁻¹¹ | |
| 15:75019449 | rs2470893b | T/C | 0.33 | −8.65 | 5.3 × 10⁻¹⁸ | −3.62 | 3.0 × 10⁻⁴ | −5.3 | 1.2 × 10⁻⁷ | −2.12 | 0.03 | −0.38 | 0.7 | 7.85 | 4.1 × 10⁻¹⁵ | |
| 15:75027880 | rs2472297b | T/C | 0.27 | −9.34 | 1.0 × 10⁻²⁰ | −3.07 | 2.2 × 10⁻³ | −5.27 | 1.4 × 10⁻⁷ | −1.82 | 0.07 | −0.97 | 0.33 | 9.58 | 9.5 × 10⁻²² | |
| 19q13.2 | 19:41195170 | rs66500423 | T/C | 0.67 | −1.36 | 0.17 | 3.34 | 8.5 × 10⁻⁴ | 1.1 | 0.27 | 2.48 | 0.01 | 0.64 | 0.52 | 5.83 | 5.6 × 10⁻⁹ |
| 19:41326426 | rs4803373 | C/G | 0.41 | −1.25 | 0.21 | 3.48 | 5.0 × 10⁻⁴ | 0.11 | 0.91 | 2.93 | 3.4 × 10⁻³ | 0.14 | 0.89 | 6.9 | 5.3 × 10⁻¹² | |
| 19:41332171 | rs78011401 | T/C | 0.31 | 1.6 | 0.11 | −1.99 | 0.05 | 1.57 | 0.12 | −2.11 | 0.03 | 0.49 | 0.62 | −5.78 | 7.6 × 10⁻⁹ | |
| 19:41343871 | rs11668399 | C/G | 0.29 | −1.03 | 0.3 | 2.98 | 2.9 × 10⁻³ | −0.28 | 0.78 | 2.94 | 3.2 × 10⁻³ | 0.36 | 0.72 | 6.37 | 1.9 × 10⁻¹⁰ | |
| 19:41353107 | rs56113850 | T/C | 0.43 | −0.78 | 0.44 | 5.43 | 5.7 × 10⁻⁸ | 0.11 | 0.91 | 4.59 | 4.4 × 10⁻⁶ | 1.17 | 0.24 | 9.59c | 9.3 × 10⁻²² | |
| 19:41353338 | rs56267346 | A/G | 0.82 | −0.91 | 0.36 | −3.93 | 8.5 × 10⁻⁵ | −0.51 | 0.61 | −2.61 | 9.1 × 10⁻³ | 0.93 | 0.35 | −6.13c | 8.9 × 10⁻¹⁰ | |
| 19:41354458 | rs28399442 | A/C | 0.02 | 0.14 | 0.89 | 2.52 | 0.01 | 0.26 | 0.79 | 2.52 | 0.01 | 0.47 | 0.64 | 6.48c | 9.5 × 10⁻¹¹ | |
| 19:41357457 | rs67210567 | T/G | 0.02 | −1.38 | 0.17 | 1.67 | 0.09 | −0.89 | 0.37 | 1.86 | 0.06 | 0.18 | 0.86 | 5.94c | 2.9 × 10⁻⁹ | |
| 19:41357632 | rs7260629 | T/G | 0.3 | −1.12 | 0.26 | 3.19 | 1.4 × 10⁻³ | −0.85 | 0.4 | 3.77 | 1.7 × 10⁻⁴ | 1.62 | 0.11 | 6.73 | 1.7 × 10⁻¹¹ | |
| 19:41361572 | rs5828081 | AT/A | 0.66 | 0.75 | 0.45 | −3.8 | 1.4 × 10⁻⁴ | −0.004c | 0.99 | −2.85 | 4.3 × 10⁻³ | −1.31 c | 0.19 | −6.92 | 4.7 × 10⁻¹² | |
| 19:41363094 | rs200292835 | T/TTTTG | 0.68 | 1.22 | 0.22 | −3.04 | 2.4 × 10⁻³ | 0.49 | 0.63 | −3.44 | 5.9 × 10⁻⁴ | −2.36 | 0.02 | −5.71 | 1.1 × 10⁻⁸ | |
| 19:41388740 | rs28602288 | T/C | 0.65 | −0.68 | 0.5 | −4.31 | 1.6 × 10⁻⁵ | −1 | 0.32 | −2.16 | 0.03 | −0.27 | 0.79 | −5.72c | 1.1 × 10⁻⁸ | |
| 19:41392490 | rs79600176 | T/C | 0.98 | −0.3 | 0.76 | −2.96 | 3.1 × 10⁻³ | −0.5 | 0.61 | −2.44 | 0.01 | −0.02 | 0.99 | −6.64c | 3.1 × 10⁻¹¹ | |
| 19:41412192 | rs184589612 | T/C | 0.99 | −0.76 | 0.45 | −1.76 | 0.08 | 0.05 | 0.96 | −1.69 | 0.09 | −1.35 | 0.18 | −5.92c | 3.2 × 10⁻⁹ | |
| 19:41414481 | rs72480748 | A/G | 0.31 | 1.19 | 0.24 | −1.62 | 0.11 | 0.12 | 0.91 | −1.27 | 0.21 | −1.85 | 0.06 | −6.08 | 1.2 × 10⁻⁹ | |
| 19:41417727 | rs10425738 | A/G | 0.72 | 0.97 | 0.33 | −2.24 | 0.03 | 0.13 | 0.89 | −2.02 | 0.04 | −0.49 | 0.62 | −5.65 | 1.6 × 10⁻⁸ | |
| 19:41485380 | rs56881024 | A/T | 0.65 | 0.73 | 0.46 | −3.09 | 2.0 × 10⁻³ | −0.09 | 0.93 | −2.28 | 0.02 | −0.63 | 0.53 | −5.57 | 2.5 × 10⁻⁸ | |
EA, effect allele; NEA, non-effect allele; EAF, effect allele frequency; 137X: 1,3,7-trimethylxanthine (caffeine); 17X: 1,7-dimethylxanthine (paraxanthine); 13X: 1,3-dimethylxanthine (theophylline); 37X: 3,7-dimethylxanthine (theobromine); 137U: 1,3,7-trimethyluric acid.
aStandardized (Z) scores representing an increase/decrease in plasma metabolite level per effect allele, and corresponding P-values from fixed-effects meta-analysis.
bSNPs for each trait were independently pruned for LD. Thus, r2 between trait-specific index-SNPs may exceed our threshold for defining ‘independent’ SNPs (r2 < 0.3, 500 kb).
cSignificant heterogeneity in allelic effects (I2 > 50%).
Follow-up metabolite analysis
All top index SNPs and indels were followed up in several of the participating studies for association testing with the same or related metabolites and ratios in plasma and urine (Supplementary Material, Table S3). Table 2 summarizes the results of these analyses while details are provided in Supplementary Material, Tables S4 and S7. Patterns of associations consistent with respective plasma metabolites and/or proximity in the caffeine metabolic pathways were observed. We also tested SNP associations with plasma levels of trigonelline (Trig) and quinine (QN), both unrelated to caffeine, but correlated with coffee intake (4). We observed convincing SNP associations only when Trig and QN were modeled as ratios with caffeine (i.e. 137X/Trig and 137X/QN).
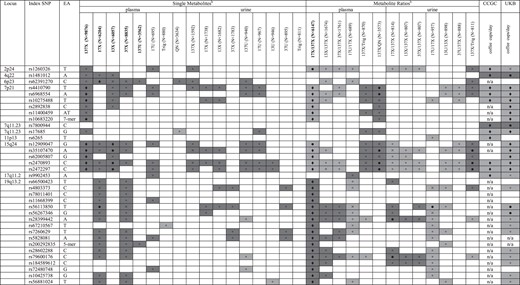
Summary of GW-loci for caffeine metabolites and coffee consumptiona
 |
|
EA, effect allele.
aShown are simplified results from SNP-trait linear regressions performed in the current study for plasma and urine metabolites (columns 4–33) and coffee consumption (UK Biobank, column 35). Published SNP-coffee consumption associations from CCGC (11) are presented in column 34. Shading corresponds to direction of effects: an increase (dark gray) or decrease (light gray) in metabolite levels or coffee consumed. Symbols correspond to statistical tests: ♦P < 2.5 × 10⁻⁸; •P < 5 × 10⁻⁶; ×P < 5 × 10⁻⁴; □ P < 0.05; n/a: data not available; no symbol: P ≥ 0.05.
bSee Supplementary Material, Table S1 and Figure 1 for metabolite full names. Bold-face metabolites were subject to GWAS in the current report.
Summary of GW-loci for caffeine metabolites and coffee consumptiona
|
|
EA, effect allele.
aShown are simplified results from SNP-trait linear regressions performed in the current study for plasma and urine metabolites (columns 4–33) and coffee consumption (UK Biobank, column 35). Published SNP-coffee consumption associations from CCGC (11) are presented in column 34. Shading corresponds to direction of effects: an increase (dark gray) or decrease (light gray) in metabolite levels or coffee consumed. Symbols correspond to statistical tests: ♦P < 2.5 × 10⁻⁸; •P < 5 × 10⁻⁶; ×P < 5 × 10⁻⁴; □ P < 0.05; n/a: data not available; no symbol: P ≥ 0.05.
bSee Supplementary Material, Table S1 and Figure 1 for metabolite full names. Bold-face metabolites were subject to GWAS in the current report.
Pathway and gene-based analysis
GW-summary statistics for plasma 137X were significantly enriched for gene members of ‘N-glycan biosynthesis’ (FDR = 0.04) and ‘other polysaccharide metabolism’ (FDR = 0.04) pathways (Supplementary Material, Table S8). GW-summary statistics for plasma 17X yielded four significant pathways: ‘drug metabolic process’ (FDR = 0.01), ‘xenobiotics’ (FDR = 0.02), ‘nicotine degradation’ (FDR = 0.02), ‘NF-kappaB cascade’ (FDR = 0.03) and ‘5HT3-type receptor mediated signaling’ (FDR = 0.05). 13X summary statistics were significantly enriched for gene members of ‘5HT3-type receptor mediated signaling’ (FDR = 0.05). GW-summary statistics for plasma 17X/137X yielded three significant pathways: ‘xenobiotics’ (FDR = 0.002), ‘nicotine degradation’ (FDR = 0.01) and ‘NF-kappaB cascade’ (FDR = 0.03). Each of 280 autosomal genes mapped to one or more of these seven pathways, a custom CYP1A2 regulation pathway (14) or the caffeine metabolism pathway (Fig. 1), and were subject to gene-based testing. Tests for AHR, CYP1A2, CYP1A1, CYP2B6, CYP2A6 and CYP2A7 reached statistical significance (defined as P < 1.8 × 10⁻⁴ [0.05/280]) for plasma 137X, 13X or 17X/137X. Several nominally significant genes were also observed (Supplementary Material, Table S9).
Potential SNP-function
Putative causal variants in cell types of action and target genes were predicted for GW-confirmed loci (Table 1) by systematically mining comparative, epigenomic and regulatory annotations. SNP level results are detailed in Supplementary Material, Table S10. Overall, we observed the strongest enrichment for enhancers in adult liver, relative to all common SNPs (binomial P < 2 × 10⁻⁶) and GWAS SNPs (binomial P < 9.7 × 10⁻⁴), regardless of enhancer definition (i.e. 15-state core ChromHMM model, H3K4me1 peaks or H3K27ac peaks). The index SNP rs10275488 lies 34kb upstream of AHR and is an eQTL for this gene in dendritic cells. All five index SNPs at 15q24 span a distance of ∼250 kb harboring ARID3B, CLK3, EDC3 and CYP1A1 and lie at DNAse sites that overlap enhancers within several tissue types. QTLs are reported for rs62005807 (ULK3), rs2470893 (CSK, MPI, SCAMP2, ULK3) and rs2472297 (CSK, SCAMP2, ULK3). Of several transcription factor motifs disrupted at these SNP sites, the most intriguing are those for rs12909047: AhR and Arnt; which form a heterodimer that binds to response elements to initiate specific gene transcription (15). Moreover, rs2470893 and rs2472297 both lie upstream of CYP1A1 and CYP1A2, within the 24kb intergenic region where several aryl hydrocarbon response elements (AHRE) reside. SNPs at 19q13.2 span ∼310 kb harboring the CYP2 cluster, as well as NUMBL, ADCK4, ITPKC, SNRPA, MIA and EGLN2 and overlap several enhancers and other regulatory elements.
Overlap of loci for caffeine metabolites and coffee consumption behavior
Table 2 and Supplementary Material, Tables S4 and S7 also include results for the association between metabolites and SNPs previously associated with coffee consumption (11). SNPs at 7p21 (AHR) and 15q24 (CYP1A2) associated with coffee consumption behavior were the same SNPs associated with caffeine metabolites in GWAS (Table 1). SNPs at 2p24 (GCKR), 4q22 (ABCG2), and 7q11.23 (POR) were at least nominally associated with three or more metabolite measures. There was no convincing evidence to support an association between SNPs at 7q11.23 (MLXIPL) and 17q11.2 (EFCAB6, SLC6A4) and caffeine metabolites. None of the 19q13.2 index SNPs were examined in the GWAS of coffee consumption, although SNPs in moderate LD presented nominal associations (data not shown). In a new analysis of 94 343 coffee drinkers from the UK Biobank, we replicated seven of the eight loci identified in the previous GWAS of coffee consumption (P < 0.05, Table 2). Moreover, alleles of rs56113850 and rs56267346 at 19q13.2 associated with higher 17X/137X were strongly associated with lower coffee consumption (P < 1.0 × 10⁻⁶). Results were similar when restricting to participants reporting consumption of mostly regular coffee (n = 75 627), with the exception that rs9902453 in 17q11.2 was no longer significant (P = 0.06, but same direction of effect). SNPs at 7p21, 15q24, 7q11.23 (POR) and 19q13.2 were also associated with the consumption of tea (P < 0.002), another source of dietary caffeine. Among participants reporting consumption of mostly decaffeinated coffee (n = 18,275), nominal associations were observed between Table 2 variants at 4q22 (P = 0.0007), 7p21 (0.04 < P < 2.3 × 10⁻⁷), 7q11.23 (MLXIPL, P = 0.004), 7q11.23 (POR, P < 2.3 × 10⁻⁷), 15q24 (0.02 < P < 1.5 × 10⁻⁷) and 19q13.2 (P < 0.04 for rs56881024 and rs56267346 only) and decaffeinated coffee consumption, with direction of effects consistent with those reported for total and regular coffee.
Discussion
In this study, we leverage the existing knowledge of caffeine pharmacology and power of large population-based –omics studies to identify loci associated with plasma levels of caffeine metabolites in humans. Despite the absence of data concerning recent caffeine intake prior to sample collection, we identified three genomic regions mapping to biologically relevant candidate genes. Our study also informs about mechanisms of SNPs identified in our previous GWAS of coffee consumption and, in turn, confirms an important modulating role of systemic caffeine levels in dietary caffeine consumption behavior.
Consistent with the major role of CYP1A2 in caffeine metabolism (3,8,16), SNPs near CYP1A2 were significantly associated with 17X/137X and 137X levels as well as several other caffeine metabolites measured in plasma or urine. The most significant index SNP (rs2472297) maps to the bidirectional promoter region of CYP1A1 and CYP1A2, where known AHRE reside. The aryl hydrocarbon receptor (Ahr) plays an important role in CYP1A2 expression (17), and its gene is also the only candidate residing at 7p21, where up to 6 SNPs correlate with plasma 17X/137X and 137X. All alleles at 7p21 and 15q24 that were associated with lower 17X/137X were associated with higher 137X levels, suggesting they are associated with slow caffeine metabolism. Individuals with these particular alleles may require less caffeine than individuals with the alternate alleles to achieve or maintain the levels needed for the optimal psychostimulant effects of caffeine. Their threshold for adverse effects of caffeine may also be lower. Indeed, the same alleles were associated with lower caffeine and coffee consumption in previous GWAS (10, 11) and in the UK Biobank in this study.
The most plausible candidate at 19q13.2 associated with 17X/137X is CYP2A6. Based on existing knowledge, however, CYP2A6 does not catalyze the demethylation of 137X to 17X, but rather hydroxylates 17X to 17U (Fig. 1). The latter metabolic step is responsible for only 10-20% of 17X clearance and is also catalyzed by CYP1A2 and xanthine dehydrogenase, but to a lesser extent relative to CYP2A6 (3,8,18,19). The association between CYP2A6 variation and 17X/137X is likely an indirect result of altered 17X metabolism. Indeed, CYP2A6 variants linked to higher 17X/137X were associated with higher 17X and lower plasma and urine 17U/17X ratio (a measure of CYP2A6 activity (20)), but presented with no association with 137X. Pharmacokinetic studies also report associations between CYP2A6 variation and urine 17U/17X and (5-acetylamino- 6-amine-3-methyluracil + 1-methylxanthine + 1-methyluric acid)/17U (originally described as an index of CYP1A2 activity (18, 21, 22). Our interpretation is further supported by the literature pertaining to CYP2A6 variation and nicotine metabolism. Up to 75% of nicotine is converted to cotinine (COT) mainly by CYP2A6 and most of COT is converted to trans 3-hydroxycotinine (THOC) exclusively by CYP2A6 (23). The ratio of THOC/COT is thus a common proxy for CYP2A6 activity and nicotine clearance (23, 24). rs56113850, our top 19q13.2 index SNP for 17X/137X, was also the top GW-significant SNP reported in a recent GWAS of plasma THOC/COT by Loukola et al (25). The minor T allele, which we propose reduces CYP2A6-mediated hydroxylation of 17X, was linked to lower THOC/COT. CYP2A6*2 (rs1801272), encoding a catalytically inactive enzyme (26), and other SNPs at 19q13.2 associated with THOC/COT identified by Loukola et al (25) and others (27), were also associated with 17X/137X (data not shown). Variants at 19q13.2 linked with lower THOC/COT predispose to heavy smoking (27, 28). In the UK Biobank, these same variants were nominally associated with increased coffee consumption. The weaker CYP2A6-behavior association relative to CYP1A2- and AHR- behavior associations may reflect the minor role of CYP2A6 in caffeine metabolism.
A single SNP at 6p23 near CD83 was significantly associated with 17X. Although associations between this SNP and other plasma and urine caffeine metabolites were also observed, a plausible link between the 6p23 locus and caffeine metabolism is unknown. Variation in other candidate genes involved in caffeine metabolism or CYP450 regulation did not yield statistically significant associations. It is possible that these genes have less common functional SNPs or very modest effects on plasma caffeine metabolite levels that warrant a larger sample size to detect.
In addition to loci near CYP1A2 and AHR discussed earlier, the CCGC identified six additional SNPs associated with coffee consumption (Table 2). rs17685 maps to the 3′UTR of POR, encoding P450 oxidoreductase which transfers electrons to all microsomal CYP450s enzymes (29). Given this function and the observation that the rs17685 C variant associated with lower coffee consumption (11) was nominally associated with higher plasma caffeine levels, the mechanism linking this variant to coffee consumption behavior may be similar to that of AHR and CYP1A2, as discussed earlier. rs1481012 at 4q22 maps to ABCG2, encoding a xenobiotic efflux transporter. The more frequent rs1481012 A allele previously linked with higher coffee consumption was nominally associated with higher plasma levels of 137X, 17X and 13X compared with the minor G allele. The latter allele is in LD (CEU: r2 = 0.92) with a nonsynoymous SNP (rs2231142, Gln141Lys) allele that results in reduced ABCG2 protein expression and function (30). ABCG2 is expressed in apical membranes of the liver, kidney, intestine and brain, and plays an important role in in preventing absorption and excessive accumulation of numerous xenobiotic and endogenous substrates in certain tissues (31). ABCG2 is a plausible candidate but unlikely via its role at the gastrointestinal, renal or hepatic sites. Caffeine and dimethylxanthines have favorable permeability characteristics that allow them to readily bypasses efflux transporters and also have relatively low renal clearance rendering limited contact with renal transporters (32). ABCG2 facilitates biliary excretion of substrates and may also affect hepatic metabolic clearance by modulating the duration of substrate exposure to hepatic enzymes. Whether biliary excretion of caffeine is common in healthy individuals is unclear. Even so, if the putative reduced-function ABCG2 allele impairs caffeine biliary excretion and leads to increased hepatic metabolism of caffeine, the consequential lower caffeine levels should have been met with a compensatory increase in dietary caffeine consumption as observed for AHR, CYP1A2 and POR. The positive correlation of a putative normal ABCG2 variant with both plasma caffeine levels and caffeine intake behavior suggests this relationship might take place at the blood-brain barrier (BBB); where ABCG2 functions to restrict the brain penetration of compounds (33). In rats, caffeine enters the brain by both passive diffusion and active influx and has rapid exchange and equilibration between the peripheral compartments and the CNS (34, 35). However, little is known about the distribution properties of caffeine across the human BBB. Whether individuals with impaired ABCG2 function have higher or longer CNS exposure to caffeine and thus a lower caffeine dose requirement for neural effects merits further study. rs1260326 is a nonsynonymous and functional SNP in GCKR that has previously been associated with over 25 other metabolic traits (36). GCKR is expressed nearly exclusively in the liver and encodes glucokinase regulatory protein (GKRP). We previously postulated that GCKR variation may impact the glucose sensing process of the brain that, in turn, influences central pathways responding to coffee (11). Also, there are other candidate genes in this region that may also underlie the association (acting via LD). For example, in the frontal cortex, the rs1260326 SNP alters methylation of PPM1G; a putative regulatory target for Ahr and binding target for PPP1R1B, which mediates psychostimulant effects of caffeine (11, 37). To our knowledge, GKRP has no known role in caffeine or xenobiotic metabolism yet the results of the current study do not rule out the possibility. rs1260326 was strongly associated with 17X/137X and patterns of associations with caffeine metabolites and coffee drinking behavior were similar to those for AHR, CYP1A2 and POR (Table 2). Future larger studies are warranted to further disentangle the association of the GCKR locus with coffee intake and caffeine metabolism. Variants near 7q11.23, 11p13 and 17q11.2 map near genes including MLXIPL, BDNF and SLC6A4, respectively, with no known role in caffeine metabolism but possibly roles in response to caffeine psychostimulant effects. Although alleles at these loci linked to increased intake may have theoretically been associated with higher caffeine levels, no SNP-metabolite associations were observed in this study.
SNPs near AHR associated with higher coffee consumption were also associated with higher decaffeinated coffee consumption in the CCGC study (11). This finding was replicated in the current analysis of the UK Biobank, but similar patterns of associations also extended to variants near CYP1A2, ABCG2, MLXIPL and POR. These associations may be the result of Pavlovian conditioning among former regular coffee consumers or perhaps the small amounts of caffeine in decaffeinated coffee (1). These genetic factors may therefore be good markers of early or lifetime dietary caffeine exposure.
This study adds further support to the hypothesis that individuals adjust their dietary caffeine consumption to maintain biological exposure levels of caffeine that elicit optimal stimulant effects. Slow caffeine metabolism or elevated neural exposure may lower the caffeine-dose response and thus the amount of caffeine consumed. Although this innate self-regulation of dietary caffeine intake may be beneficial, the effects of other non-caffeine constituents correlated with dietary caffeine as well as the broader peripheral effects of caffeine may not be subject to the same regulation and thus accounting for genetic variants identified in this study may improve efforts to understand the role of dietary caffeine in health. Moreover, all loci identified in the current study encode clinically important proteins that contribute to the metabolism of a wide variety of pharmaceutical drugs and endogenous compounds, and the metabolic activation of some procarcinogens (6, 38). Specific variants identified thus have important significance that extends beyond caffeine metabolism. Major limitations of this study are the cross-sectional nature of sample collection and non-uniform availability of information on factors known to alter caffeine metabolism. SNP effect sizes are therefore imprecise and deter further efforts to characterize potential higher order interactions in the current sample. Complementary clinical pharmacokinetic studies are thus warranted and this study represents an efficient first step that will narrow these more detailed efforts to SNPs with potential clinical significance.
Materials and Methods
Study samples
Studies contributing to the GWAS of caffeine metabolites have been described in detail previously and included the Prospective Study of the Vasculature in Uppsala Seniors (PIVUS) (39), the Study of Health in Pomerania TREND (SHIP-TREND) (40), the Swiss Kidney Project on Genes in Hypertension (SKIPOGH) (41), TwinGene (42), TwinsUK (43) and the Uppsala Longitudinal Study of Adult Men (ULSAM) (44). Study samples for the current research included adults or elderly who provided a fasting blood sample (details in Supplementary Materials and Methods and Supplementary Material, Table S2). Each study protocol was approved by its corresponding institutional review board. All participants provided verbal or written informed consent regarding use of their data and blood specimens for analysis.
Measurement of metabolites
Plasma 137X, 17X, 13X, 37X and 137U were measured as part of large-scale metabolite profiling projects independently initiated by each study. Sample processing, metabolite data acquisition and pre-processing have been published in detail elsewhere and is summarized in Supplementary Material, Table S2. Briefly, metabolite profiling was performed using UPLC-MS/MS (ULSAM, PIVUS, TwinGene, SKIPOGH) or UPLC-ESI-MS/MS (SHIP-TREND and TwinsUK). Technical, water, and spiked-standard controls were analyzed in parallel with study samples. For each metabolite examined in this study, samples with values of 0 were excluded as were data points more than 4 standard deviations from the median concentration. Each study applied a different method for normalizing the distribution of the metabolites and 17X/137X (Supplementary Material, Table S2). To facilitate meta-analysis all data were rescaled to have a mean of 0 and SD of 1 prior to study-specific GW analysis.
Plasma QN, Trig and additional caffeine metabolites addressed in follow-up analysis were measured in TwinsUK or SHIP-TREND. Urine measures of eight caffeine-related metabolites were available in SHIP-TREND and four of these were also available in SKIPOGH. Urine metabolites were measured by the same methods used for plasma measures but with modification to sample preparation and pre-processing (Supplementary Material, Table S2 and S3). Data were normalized and standardized as described above for plasma metabolites and 17X/137X prior to study-specific GW analysis.
Genotyping, quality control and imputation
DNA was extracted from blood samples using conventional methods. Details of the genotyping process and QC for each study population have been described previously and also detailed in Supplementary Material, Table S2. Briefly, genotyping for PIVUS, SHIP-TREND, TwinGene, TwinsUK and ULSAM was completed using various Illumina GWAS arrays while SKIPOGH samples were genotyped on the Illumina Metabochip array. At a minimum, DNA samples that did not meet a 90% completion threshold, and SNPs with low call rates (<95%) and Hardy-Weinberg P < 1 × 10⁻⁵ were dropped. EIGENSTRAT (45) or PLINK (46), along with HapMap II or III reference populations, were used to carry-out ancestry analyses and any putative non-European samples were excluded from subsequent analyses. With the exception of SKIPOGH (not imputed), each study used Minimac (47) or IMPUTE (48) to impute ∼31 million SNPs and indels based on the 1000G v3 ALL reference panel (49). Imputation results are summarized as an ‘allele dosage’ (a fractional value between 0 and 2), defined as the expected number of copies of a specified allele at that SNP.
UK Biobank
To complement previously published GWAS of coffee intake behavior (see below), we performed new candidate SNP association studies of coffee intake behavior in the UK Biobank, which recruited 502 650 participants aged 37–73 years at 21 centers across England, Wales and Scotland in 2006–2010 (50). Data on usual coffee consumption and other health and lifestyle factors were collected by a touchscreen questionnaire that all participants filled out at baseline (51). Total coffee intake was based on the question: ‘How many cups of coffee do you drink each day (include decaffeinated coffee)?’ A similar question was asked about tea. Response units were <1 cup/d or exact cups/day. A separate question about usual type of coffee (decaffeinated, instant, ground, other, unknown) was also asked. Thus far, ∼150 000 participants have been genotyped using the Affymetrix UK BiLEVE Axiom array and Affymetrix UK Biobank Axiom array and imputed to a merged dataset consisting of the UK10K haplotype and 1000G phase 3 reference panels as described previously in (52, 53).
Statistical analysis
Genome-wide association studies. Each study performed GWA-testing for each metabolite or ratio across up to ∼31 million SNPs and indels, based on linear regression under an additive genetic model. Analyses were adjusted for smoking status and, when applicable, age, sex, study-site, fasting status, family structure and/or study-specific principal components of population substructure (Supplementary Material, Table S2).
Prior to meta-analysis, we removed SNPs with a minor allele frequency <0.01 or imputation quality information score <0.4. Fixed effects meta-analyses were performed with METAL (54) using p-values and effective sample size for each study. The software also calculates the genomic control (λ) value for each study and then adjusts each study's results using the corresponding λ value. Supplementary Material, Table S2 provides metabolite- and study-specific summaries pertaining to number of SNPs contributing to the meta-analysis and λ values. Only SNP-metabolite associations based on data from at least two studies were used to generate Manhattan, quantile-quantile and regional association plots, and for pathway and gene-based analysis. Genome-wide significance was defined as the traditional P-value threshold of P < 5 × 10⁻⁸. This threshold was not corrected for multiple traits, since metabolites were significantly correlated (12) and as expected given a common group of CYP450 isoforms is involved in their metabolism (Fig. 1). The same statistical models were applied to tests of (i) indel-metabolite associations (candidate genomic regions only); and (ii) follow-up analysis of plasma and urine metabolites (candidate index SNPs only).
Pathway and candidate gene-based analysis. Summary statistics of GWAS yielding GW-significant loci (i.e. 137X, 17X, 13X and 17X/137X) were also subject to pathway and candidate gene-based analyses using MAGENTA (55) and VEGAS (56), respectively. The former uses gene-based testing as a means to pathway enrichment analysis, while VEGAS was implemented as a robust validation of the primary findings. Candidate genes included those encoding CYP1A2-regulating proteins (14), enzymes involved in caffeine metabolism based on existing knowledge (Fig. 1), and members of significant pathways (MAGENTA, FDR > 0.05). Gene-based threshold for significance was defined using a Bonferonni correction for multiple testing (i.e. number of genes tested).
Potential SNP function. All confirmed index SNPs and their correlated proxies (r2 > 0.8) were systematically mined for putative causal variants, eQTLs, cell types, regulators and target genes using publicly available resources; a process facilitated by Haploreg v4 (57). The latter was also used for enhancer enrichment analysis using the 15-state ChromHMM core model, H3K4me1 peaks and H3K27ac peaks (57). The overlap with enhancers in each cell type was compared with two background models to assess enrichment: all 1000 Genomes variants with a frequency above 5% in any population and all independent GWAS catalog SNPs. The enrichment relative to these background frequencies was performed using a binomial test and uncorrected P-values were reported.
Overlap of loci for caffeine metabolites and coffee consumption behavior. Metabolite associations with SNPs previously associated with coffee consumption in the Coffee and Caffeine Genetics Consortium (CCGC) GWAS (11) were also detected in the current study. Since the CCGC GWAS was based on HapMap II, the complementary look-up (i.e. SNPs associated with metabolites) was incomplete. Therefore, de novo candidate SNP analysis of the UK Biobank cohort was performed following the same linear regression models used in the GWAS of coffee intake (cups/d among coffee drinkers). Age, sex, genotype array, smoking status and 10 principal components were included in the regression model and was restricted to unrelated individuals of European Ancestry with high quality genetic data (n = 94 343) following guidelines provided by the UK Biobank Coordinating Centre (58).
Supplementary Material
Supplementary Material is available at HMG online.
Acknowledgements
We thank everyone who has contributed to the data collection, genotyping and analysis of the individual cohorts, as well as all the study participants. We especially thank Dr Werner Römisch-Margl who contributed to SHIP sample preparation. This research has been conducted using the UK Biobank Resource. Summary-level and UK Biobank computations in this paper were run on the Quest cluster supported in part through the computational resources and staff contributions provided for the Quest high performance computing facility at Northwestern University, which is jointly supported by the Office of the Provost, the Office for Research, and Northwestern University Information Technology. Full sets of summary association statistics are available at https://digitalhub.northwestern.edu/users/mcc340.
Conflicts of Interest statement. None declared.
Funding
This work was funded by the American Diabetes Association (7-13-JF-15 to M.C.C.) with additional funding for study-specific infrastructure and data collection. SHIP-TREND is part of the Community Medicine Research net of the University of Greifswald, Germany, which is funded by the Federal Ministry of Education and Research (BMBF, grants no. 01ZZ9603, 01ZZ0103 and 01ZZ0403), the Ministry of Cultural Affairs and the Social Ministry of the Federal State of Mecklenburg-West Pomerania. Generation of genome-wide data for SHIP-TREND was also supported by the BMBF (grant no. 03ZIK012). SKIPOGH is funded by the Swiss National Science Foundation (FN33CM30-124087). K.S. is supported by ‘Biomedical Research Program’ funds at Weill Cornell Medicine in Qatar, a program funded by the Qatar Foundation.
References
The SKIPOGH team
Murielle Bochud6, Michel Burnier27, Olivier Devuyst28, Pierre-Yves Martin29, Markus Mohaupt30, Fred Paccaud6, Antoinette Pechere-Bertschi31, Bruno Vogt30, Daniel Ackermann30, Georg Ehret12,13, Idris Guessous6,14, Belen Ponte29 and Menno Pruijm27
27Department of Nephrology, Lausanne University Hospital, Lausanne, Switzerland, 28Institute of Physiology, Zurich Center for Integrative Human Physiology, University of Zurich, Zurich, Switzerland, 29Department of Nephrology, Geneva University Hospitals, Geneva, Switzerland, 30Department of Nephrology, Hypertension and Clinical Pharmacology, Inselspital, University Hospital and University of Bern, Bern, Switzerland and 31Hypertension Unit, Geneva University Hospitals, Geneva, Switzerland.
