


Abstract
Autoantibody profiling has gained increasing interest in the research field of glaucoma promising the detection of highly specific and sensitive marker candidates for future diagnostic purposes. Recent studies demonstrated that immune responses are characterized by the expression of congruent or similar complementarity determining regions (CDR) in different individuals and could be used as molecular targets in biomarker discovery. Main objective of this study was to characterize glaucoma-specific peptides from the variable region of sera-derived immunoglobulins using liquid chromatography-—mass spectrometry (LC-MS)—based quantitative proteomics. IgG was purified from sera of 13 primary open-angle glaucoma patients (POAG) and 15 controls (CTRL) and subsequently digested into Fab and Fc by papain. Fab was further purified, tryptic digested and measured by LC–MS/MS. Discovery proteomics revealed in total 75 peptides of the variable IgG domain showing significant glaucoma-related level changes (P < 0.05; log2 fold change ≥ 0.5): 6 peptides were high abundant in POAG sera, whereas 69 peptides were low abundant in comparison to CTRL group. Via accurate inclusion mass screening strategy 28 IgG V domain peptides were further validated showing significantly decreased expression levels in POAG sera. Amongst others 5 CDR1, 2 CDR2 and 1 CDR3 sequences. In addition, we observed significant shifts in the variable heavy chain family distribution and disturbed κ/λ ratios in POAG patients in contrast to CTRL. These findings strongly indicate that glaucoma is accompanied by systemic effects on antibody production and B cell maturation possibly offering new prospects for future diagnostic or therapy purposes.
Introduction
Glaucoma is a chronic neurodegenerative disease characterized by a progressive loss of retinal ganglion cells (RGC) and their axons, leading to optic nerve damage and gradual loss of the visual field (1). It is one of the primary causes of blindness worldwide and around 80 million people will be suffering from glaucoma by 2020 (2). Primary-open angle glaucoma (POAG), the most common form of glaucoma, is associated with an elevated intraocular pressure (IOP) which represents the major risk for developing this eye disease (1). Nevertheless, around 30% of the glaucoma patients never develop an elevated intraocular pressure, which then is defined as normal tension glaucoma (NTG) (3). Although the pathomechanism of glaucoma is still poorly understood, many other risk factors are involved such as advanced age (4), reduced ocular blood flow (5), apoptotic processes (6), genetic predisposition (7,8) and increased glutamate or nitric oxide levels (9). In the last decade a multitude of studies demonstrated that autoimmunity plays an essential role in the pathogenesis of glaucoma and altered autoantibody profiles were observed in sera and aqueous humor of glaucoma patients (10,11). Many autoantibodies (AAB) against ocular and optic nerve antigens have been identified so far such as heat shock proteins (12), gluthathione S-transferase (13), alpha fodrin (14), glycosaminoglycans (15), gamma enolase (16) and myelin basic protein (17). However, the exact participation of AAB in the pathogenesis of glaucoma is not well understood and literature concerning the effects of autoimmunity is ambiguous. Tezel et al. (2000) (18) observed that anti-HSP27, up-regulated in glaucoma patients, promotes apoptotic cell death in vitro and may act as proinflammatory molecule. On the other hand, our group already showed that down-regulated AAB against gamma-synuclein, 14-3-3 and glial fibrillary acidic protein (GFAP) have an anti-apoptotic effect on stressed RGCs as well as retinal explants and are hypothesized to function as protective components of the immune system (19–22). In general, human immunoglobulins G (IgG) consist of two identical heavy chains and two identical light chains. Each light chain contains a variable (VL) and a constant domain (CL: κ or λ chain), whereas the heavy chain is composed of one variable domain (VH) and three different constant regions (CH1, CH2 and CH3). The variable part along with the first constant region forms the antigen-binding fragment (Fab) and the other three constant parts represent the crystallisable fragment (Fc) (23). Furthermore, the variable parts are subdivided into six hypervariable sequences called complementarity-determining regions (CDR) surrounded by relatively constant sequences termed framework regions (FR) (24). The CDR sequences determine the antigen specificity of the antibody and particular the highly diverse CDR3 of the VH domain plays a key role in the antigen recognition process (25). It is estimated that the diversity of antibodies is between 1011 and 1058 triggered by somatic recombination and hypermutations and makes it highly unlikely to find identically mutated CDR sequences among different individuals (23,26,27). Regardless to this widespread immunological concept, other research groups already demonstrated the successful identification of overlapping or similar CDR sequences in unrelated HIV as well as leukemia patients and disproved that B cell maturation (antibody production) is not a fully random process (28,29). VanDuijn et al. (2010) (30) provided further evidence that the immunization of individual rats with selected antigens leads to the expression of congruent CDR sequence phenotypes apparently driven by (auto-)antigenic pressures. Currently a research group introduced a novel proteomic approach for studying variable regions of immunoglobulins using liquid chromatography - mass spectrometry (LC-MS) without the requirement of previously known antigen panels (31,32). Employing this strategy they were able to identify disease-specific marker peptides of the variable IgG domain shared between lung cancer patients (33), multiple sclerosis patients (34) and paraneoplastic syndrome patients (35). All previous studies exploring the complex AAB profiles in glaucoma were based on conventional techniques such as microarray or western blot analysis, a targeted analysis of the antibody structures itself is still missing. For this reason, the main objective of this study was to identify peptides of the variable IgG domain, particular CDRs, shared between POAG patients in comparison to healthy subjects. Schematic Workflow of the sample preparation protocol is illustrated in Figure 1.
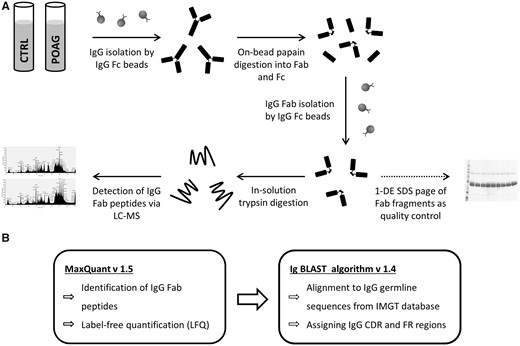
Schematic Workflow of Fab (antigen-binding fragment) purification steps, LC-MS/MS measurements and the data analysis. (A) IgG was purified from individual sera samples (100 µl) from 13 patients diagnosed with primary open-angle glaucoma (POAG) and 15 controls using Capture SelectTM IgG-Fc (crystallisable fragment) resin beads. IgG were digested into Fab and Fc by immobilized papain resin beads followed by further purification of Fab via Capture SelectTM IgG-Fc resin beads. 1-D SDS PAGE of flow-through fraction was performed to evaluate if the Fab purification steps were successful. In-solution trypsin digestion of Fab fragments (20 µg) was performed and measured on a HPLC-coupled LTQ Orbitrap XL mass spectrometry system. (B) Peptide identification and label-free quantification (LFQ) was performed employing bioinformatical tool MaxQuant v. 1.5 against human NCBI database (955.083 sequences). IgBLAST algorithm v. 1.4 was used to align identified peptides to V, J and C germline sequences derived from IMGT database (ImMunoGeneTics information system). Due to the identified peptides were assigned to the complementarity determining regions (CDR), framework regions (FR) or constant regions (C) of the IgG framework based on an alignment match score ≥ 70%. The sample preparation protocol was published first by de Costa et al. (31,33).
Results
Discovery proteomics of glaucoma-related IgG Fab peptides
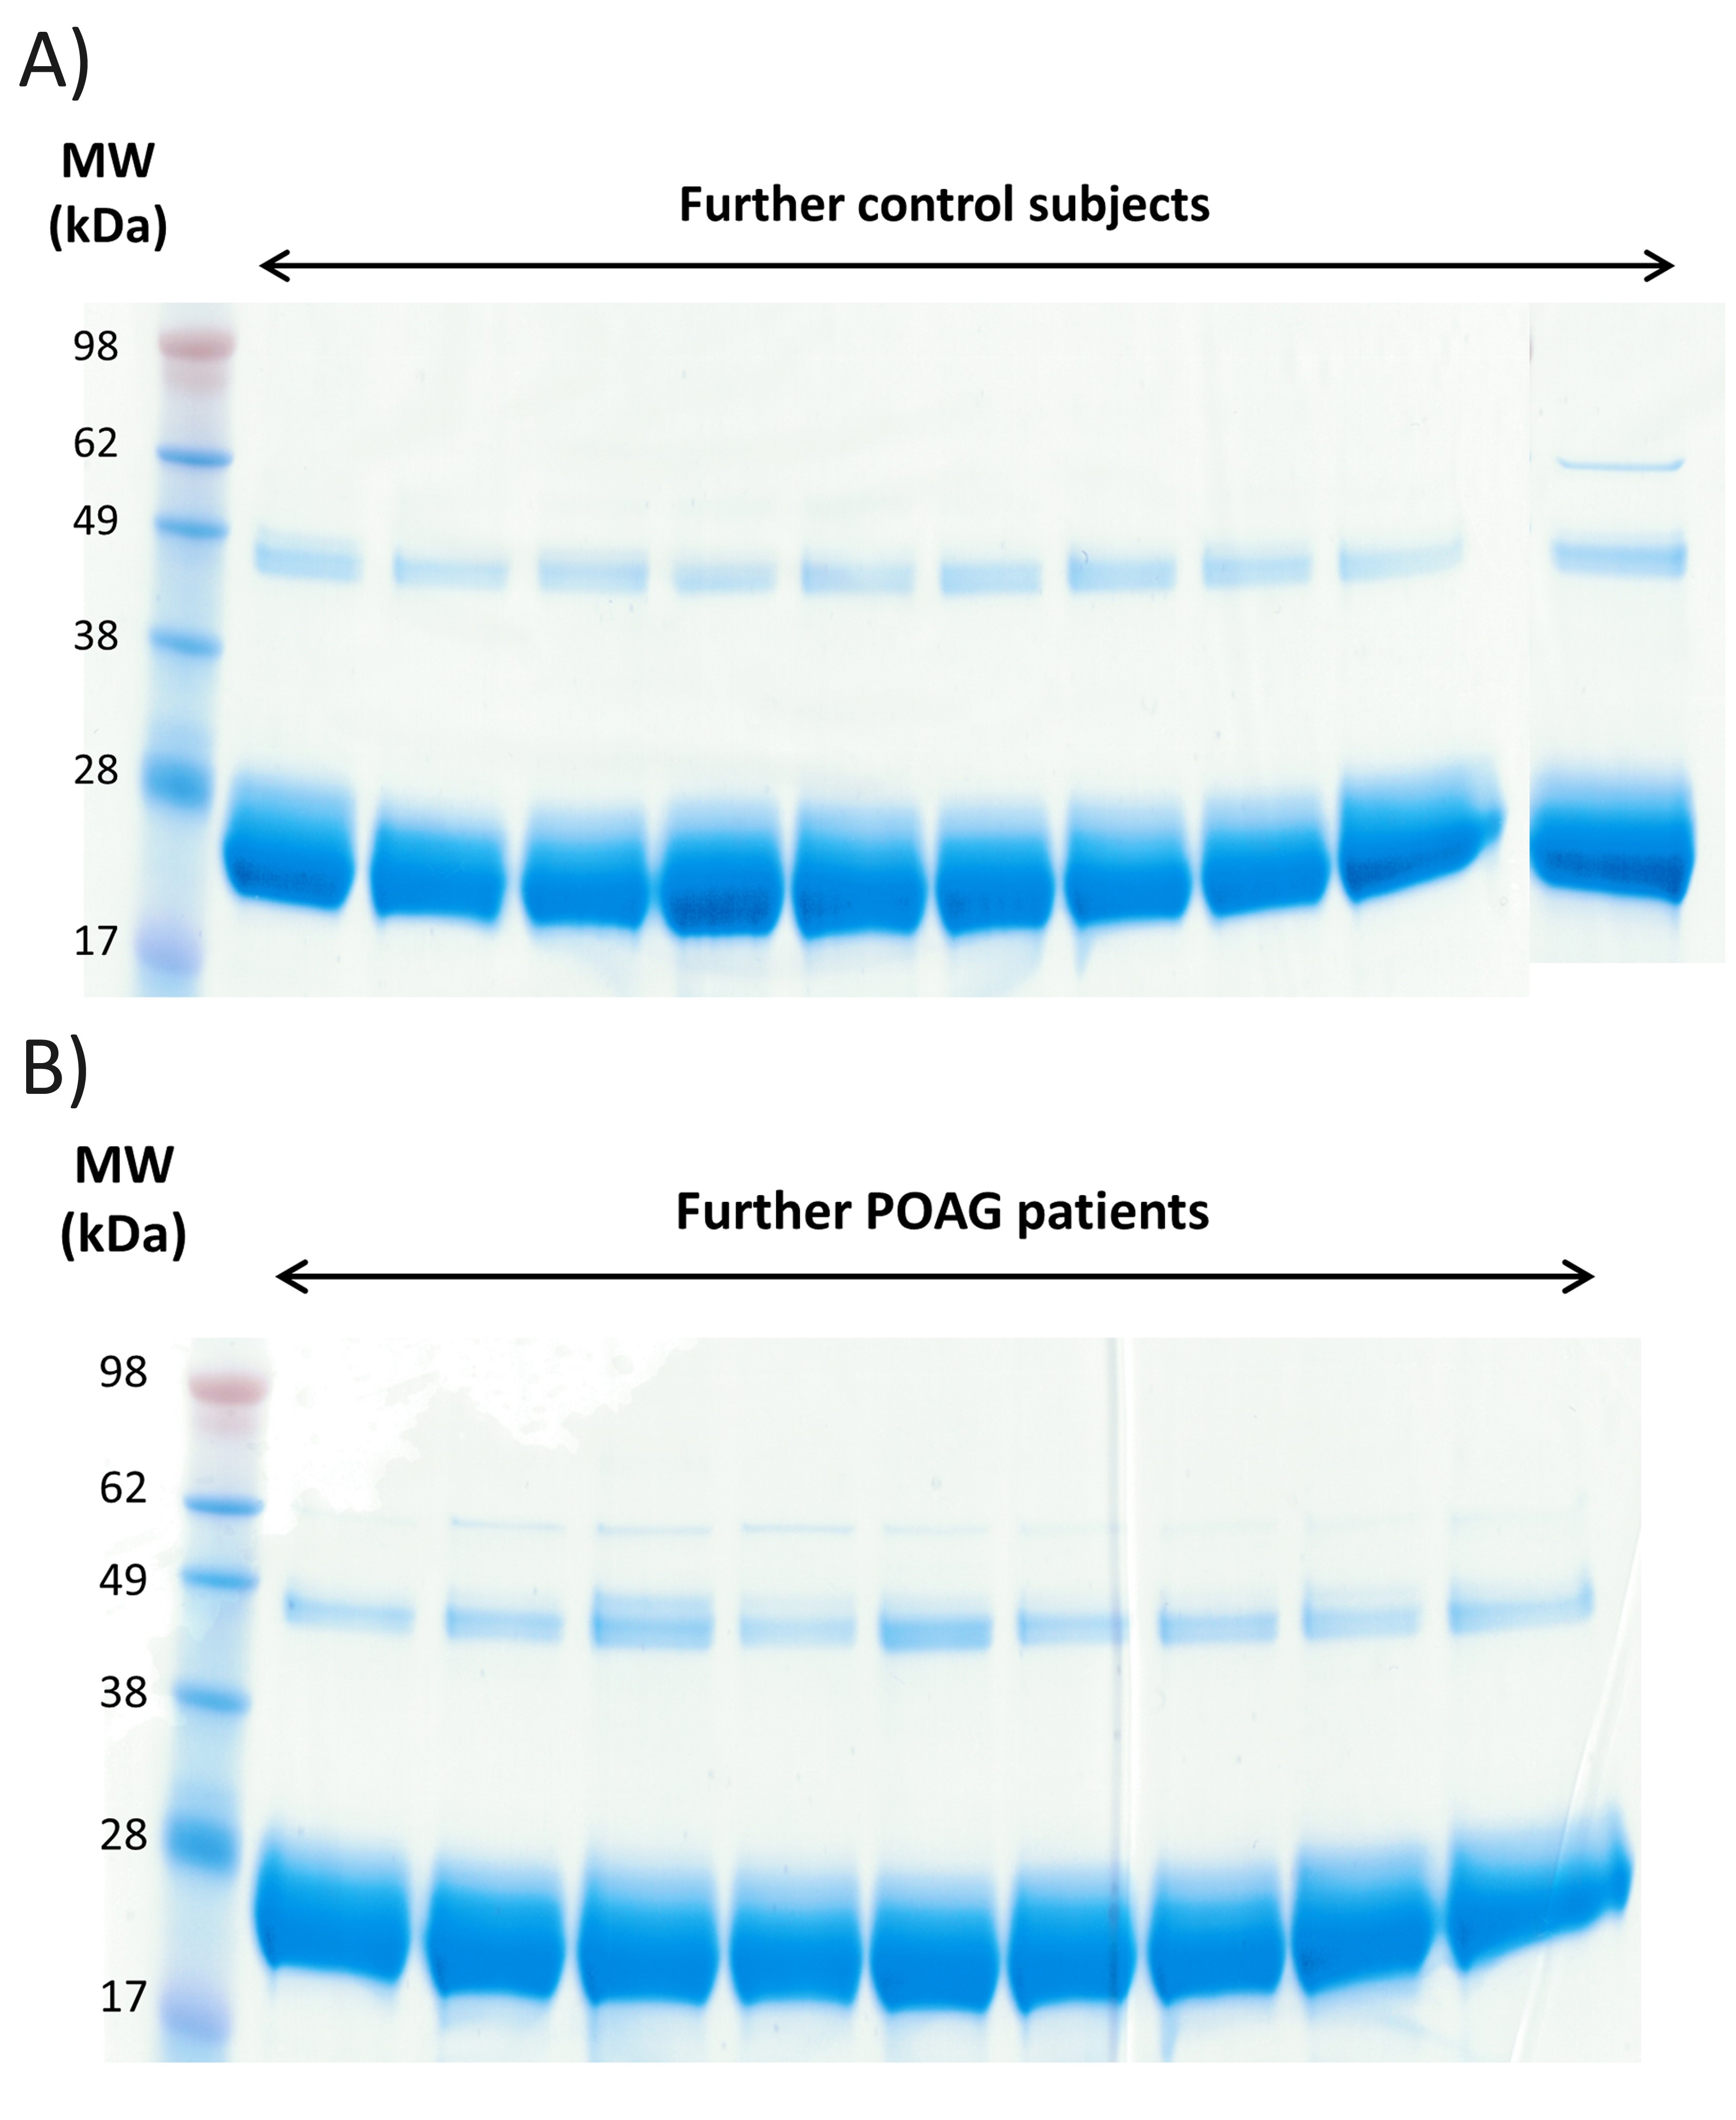
Fab isolation of individual sera samples was confirmed by 1-D SDS PAGE for all CTRL and POAG subjects (Fig. 2 and Supplementary Material, Fig. S1A and B). The protein bands around 28 kDa show the Fab fragments, the protein bands around 49 kDa represent non-reduced F(ab')2 fragments and the protein bands around 62 kDa contain traces of albumin. Protein identifications were determined by MS and were in accordance with literature (31). Protein pattern of all subjects showed a high degree of congruency and densitometric analysis of Fab protein spots provided an average area of 57 275 ± 7594 dpi (Supplementary Material, Fig. S2 and Table S1). As only very low contamination was detectable we decided to perform an In-solution trypsin digestion for further LC-MS analysis. In total 3752 peptides were identified in CTRL and POAG group with FDR < 1% (Supplementary file 1). The identified peptides were aligned to V-, J- and C- germline sequences derived from the IMGT database using NCBI IgBLAST algorithm. The best-matching IMGT database hit was selected for further analysis and an alignment match score of 70% was set as cutoff value. In that way, 3287 peptides were assigned to the V region, 183 peptides to the J region and 117 peptides to the C region of the IgG framework. Within the VH domain, 227 peptides were annotated as CDR1, 309 as CDR2 and 41 as CDR3. In contrast, within the VL domain it was possible to identify 425 peptides as CDR1, 489 as CDR2 and 59 as CDR3 (Supplementary Material, S1). Nevertheless, around 4% of the identified peptides showed to less similarity to IMGT germline sequences and were therefore excluded from the analysis.
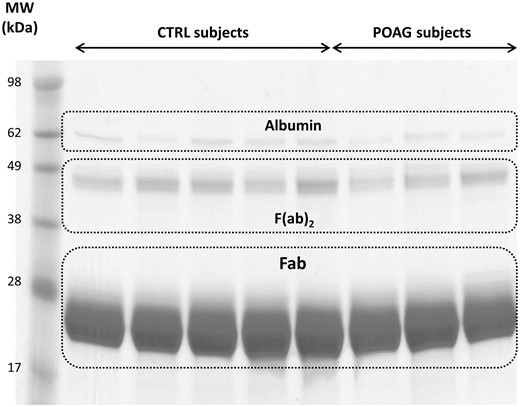
Exemplary 1-D SDS PAGE of the purified Fab fragments from 5 controls subjects and 4 POAG patients. The protein bands around 28 kDa represent the purified Fab fragments. Protein bands around 49 kDa show non-reduced F(ab)2 fragments and protein bands around 62 kDa contain traces of albumin. Each sample lane contains a total protein amount of 20 µg.
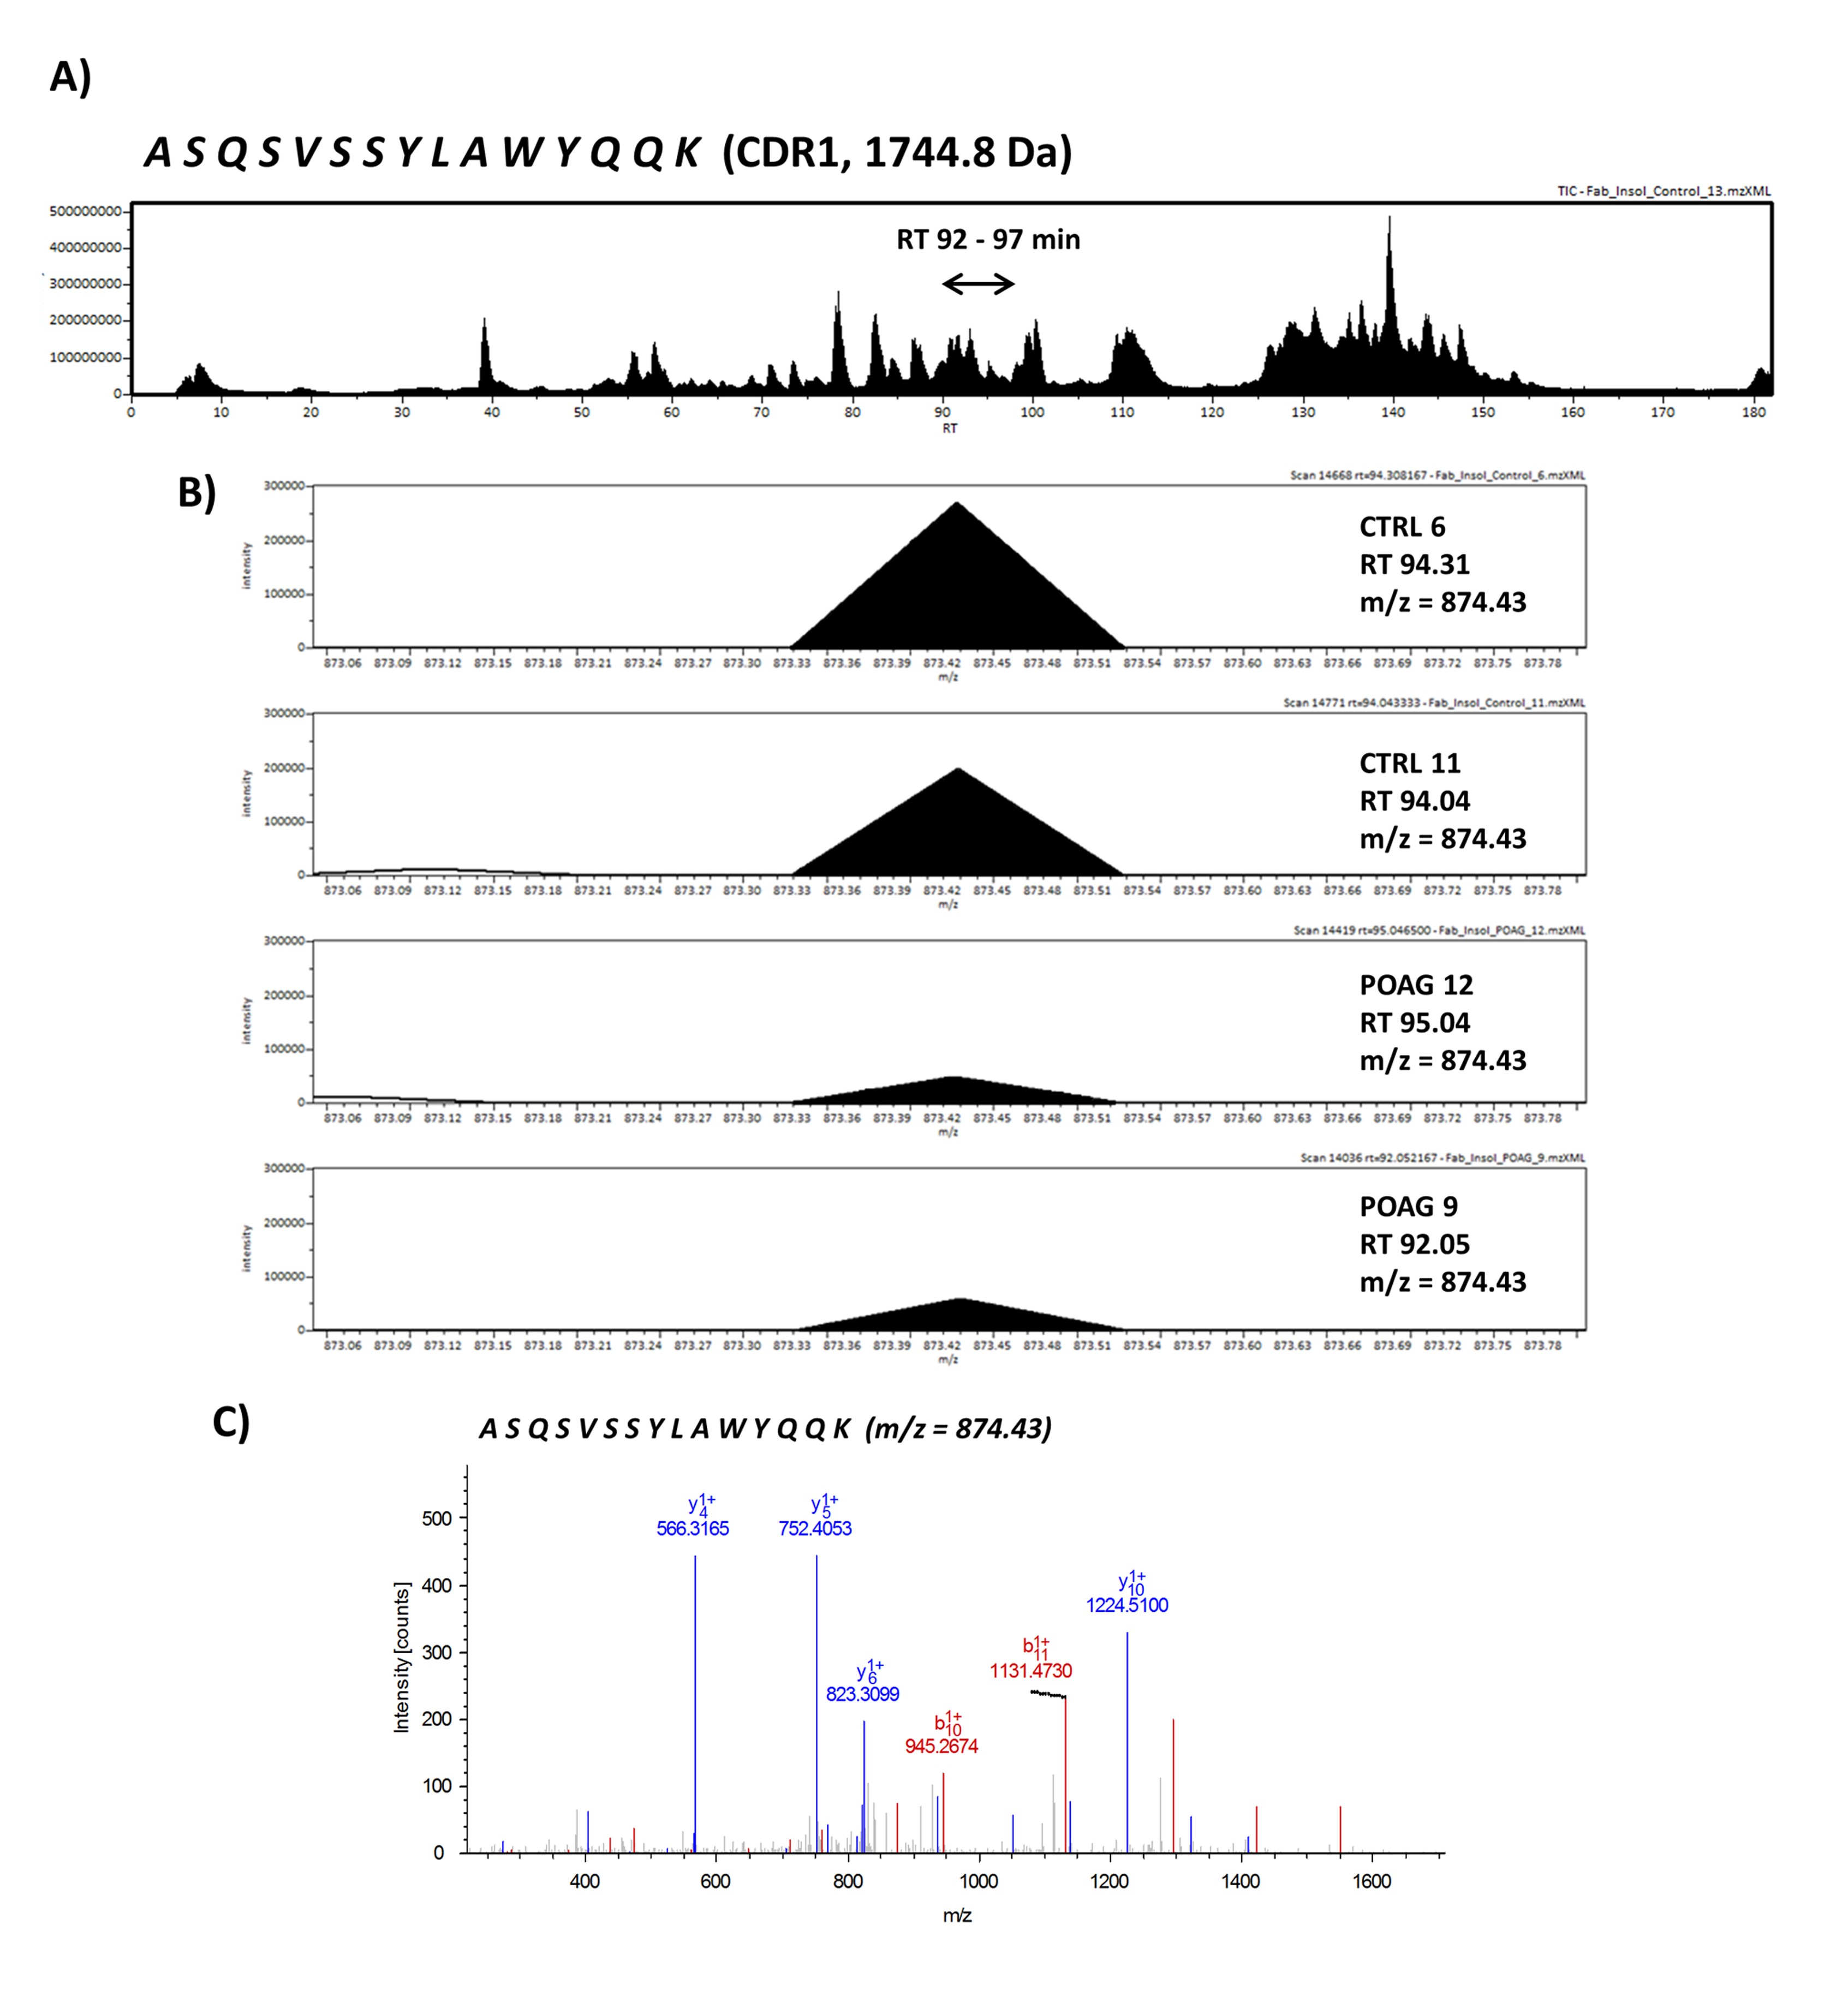
Next, we were interested in peptides of the variable IgG domain, particular CDR sequences, which were significant differently distributed between POAG and CTRL group. In total 393 IgG V domain peptides were at least detectable in one of the study groups (15 CTRL or 13 POAG subjects) and selected for further analysis. As only 3% of the total data matrix was missing we decided to replace the values by their respective means assuming that these peptides were close to the limit of detection (36). Regarding label-free quantification (LFQ) statistics, 124 of the IgG V domain peptides showed a significant level change between both study groups using two-sided t-test (P < 0.05) (supplementary file 2). To determine the most meaningful changes and to avoid false-positive identifications a Volcano plot (Fig. 3) was performed. The data-set was filtered at a significance level of p value < 0.05 and log2 fold change ≥ 0.5 revealing 75 differently distributed IgG V domain peptides between both study groups: 6 of these peptides (filled squares) were high abundant in the POAG group in comparison to CTRL, whereas the abundances of 69 peptides (open triangles) were decreased (Supplementary Material, Table S2). Most peptides were annotated as framework regions (18 FR1, 10 FR2, 22 FR3 and 3 FR4) and the remaining peptides as complementarity determining regions (9 CDR1, 7 CDR2 and 6 CDR3). Exemplary box plots of differentially distributed IgG V domain peptides are shown in Figure 4. As further confirmation, we manually examined the raw LC-MS data files of a random set of CTRL subjects and POAG patients and found that the intensity of monoisotopic precursor ion 669.84 m/z, representing the peptide sequence NSLYLQMNSLR (FR3), was observably higher in the CTRL group in contrast to POAG (Fig. 5). Manual inspection was also performed for peptide sequence ASQSVSSYLAWYQQK (CDR1) as shown in Supplementary Material, Figure S3. Moreover, based on the abundances of the 75 glaucoma-related IgG V domain peptides a principal component analysis (PCA) was performed. Figure 6 represents the score plot of the first two PCs explaining more than 55.5% of the total variance in the data. Healthy individuals are represented by open dots and POAG subjects are indicated by filled triangles. The first two PC allow effective separation of all individuals into CTRL and POAG group without any overlap. POAG subjects laid on average at positive scores at PC 1 (Ø PC1 score 4.43), whereas CTRL subjects were clustered on average at negative values on the same PC (Ø PC1 score -4.08).
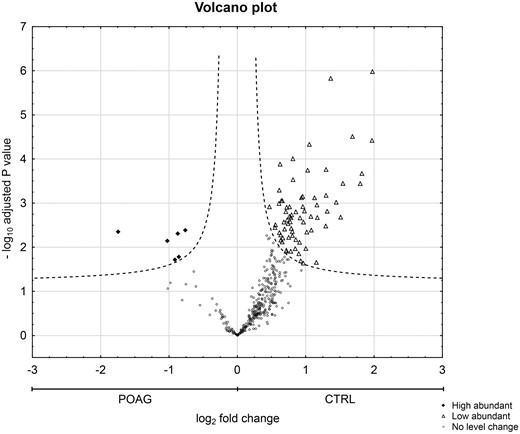
Statistical analysis of IgG V domain peptides between CTRL and POAG group detected in the discovery study. Volcano plot showing log2 fold change plotted against -log10 adjusted P value for samples from CTRL subjects versus samples from POAG patients. Filled squares represent 6 significant high abundant peptides and open triangles display 69 significant low abundant peptides in POAG patients in comparison to CTRL (P < 0.05, log2 fold change ≥ 0.5).
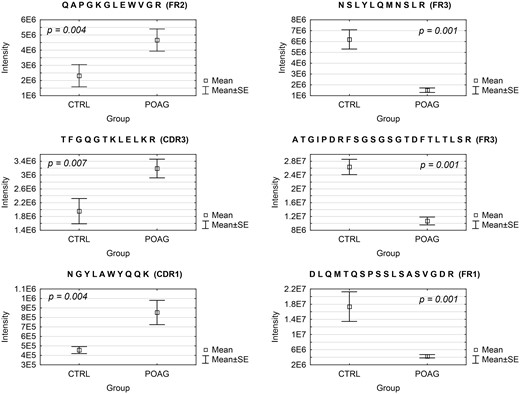
Exemplary IgG V domain peptides sequences showing significant differences in the expression level between POAG patients (N = 13) and CTRL group (N = 15). Peptides on the right were high abundant in the POAG group and peptides on the left were low abundant in POAG patients. Peptide abundances were revealed by LC-MS followed by label-free quantification and statistical analysis (P < 0.05; log2 fold change ≥ 0.5).
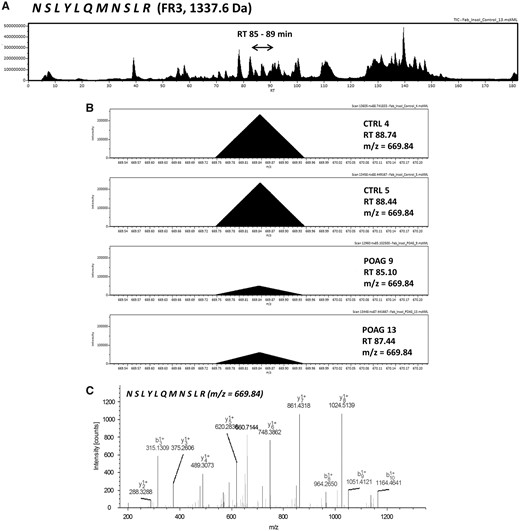
(A) Exemplary LC-MS total ion current chromatogram (TIC) displaying the exemplary identification of IgG V domain peptide sequence NSLYLQMNSLR annotated as framework region 3 (FR3). The peptide sequence eluted around RT 85-89 min within a 180 min HPLC gradient. (B) MS-spectra showing the monoisotopic precursor ion (m/z = 669.84) in a random set of CTRL subjects and POAG patients. Intensity of the precursor ion is observably larger in the CTRL group in contrast to POAG. (C) Tandem MS spectra of the precursor ion (m/z = 669.84) representing the peptide sequence NSLYLQMNSLR.
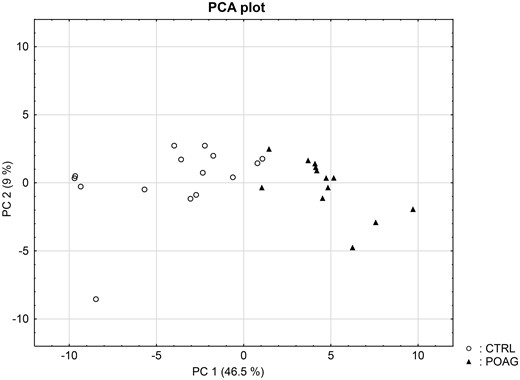
Principal component analysis (PCA) score plot for the 28 subjects. Clustering of the subjects was based on the abundances of the 75 significant differently expressed IgG V domain peptides. The cumulative proportions of PC1 and PC2 were 46.5% and 9%. The closer the data points in the figure the more similar are the individuals to each other. PCA plot provides a clear separation of CTRL (open dots) and POAG (filled triangles) group without any overlap.
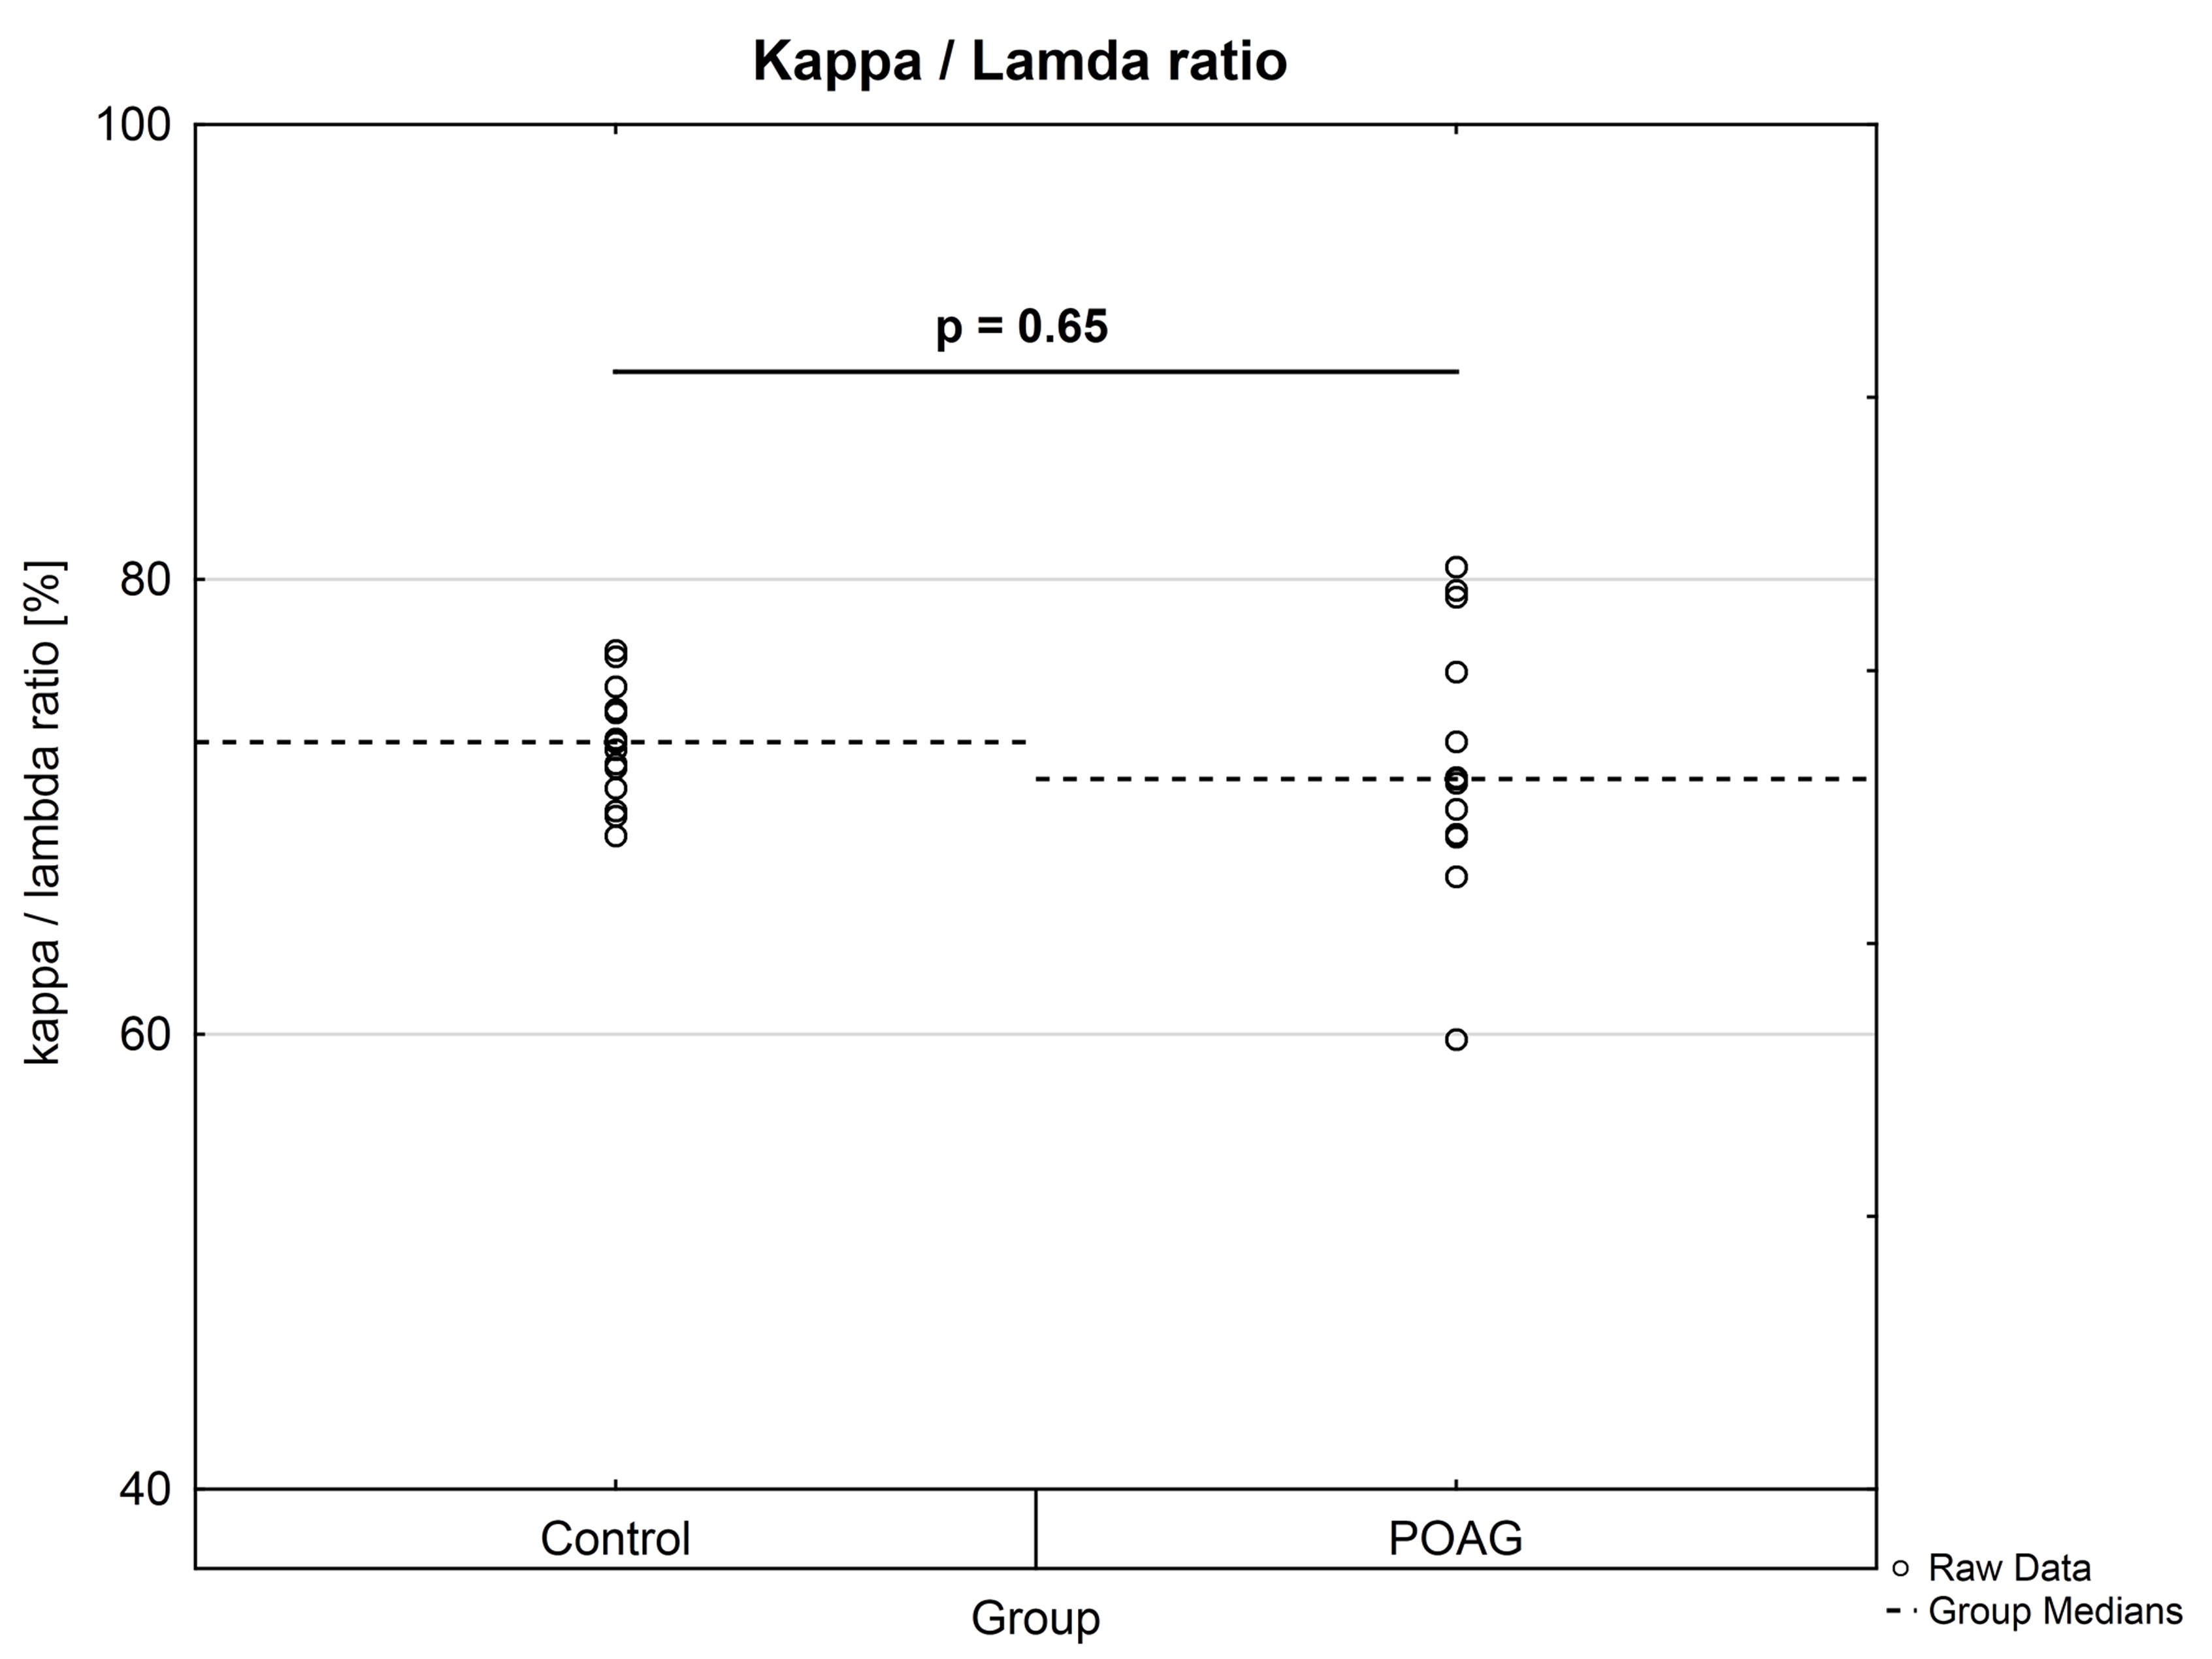
Peptides derived from the constant region of the IgG heavy chain were equally distributed between CTRL and POAG group (data not shown). In addition, κ/λ ratios were calculated for both groups using representative peptides from the constant region (κ chain: n = 17; λ chain: n = 12) of the IgG light chain. The κ/λ ratios of each individual were calculated as percentage distributions based on the peptide abundances. POAG group showed a higher statistical dispersion of κ/λ ratios in comparison to CTRL group, but no significant difference (P = 0.65) was observed between both groups (Supplementary Material, Fig. S4).
VH, VK and VΛ family distribution in CTRL and POAG group
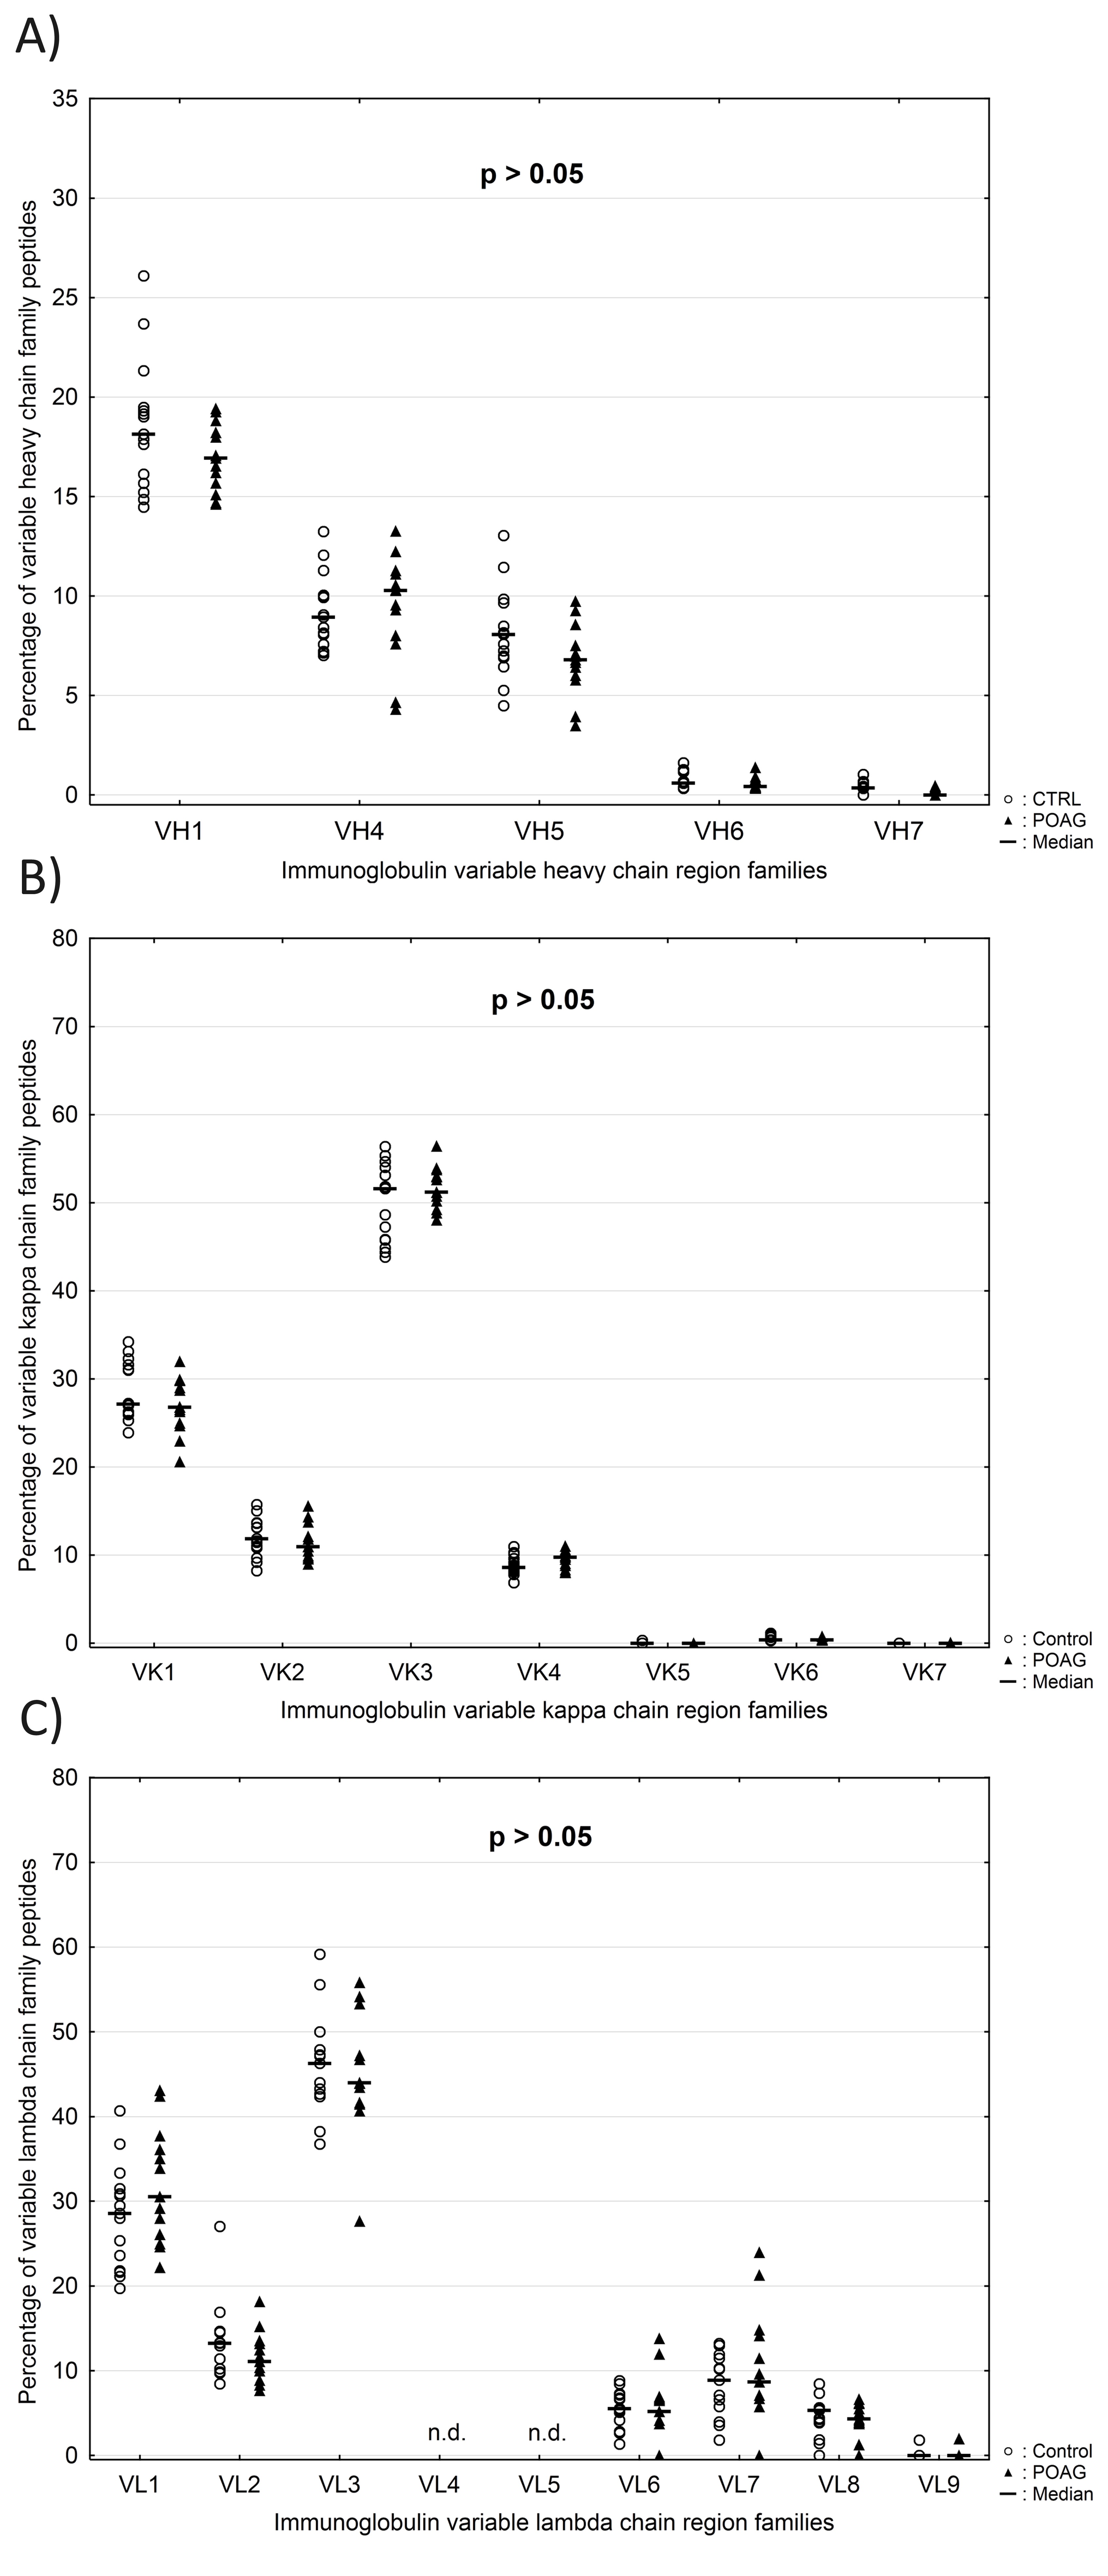
The variable genes of the heavy chain (VH) and the kappa chain (VK) are subdivided into seven families, while the variable genes of the lambda chain (VΛ) consist out of nine families. Family classification was based on sequence similarity according to previous publication (37). The family distributions of VH, VK and VΛ were calculated at the individual patient level and only peptide sequences validated by MS/MS identification were included in the analysis. Normalization of frequencies was performed using peptide counts of each family divided by the total number of identified peptides in a given chain family. The average family frequencies of VH, VK and VΛ were compared between both groups. Peptides used for Ig VH family distribution showed a mean alignment match score of 90 ± 6.9% and a mean average length of 14.3 ± 4.4 amino acids. Family VH3 (Fig. 7A) was significant increased in POAG patients compared to CTRL group (POAG: 65.3 ± 3.2% and CTRL: 62.1 ± 4.3%; P = 0.04). On the contrary, family VH2 (Fig. 7B) was slightly but significant decreased in the POAG group (POAG: 0.44 ± 0.26% and CTRL: 0.81 ± 0.43%; P = 0.01). The other five family members of VH did not show significant differences between both groups (P > 0.05) (Supplementary Material, Fig. S5A). Identified peptides used for Ig VK and VΛ family distribution showed mean alignment match scores of 91 ± 6.5%/91 ± 7.5% and mean average lengths of 15.3 ± 4.9/14.8 ± 5.2 amino acids. No significant differences in family distribution of VK and VΛ chains were observed between both groups (P > 0.05) (Supplementary Material, Fig. S5B and C).
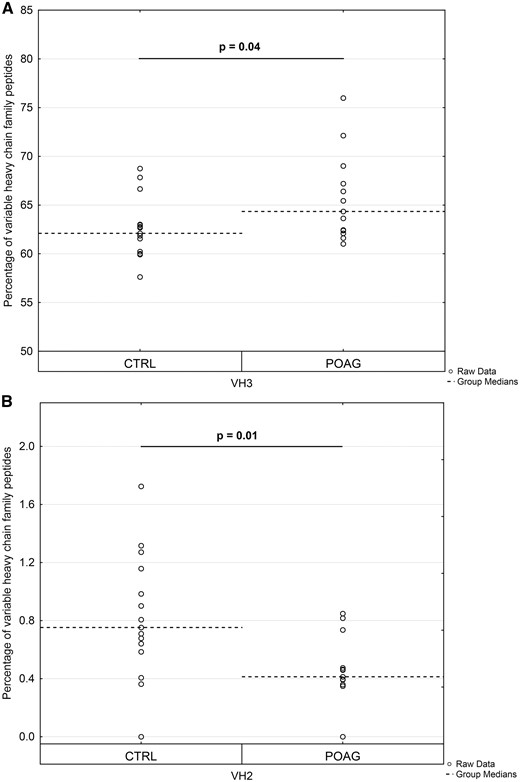
Expression profile of variable heavy chain (VH) family peptides in POAG patients in comparison to the CTRL group. Dashed horizontal lines represent median values. Peptide counts were normalized at the individual patient level and only peptide sequences validated by MS/MS identification were included in the analysis. Percentages of variable heavy chain family peptides are plotted along the y-axis. (A) Expression level of family VH3 was significantly increased in the POAG group (P = 0.04). (B) Family VH2 was significantly decreased in POAG patients relative to the CTRL group (P = 0.01).
Targeted proteomics via accurate inclusion mass screening
In order to validate the glaucoma-related IgG V domain peptides revealed by discovery proteomics a targeted MS strategy was performed. Accurate inclusion mass screening (AIMS) analysis revealed in total 83 peptides (FDR < 1%) occurring at least in one of the study groups (14 CTRL or 13 POAG subjects). Around 3% of the total data matrix were missing and replaced by their respective means as described before (36). Exactly 64 of the detected peptides were in accordance with the targeted peptide sequences (in total 124 targeted peptides) providing a detection rate of 52%. Up to 25 of the targeted peptides fulfilled the previously defined Volcano plot criteria (p value < 0.05 and log2 fold change ≥ 0.5) and showed a significant decrease in the POAG group in contrast to CTRL (see Table 1). AIMS analysis provided 3 further IgG V domain peptides which were significant decreased in the POAG group but not on the targeted inclusion list (see Table 1). These identifications resulted from peptides which have overlapping precursor masses with included peptides and were therefore selected for MS/MS identification. A validation of in glaucoma high abundant IgG V domain peptides was not feasible. Supplementary Material, Figure S6 and File S2 show the statistical analysis of the targeted MS data-set.
Information about 28 IgG V domain peptides validated by targeted MS
| CDR/FR | Sequence | Protein | m/z | Charge | Score | Length | Germline hit (gene name) | BLAST bit score | Homology (%) | Discovery study (P < 0.05; log2 fold change ≥ 0.5) | AIMS strategy (P < 0.05; log2 fold change ≥ 0.5) | P-value |
|---|---|---|---|---|---|---|---|---|---|---|---|---|
| CDR2 | ALIYLASTLQSGVPSR | gi|18025706 | 838.5 | 2 | 165.89 | 16 | IGKV1-27*01 | 30 | 93.3 | – | √ | 0.012 |
| CDR1 | ASGYTFTNYGLSWVR | gi|304562650 | 861, 4 | 2 | 230.57 | 15 | IGHV1-18*02 | 34.3 | 86.7 | – | √ | 0.007 |
| CDR1 | ASQSVSSNLAWYQQKPGQAPR | gi|284521128 | 1152.1 | 2 | 210.43 | 21 | IGKV3-15*01 | 47 | 100 | – | √ | 0.011 |
| CDR1 | ASQSVSSSLAWYQQKPGQAPR | gi|323432554 | 1138.6 | 2 | 166.67 | 21 | IGKV3-15*01 | 45.1 | 95.2 | √ | √ | 0.005 |
| CDR1 | ASQSVSSSYLAWYQQKPGQAPR | gi|149673891 | 1220.1 | 2 | 212.41 | 22 | IGKV3-20*02 | 48.9 | 100 | √ | √ | 0.001 |
| CDR1 | ASQSVSSYLAWYQQK | gi|339272255 | 873.4 | 2 | 225.09 | 15 | IGKV3-11*01 | 34.3 | 100 | √ | √ | 0.001 |
| FR3 | ATGIPDRFSGSGSGTDFTLTLSR | gi|70797863 | 1172.1 | 2 | 178.07 | 23 | IGKV3-20*01 | 48.9 | 95.7 | √ | √ | 0.001 |
| FR1 | DLQMTQSPSSLSASVGDR | gi|327410291 | 939.9 | 2 | 293.13 | 18 | IGKV1-27*01 | 37 | 94.4 | √ | √ | 0.001 |
| FR1 | ELVLTQSPATLSLSPGER | gi|339272255 | 949.5 | 2 | 401.46 | 18 | IGKV3-20*02 | 37 | 94.4 | √ | √ | 0.001 |
| FR1 | ELVLTQSPGTLSLSPGER | gi|61970173 | 942.5 | 2 | 394.86 | 18 | IGKV3-20*01 | 37.7 | 94.4 | √ | √ | 0.022 |
| FR1 | EVQLVESGGGLVK | gi|662565320 | 657.9 | 2 | 233.59 | 13 | IGHV3-69-1*01 | 28.5 | 100 | n.d. | √ | 0.001 |
| FR1 | EVQLVQSGAEVKKPGESLK | gi|761232722 | 1013.6 | 2 | 266.39 | 19 | IGHV5-51*01 | 39.7 | 100 | – | √ | 0.001 |
| FR2 | GLEWVSYLSR | gi|371446921 | 605.3 | 2 | 141.1 | 10 | IGHV3-11*01 | 22.7 | 88.9 | – | √ | 0.006 |
| CDR2 | LLIYDASDR | gi|630869089 | 533.2 | 2 | 147.4 | 9 | IGKV3-11*01 | 19.6 | 88.9 | – | √ | 0.011 |
| FR1 | LVESGGGLVKPGGSLR | gi|323433102 | 763.4 | 2 | 154.81 | 16 | IGHV3-69-1*01 | 35.4 | 100 | √ | √ | 0.012 |
| FR1 | LVLTQSPGTLSLSPGER | gi|2599536 | 877.9 | 2 | 289.5 | 17 | IGKV3-20*01 | 35.8 | 94.1 | – | √ | 0.003 |
| FR2 | NDLGWYQQKPGK | gi|152149150 | 717.4 | 2 | 193.62 | 12 | IGKV1-17*01 | 32.7 | 100 | √ | √ | 0.001 |
| FR3 | NQFSLK | gi|284521128 | 368.7 | 2 | 133.47 | 6 | IGHV4-39*04 | 16.2 | 100 | √ | √ | 0.003 |
| FR3 | NSLYLQMNSLR | gi|209402818 | 669.8 | 2 | 303.71 | 11 | IGHV3-13*01 | 25.4 | 100 | √ | √ | 0.001 |
| FR1 | QLVQSGAEVK | gi|323430773 | 529.8 | 2 | 119.22 | 10 | IGHV1-69*03 | 22.3 | 100 | – | √ | 0.002 |
| FR1 | QVQLVESGAEVKKPGESLK | gi|674841854 | 1013.6 | 2 | 185.96 | 19 | IGHV5-51*01 | 37.4 | 89.5 | n.d. | √ | 0.001 |
| FR1 | QVELVESGGGLVK | gi|371446908 | 657.9 | 2 | 255.08 | 13 | IGHV3-11*01 | 27.3 | 92.3 | √ | √ | 0.001 |
| FR1 | QVELVESGGGLVKPGGSLR | gi|371446908 | 941.5 | 2 | 59.15 | 19 | IGHV3-11*01 | 39.7 | 94.7 | n.d. | √ | 0.004 |
| FR3 | SLSTAYLQWSSLK | gi|4097044 | 742.4 | 2 | 208.27 | 13 | IGHV5-51*05 | 28.9 | 92.3 | √ | √ | 0.001 |
| FR3 | STSTAYLQWSSLK | gi|106897850 | 736.4 | 2 | 179.46 | 13 | IGHV5-78*01 | 28.5 | 92.3 | √ | √ | 0.002 |
| FR3 | VTSVTAADTAVYYCAR | gi|219566321 | 874.4 | 2 | 241.42 | 16 | IGHV4-34*13 | 33.1 | 87.5 | – | √ | 0.004 |
| CDR3 | WFDPWGQGTLVTVSSASTK | gi|304563132 | 1034.0 | 2 | 219.99 | 19 | IGHJ5*02 | 38.5 | 100 | √ | √ | 0.001 |
| FR4 | YFDLWGR | gi|304563378 | 478.7 | 2 | 128.57 | 7 | IGHJ2*01 | 21.9 | 100 | √ | √ | 0.001 |
CDR, complementarity determining region (CDR1, CDR2 and CDR3); FR, framework region (FR1, FR2, FR3 and FR4). √, peptide sequence fulfilled criteria; -, peptide sequence failed to fulfill criteria; n.d., peptide sequence was not detectable in at least one study group (13 POAG or 14 CTRL).
Discussion
The main objective of this study was to identify peptides of the variable IgG domain, particular CDR sequences, which are differently distributed between patients diagnosed with primary open-angle glaucoma (POAG) and healthy controls (CTRL). Autoantibody profiling studies regarding glaucoma were mainly performed by techniques such as microarray or western blot analysis just focusing autoreactivities against a predefined panel of retinal or optic nerve antigens. Recently, many studies demonstrated that high-resolution LC-MS/MS represents a powerful instrument to identify and quantify structures of highly diverse antibodies without prior knowledge of the targeted (auto-) antigens (31,32). This new approach provided highly specific IgG V domain peptides as potential biomarker candidates in diseases such as lung cancer or multiple sclerosis (33,34) promising new insights into autoimmune processes in glaucoma. To reduce the complexity of the samples due to the high sequence variation of antibodies, only tryptic peptides of purified Fab fragments were analyzed by LC-MS as illustrated in Figure 1.
As shown in Figure 2, the Fab purification step showed a high degree of reproducibility between the individual study samples and was confirmed by the densitometric analysis of the Fab protein spots. Data analysis of the discovery proteomic study revealed in total 3753 peptides in both study groups with a FDR < 1%. Around 3500 of these detected peptides were assigned to the variable IgG domain, whereas Singh et al. (2013) (34) identified only around 1600 IgG V domain peptides despite a larger study population of around 30 multiple sclerosis patients. Instead of purifying only the Fab fragments for the analysis, Singh et al. (2013) (34) sequenced the whole antibody structures (heavy and light chain) using gel-based MS analysis. This may results to the preferred detection of high abundant peptides from the constant region of the antibodies masking the identification of low abundant peptides from the variable region. Tryptic IgG V domain peptides determine the antigen specificity of the antibodies and are expected to show a higher variability in case-control studies in comparison to peptides of the constant IgG domain. Statistical analysis of the discovery data revealed in total 75 peptides of the variable IgG domain showing a significant level change (P < 0.05; log2 fold change ≥ 0.5) between both study groups and demonstrates for the first time that structures of the variable region of antibodies are associated to glaucoma (Figs 3–5). Most of these peptides derived from relatively constant FR regions of the IgG framework rather than from CDR regions. FR regions show much lesser mutations relative to hypervariable CDR sequences and are more likely to be shared between several B cell clones. This leads to higher abundances of FR peptides and favors the detection by mass spectrometry instead of highly mutated CDR sequences. Interestingly, around 90% of the IgG V domain peptides were low abundant in the POAG group in contrast to CTRL. These findings would be in accordance with our hypothesis that some of these peptide sequences, incorporated in an antibody structure, may have a neuroprotective function in glaucoma and that there loss maybe promotes the degeneration process of RGCs in vivo (19–22). Recently, many studies demonstrated that short synthetic peptides of CDR regions can mimic the function of whole antibodies (mini-antibody) and exhibit antimicrobial and antitumor activities in a range of in vitro/in vivo experiments (38–40). Assuming that some of these low abundant IgG V domain peptides may promote neuroprotective activities in vivo would offer new treatment possibilities in glaucoma therapy. Interestingly Sohn et al. (2007) (41) and Britschgi et al. (2009) (42) received similar results and proved that the normal ageing process, also one main risk for glaucoma, leads to decreased sera levels of neuroprotective antibodies against amyloidogenic peptides favoring the formation of Alzheimer‘s disease in the elderly population. However, 28 of the IgG V domain peptides were further validated by targeted MS showing a significant lesser abundance in the POAG group in comparison to CTRL (Table 1). A validation of in glaucoma high abundant peptide sequences was not possible.
In consideration of the fact that the antigen specificities of the glaucoma-associated IgG V domain peptides are unknown, it is very interesting that some of these peptide sequences are already known in literature concerning with aberrant protein deposits and other neurodegenerative diseases. In glaucoma low abundant peptide sequences ASQSVSSYLAWYQQK (CDR1, homologous to IGKV3-11*01) and ASQSVSSSYLAWYQQKPGQAPR (CDR1, homologous to IGKV3-20*02), for instance, were identified by laser capture microdissection and LC-MS analysis as an immunoglobulin derived deposit in the central nerve system and are related to the disease pattern of light chain amyloidosis (AL) (43). AL amyloidosis is defined as a rare disease caused by proteinaceous deposits, particular immunoglobulin light chain proteins, which occur in different parts of the body like kidney, heart, brain or nerves (44). These abnormal protein aggregations can dramatically interfere with proper organ function and are also associated with plaque deposits in neurodegenerative diseases like Parkinson (PD) or Alzheimer‘s (AD) disease (45–47). Patients suffering from AL amyloidosis show increased concentrations of serum free light chains (FLC) and are used as biomarker in clinical diagnostics (44). POAG group showed a higher statistical dispersion of κ/λ ratios of intact antibodies in contrast to CTRL, but no significant difference (P = 0.65) was found between both groups (Supplementary Material, Fig. S4). The κ/λ ratio of intact antibodies is about 3: 1 in healthy individuals and was in agreement with our experimental data (24). This result leads to the assumption that some of the cases may show a dysregulation in the light chain expression pattern resulting from a disturbed B cell maturation. Moreover, representative peptides AAPSVTLFPPSSEELQANK (C region, homologous to IGLC3*01) and ADSSPVKAGVETTTPSK (C region, homologous to IGLC3*01) from the constant region of the IgG light chain were also detected in protein deposits of renal amyloidosis by MS (48). So far, only some cases are known that ocular amyloidosis leads to secondary glaucoma (49,50). However, our group proved increased IgG antibody accumulations in glaucomatous donor eyes accompanied by increased infiltration of CD27+/IgG+ plasma cells using immunohistochemical-staining techniques (51). Moreover, by using an Experimental Autoimmune Glaucoma (EAG) animal model we were able to demonstrate that antibody deposits in the retina are associated with the neurodegeneration process of retinal ganglion cells in vivo (52,53). If these disturbed light chain expression pattern may favor the formation of antibody deposits remains to be determined. Gonzalez-Iglesias et al. (2014) (54) observed increased concentrations of transthyretin and apolipoprotein A-1 in sera of POAG patients by LC-MS analysis, both favoring the formation of amyloid deposits (55). In addition, our group verified increased levels of transthyretin in aqueous humor of POAG patients, strengthening the probability of amyloid deposits close to the side of damage (56). Another peptide sequence DIVMTQSPDSLAVSLGER (FR1, homologous to IGKV4-1*01), decreased in POAG patients, was mentioned to be highly abundant in patients with presymtomatic AD (57). Also another study revealed many other significant increased Ig kappa and lambda peptides in sera of AD patients using MS-based techniques (58). D'Andrea et al. (2003 and 2005) (59,60) provided evidence of increased Ig concentrations in AD brain tissues accompanied by increased neurodegenerative apoptotic effects and postulated to categorize Alzheimer‘s disease as a novel autoimmune disease. However, the exact role of this in glaucoma low abundant peptide sequence remains unclear, especially due to failed validation by targeted MS.
Apart from focusing on the expression levels of single IgG V domain peptides, we also investigated the preferred usage of specific VH, VK or VΛ family members. The family distributions were calculated at the individual patient level and compared between both study groups. VH3 was significantly higher expressed in the POAG group in contrast to CTRL (P = 0.04), whereas family VH2 was slightly but significant diminished in POAG patients (P = 0.01). No significant differences were found in the family distribution of VK and VΛ between CTRL and POAG group. Using LC-MS measurements Singh et al. (2013) (34) proved increased family usage of VH3 and VH4 in the CSF of multiple sclerosis patients and hypothesized that these changes are apparently driven by specific (auto-)antigenic pressures influencing the clonal selection and expansion process during B cell maturation. Also other studies validated the increased usage of VH4 gene segments in the CSF and brain of multiple sclerosis patients on the transcriptional level (61,62). This leads to the assumption that some of the glaucoma-related antigens (e.g. HSP27 or alpha fodrin), discovered by autoantibody profiling, may favor the selection of specific V gene segments during B cell maturation resulting in predefined antigen specificities of the circulating antibodies. Interestingly also another study showed that VH2 gene transcripts are significant overexpressed in ankylosing spondylitis patients (63). Ankylosing spondylitis is described as chronic inflammatory arthritis mainly located in the joints of the spine leading to increasing stiffness of the patients over time. To what extant the decreased family usage of VH2 is related to the pathomechanism of glaucoma remains unclear.
In conclusion, this proteomic study shows for the first time that peptides of the variable region of antibodies are related to glaucoma and can be used to discriminate POAG patients from healthy controls. Moreover, this study design combines unbiased proteomic profiling strategies for discovery with targeted MS for verification resulting in 28 IgG V domain peptides, which are confidently low abundant in POAG patients. If these quantitative differences are driven by autoantigens and to what extent those are related to pathogenesis of glaucoma remains to be determined. In future, it will be of great importance to perform the experimental set-up with a larger cohort of study participants in order to increase the robustness and reliability of the obtained results.
Materials and Methods
Study samples
28 subjects were included in this study compromising of 13 patients with primary open-angle glaucoma (POAG; mean age = 60 ± 7 years; ♂: 5 ♀: 8) and 15 age-matched control subjects (CTRL; mean age = 56 ± 5 years; ♂: 4 ♀: 11). All subjects were recruited for full ophthalmologic examination at the Department of Ophthalmology (Medical Center of the Johannes Gutenberg University Mainz, Germany). The investigation was conducted in accordance with the tenets of the Declaration of Helsinki. Inclusion criteria for POAG patients were IOP > 21 mm Hg, optic disc cupping and visual field defects according the guidelines of the European Glaucoma Society (64). Subjects with other types of glaucoma, any kind of retinal or corneal pathology or eye surgeries within the last year were excluded from the study. Based on verbal confirmation, none of the subjects had a history of Diabetes mellitus, Alzheimer‘s disease, Parkinson's disease, any kind of other autoimmune diseases or cancer to our best knowledge. The control group did not show any clinical signs of glaucoma or any other eye disorders. Ten milliliters of venous blood was taken from each subject after they gave their informed consent. Blood samples were allowed to clot for 30 min at room temperature and centrifuged at 3000 g for 10 min at 10° C. The supernatant containing the sera was distributed in 1.5 ml aliquots and stored at -80° C.
IgG Fab purification
IgG was isolated from sera samples using CaptureSelect™ IgG-Fc (Hu) Affinity Matrix (Thermo Fisher Scientific, Rockford, USA) according to manufacturer‘s introductions with slight modifications. All sera samples (100 µl per subject) were diluted at a ratio 1: 3 with PBS and subsequently added to the spin columns (Thermo Fisher Scientific, Rockford, USA) containing anti IgG-Fc Affinity Matrix. After 10 min of incubation, the spin columns were centrifuged at 5000 g for 2 min. The IgG remained attached to the beads and the flow-through fraction was discarded. The samples were washed three times with 400 µl PBS to avoid unspecific bindings to the matrix. Finally, the IgG fraction was eluted using 400 µl Pierce™ IgG Elution Buffer pH 2.0 (Thermo Fisher Scientific, Rockford, USA) and collected into tubes containing 1 M Tris HCl pH 8.5 to neutralize the elution liquid. This procedure was repeated two times and the eluate fractions were pooled. Protein amounts were estimated using BCA protein Assay Kit (Thermo Fisher Scientific, Rockford, USA) according to the supplier‘s protocol with the modification that bovine gamma globulin (BGG) was used as internal calibration standard. Triplicate measurements were performed using Multiscan Ascent photometer (Thermo Fisher Scientific, Rockford, USA) at a wavelength of 570 nm. Afterwards, 600 µl of the IgG eluate was exchanged in 500 µl papain digestion buffer (20 mM cysteine⋅HCl 20 mM sodium phosphate 10 mM EDTA pH 7.0) by using an Amicon 10k centrifugal filter device (Millipore, Billerica, USA). IgG were digested overnight at 37° C into Fab and Fc using papain immobilized on agarose resin beads (Thermo Fisher Scientific, Rockford, USA) according to the manufacturer‘s introduction. Next day, 750 µl 10 mM Tris ⋅ HCl pH 7.5 were added to the samples and centrifuged at 2000 g for 2 min. The supernatant containing the digested mixture was collected. After this, the digested mixture was exchanged in 300 µl PBS by using an Amicon 10k centrifugal filter device. To purify Fab from Fc and the undigested IgG the samples were loaded onto spin columns filled with CaptureSelect™ IgG-Fc (Hu) Affinity Matrix. The flow-through fraction containing the Fab was collected and protein measurement was performed as described above. To check the quality of the Fab isolation each sample was analyzed by 1-D SDS PAGE under reduced conditions. After separation, gels were fixed and stained using Novex Colloidal Blue Staining Kit (Invitrogen, Carlsbad, USA) according to the supplier‘s protocol. Gels were destained overnight with deionized water and scanned using a DCP-9042 CDN bench top scanner (Brother Industries Ltd., Nagoya, Japan) at 600 dpi. Protein bands were visually inspected to determine if Fab purification steps were successful. Open-source ImageJ software (http://imagej.nih.gov/ij/) was used to perform densitometric analysis of the protein spots (65).
In-solution digestion
Purified Fab (20 µg) were dried for 30 min in the SpeedVac (Eppendorf, Darmstadt, Germany) and subjected for further In-solution trypsin digestion using a method with slight adjustments described earlier (66). In brief, the samples were resolved in 30 µl 50 mM ammonium bicarbonate (NH4HCO3) and sonicated for 5 min. Afterwards disulfide bonds reduction of the samples was performed with 100 mM DTT in NH4HCO3 at 56 °C for 30 min following alkylation with 200 mM IAA in NH4HCO3 for 30 min in the dark. The reduced and alkylated Fab proteins were further digested with 0.2 mg/ml trypsin (Promega, Madison, USA) in 50 mM NH4HCO3 10% ACN at 37° C for 16 h. The reaction was quenched using 0.1% formic acid and evaporated in the Speedvac for 30 min until dryness. The dried samples were resolved in 20 µl 0.1% TFA and purified prior MS analysis using ZIPTIP® C18 solid phase extraction tips (Millipore, Billerica, USA) according to manufacturer‘s introductions.
LC–MS/MS analyses
LC-MS/MS measurements were carried out by a Rheos Allegro pump (Thermo Fisher Scientific, Rockford, USA) downscaled to a capillary HPLC system (flow rate: 6.7 ± 0.3 µl/min) online coupled to a hybrid linear ion trap - Orbitrap MS (LTQ Orbitrap XL; Thermo Fisher Scientific, Rockford, USA) (67,68). Six microliters of digested Fab peptides (1.5 mg/ml) were loaded onto a BioBasic® C18 column system (30 × 0.5 mm pre-column + 150 x 0.5 mm analytical column; Thermo Fisher Scientific, Rockford, USA). Solvent A consists of 2% ACN and 0.1% FA in water and solvent B consists of 80% ACN and 0.1% FA in water. Peptides were eluted within 180 min using following gradient: 5% solvent B (0–10 min), 5–50% solvent B (10–170 min), 50–90% solvent B (170–177 min) and 90–10% solvent B (177–180 min). For positive electrospray ionization a low flow metal needle (Thermo Fisher Scientific, Rockford, USA) was used, spray voltage was set to 2.15 kV and the heated capillary temperature adjusted to 220 °C. LTQ Orbitrap operated in a data-dependent acquisition method: High-resolution survey full scan (from m/z 300 to 2000) was detected in the Orbitrap with a resolution of 30.000 at 400 m/z and a target automatic gain control of 1 x 10⁶ ions. Lock mass was set to 445.120025 m/z (polydimethylcyclosiloxane) and used for internal calibration. Based on the full scan the five most intense precursor ions were selected for collision-induced dissociation (CID) fragmentation in the ion trap applying normalized collision energy of 35%. Dynamic exclusion settings included a repeat count of 3, repeat duration of 30 s, exclusion list size of 100 and exclusion duration of 300 s. Inspection and evaluation of the raw data was performed using visualization tool Qual Browser v. 2.0.7 SP1 (Thermo Fisher Scientific, Rockford, USA) and open-source software Mass ++ (Shimadzu Corporation, Kyoto, Tokyo).
Peptide identification
Acquired LC-MS profiles were analyzed by MAXQuant computational proteomics platform version 1.5.2.8 (Max Planck Institute of Biochemistry, Martinsried) for peptide identification and label-free quantification (69,70). Tandem MS spectra were searched against NCBI human database (date: 05/01/16; sequences: 955.083 sequences) with following settings: peptide mass tolerance of ± 30 ppm, fragment mass tolerance of ± 0.5 Da, tryptic cleavage, a maximum of two missed cleavages, carbamidomethylation as fixed modification of cysteine, acetylation (N-terminal) and oxidation as variable modification of methionine. Peptides were identified with a false discovery rate < 1% (FDR) with ≥ 6 amino acid residues. All peptide sequences identified in cases and controls were subsequently aligned to variable (V), joining (J) and constant (C) germline sequences derived from the International ImMunoGeneTics Information System (IMGT) database (Montpellier, France) (71,72). According to previous studies IgBLASTp search algorithm (NCBI IgBLAST version 1.4) was used to arrange the identified peptide sequences to the IgG framework (73). Peptide alignments with a bitscore ≥ 12.5 and alignment match ≥ 70% were evaluated as true hits and selected for further analysis according to previous publications (30,34). Peptide sequences were assigned automatically to their corresponding CDR or FR regions according to the IMGT numbering system. Peptides were positioned in the IgG framework if a minimum of three amino acids was part of a CDR or FR region. Since IgBLASTp algorithm was not suitable to perform CDR3 identification automatically, sequence annotation was performed manually according to the unique IMGT numbering system (74).
Statistical analysis
Results of the IgBLASTp search were combined with MaxQuant generated output matrix containing protein hit, sequence, length, mass, charge, score, intensity and MS/MS fragmentation spectra of the detected peptides. The statistical analysis and graphical presentation was performed using Perseus version 1.5.5.0 (Max Planck Institute of Biochemistry, Martinsried). At first, the raw intensities of the detected peptides were log2 transformed for further analyses (75). Prior statistical analysis, the output data were filtered for contaminants, reversed hits and for a minimum number of valid values in at least one study group (15 CTRL or 13 POAG subjects). After this, missing values were replaced by their respective means assuming that these peptides were close to the limit of detection (36). Finally, two-sided t-test statistics with P values < 0.05 was applied to identify significant glaucoma-related level changes in peptide abundances. Further statistical analyses and graphical presentation of data were performed using Statistica version 12 (Statsoft, Tulsa, USA) and Excel 2010 function.
Targeted MS
In order to validate the glaucoma-associated IgG V domain peptides observed in the discovery study a targeted MS strategy via AIMS was performed (76). The Orbitrap MS system targets selected masses on the software inclusion list in each MS scan and requires only MS/MS spectra if a listed peptide is detected with the accurate mass and charge state. Selection of the peptides for the inclusion list was carried out manually using experimentally observable IgG V domain peptides which were significant differentially distributed in the POAG group in contrast to CTRL in the discovery study (P < 0.05). The selected proteolytic peptides were required to be fully tryptic with a maximum of two missed cleavages. Purified Fab fragments (20 µg) of 14 controls and 13 POAG patients were subjected for further In-solution trypsin digestion and analyzed individually by targeted MS strategy. One control sample was excluded from MS analysis because of sample material limitation. For targeted MS analysis the Orbitrap MS system was operated with the previously described settings with some slight modifications (68,77). The use of global parent list was enabled and the repeat duration was set to 300 instead of 30 s. Acquired Tandem MS spectra were searched against NCBI human database (date: 05/01/16; sequences: 955.083 sequences) with the previous settings. IgBLASTp search algorithm and IMGT database were used to assign the identified peptides to their corresponding CDR or FR regions as described above in detail.
A list of all identified peptides is provided in Supplementary File S1. Information about the statistical analysis of discovery and targeted MS data-set is listed in Supplementary File S2.
Supplementary Material
Supplementary Material is available at HMG online.
Conflict of Interest statement. None declared.
Funding
This research did not receive any specific grant from funding agencies in the public, commercial, or not-for-profit sectors.
