


Abstract
Is there a relationship between blastocyst metabolism and biomarkers of embryo viability?
Blastocysts with higher developmental potential and a higher probability of resulting in a viable pregnancy consume higher levels of glucose and exhibit distinct amino acid profiles.
Morphological and morphokinetic analyses utilized in embryo selection provide insight into developmental potential, but alone are unable to provide a direct measure of embryo physiology and inherent health. Glucose uptake is a physiological biomarker of viability and amino acid utilization is different between embryos of varying qualities.
Two hundred and nine human preimplantation embryos from 50 patients were cultured in a time-lapse incubator system in both freeze all and fresh transfer cycles. A retrospective analysis of morphokinetics, morphology (Gardner grade), KIDScore, artificial intelligence grade (EmbryoScore), glucose and amino acid metabolism, and clinical pregnancies was conducted.
ICSI was conducted in all patients, who were aged ≤37 years and previously had no more than two IVF cycles. Embryos were individually cultured in a time-lapse incubator system, and those reaching the blastocyst stage had their morphokinetics annotated and were each assigned a Gardner grade, KIDScore and EmbryoScore. Glucose and amino acid metabolism were measured. Clinical pregnancies were confirmed by the presence of a fetal heartbeat at 6 weeks of gestation.
Glucose consumption was at least 40% higher in blastocysts deemed of high developmental potential using either the Gardner grade (P < 0.01, n = 209), KIDScore (P < 0.05, n = 207) or EmbryoScore (P < 0.05, n = 184), compared to less viable blastocysts and in blastocysts that resulted in a clinical pregnancy compared to those that failed to implant (P < 0.05, n = 37). Additionally, duration of cavitation was inversely related to glucose consumption (P < 0.05, n = 200). Total amino acid consumption was significantly higher in blastocysts with an EmbryoScore higher than the cohort median score (P < 0.01, n = 185). Furthermore, the production of amino acids was significantly lower in blastocysts with a high Gardner grade (P < 0.05, n = 209), KIDScore (P < 0.05, n = 207) and EmbryoScore (P < 0.01, n = 184).
Samples were collected from patients who had ICSI treatment and from only one clinic.
These results confirm that metabolites, such as glucose and amino acids, are valid biomarkers of embryo viability and could therefore be used in conjunction with other systems to aid in the selection of a healthy embryo.
Work was supported by Virtus Health. D.K.G is contracted with Virtus Health. The other authors have no conflict of interest to declare.
N/A.
Introduction
Historically, transferring multiple embryos in an IVF cycle was performed to attain acceptable success rates. However, transferring two or more embryos creates the possibility of a multiple gestation, which carries significantly greater medical risks to both mother and child (Albrecht and Tomich, 1996; Luke et al., 1996; Adashi et al., 2003; Ombelet et al., 2005). Improvements in embryo culture systems facilitated single embryo transfers, reducing the incidence of multiple gestations (Gerris et al., 1999) and in the last 20 years, there has been a shift to single blastocyst transfers (Gardner et al., 1998; 2000; Harbottle et al., 2015; Takeshima et al., 2016; Penzias et al., 2017). While pregnancy rates worldwide have increased largely due to improvements in culture conditions, our ability to decrease time to pregnancy is dependent upon our capabilities to select the most viable blastocyst for transfer.
Traditionally, embryos are graded on morphological features leading to the creation of scoring systems for each successive stage of development. Parameters assessed include blastomere number, symmetry and degree of fragmentation during the cleavage stages (Cummins et al., 1986; Gerris et al., 1999; Van Royen et al., 1999), as well as size of blastocoel, and inner cell mass (ICM) and trophectoderm (TE) differentiation in the case of the blastocyst (Gardner et al., 2000). Traditional morphological grading requires removal of the embryo culture dish from the incubator for assessment under the microscope, thereby exposing embryos to fluctuations in the environment such as light, temperature and pH, which can adversely impact embryo physiology and developmental potential (Lane and Gardner, 2005; Hansen, 2007; Zander-Fox et al., 2010; Wale and Gardner, 2016; Gardner and Kelley, 2017). Additionally, such an approach to grading is, by necessity, restricted to only a handful of discrete time points during development, thereby failing to capture the true dynamic nature of preimplantation embryo development (Montag et al., 2011).
With the advent of time-lapse systems, preimplantation embryo development can be captured continuously, whilst also providing an uninterrupted culture environment. Time-lapse has subsequently facilitated identification of novel morphological events, such as reverse and direct cleavage, both of which have been linked to decreased embryo viability (Rubio et al., 2012; Liu et al., 2014). Annotating the timing of key morphological events and the rate of development (i.e. the time between two morphological events) has in turn led to the development of algorithms for embryo selection incorporating both morphological and morphokinetic parameters (Rubio et al., 2014; Basile et al., 2015; Milewski et al., 2015; Liu et al., 2016; Petersen et al., 2016; Reignier et al., 2019). Annotating morphokinetic parameters for each individual embryo is, however, time-consuming and a level of inter-observer and intra-observer subjectivity exists impacting overall grading success (Storr et al., 2017).
Artificial intelligence (AI) is relatively new to the field of assisted reproductive technologies and represents a potential means of standardizing and automating embryo selection. AI can be trained to assess embryo viability without preset assumptions, thereby removing the subjectivity previously associated with embryo grading (Curchoe and Bormann, 2019). Such deep-learning has been applied to a single static image during the preimplantation period (Chen et al., 2009; Miyagi et al., 2019; Thirumalaraju et al., 2019), while other groups have utilized images from across the entire preimplantation period facilitated by time-lapse microscopy, thereby significantly increasing the amount of data used to identify embryos with the highest viability (Tran et al., 2019). Such technologies hold great promise and the clinical introduction of AI awaits validation in prospective randomized controlled trials.
While assessment of morphology and morphokinetics is of value in deselection and selection of embryos for transfer, they are unable to provide a direct measure of embryo physiology (Paternot et al., 2011; Santos Filho et al., 2012; VerMilyea et al., 2014). Metabolic regulation is essential for embryo development, and aberrations in preimplantation embryo metabolism are an indicator of lower postimplantation viability (Gardner, 1998; Gardner and Wale, 2013). Importantly, embryos that have been assigned the same morphological grade do not necessarily exhibit the same metabolic profile (Gardner et al., 2001). Analysis of embryo metabolism can therefore provide additional information regarding embryo viability subsequently aiding embryo selection. To date, studies on human embryos have focused on the utilization of carbohydrates or amino acids (Gott et al., 1990; Gardner et al., 2001; Houghton et al., 2002; Gardner et al., 2011). However, other metabolites including lactate, lipids and oxygen (the consumption of which can provide an indirect measure of oxidative metabolism) which have been analyzed in animal models, may also be of value in establishing the metabolic state and health of the human embryo (Lane and Gardner, 1996; Thompson et al., 1996; Sturmey et al., 2009).
The metabolic profile of an embryo can be determined through the non-invasive analysis of changes in metabolite concentrations within spent culture medium (Leese and Barton, 1984; Houghton et al., 2002). It has been demonstrated that high levels of glucose consumption are associated with higher development and implantation potential in human, mouse and cow blastocysts (Renard et al., 1980; Gardner and Leese, 1987; Lane and Gardner, 1996; Gardner et al., 2001; 2011; Lee et al., 2015; Kelley and Gardner, 2019). Additionally, amino acid profiles are distinctly different between embryos of different developmental stages and quality (Houghton et al., 2002; Brison et al., 2004; Picton et al., 2010; Wale and Gardner, 2012; Lee et al., 2015; Kelley and Gardner, 2019). These data therefore support the possible use of both glucose and amino acids as biomarkers to evaluate embryo physiology and developmental potential prior to transfer.
Furthermore, metabolism is directly linked to gene expression and developmental programming through the metaboloepigenetic axis, in which metabolites and cofactors regulate the activity of epigenetic modifiers (Donohoe and Bultman, 2012; Gardner and Harvey, 2015; Harvey et al., 2016). As distinct metabolic profiles of an embryo have been shown to manifest as changes in development post-transfer (Lane and Gardner, 1996; 1998; Mitchell et al., 2009), the utilization and analysis of metabolic biomarkers would aid in the selection of embryos with normal preimplantation physiology and subsequently increase the likelihood of healthy offspring (Barker and Osmond, 1986; Barker et al., 1989; Gardner and Kelley, 2017; Ferrick et al., 2019). It is currently unknown if metabolism is linked to existing embryo viability markers. Consequently, the aim of this study was to determine how blastocyst glucose and amino acid metabolism, as a measure of embryonic viability and health, relates to embryonic developmental parameters and transfer outcomes.
Materials and methods
Patient selection and ovarian stimulation
Fifty patients aged ≤37 years, with no more than two previous IVF cycles, undergoing an ICSI cycle between January 2018 and July 2019 were included in this study. Women underwent a gonadotropin-releasing hormone (GnRH) antagonist stimulation protocol. Ovarian stimulation began on the second day of menstrual cycle with recombinant FSH injections (Gonal F, Merck Australia). A GnRH antagonist (Cetrotide, Merck Australia) was administered on Days 4–5 of stimulation to prevent premature ovulation. Transvaginal ultrasound and serum estradiol levels were used to monitor cycles. Upon leading follicles reaching ∼17 mm in size, a trigger hCG injection (Ovidrel, Merck Australia) was administered and oocyte collection performed 36 h post-trigger.
Embryo culture
Two hours following oocyte retrieval oocytes were denuded of surrounding cumulus cells using a hyaluronidase solution (SynVitro Hyadase, CooperSurgical, CT, USA) and inseminated via ICSI 2 h later. Injected oocytes were immediately transferred to individual culture wells containing 25 µl G-TL medium overlaid with 1.4 ml Ovoil (Vitrolife AB, Sweden) in a pre-equilibrated EmbryoSlide® culture dish (Vitrolife AB, Sweden). Embryos were cultured in an EmbryoScope® time-lapse incubator (Vitrolife AB, Sweden) at 5% O2, 6% CO2, 89% N2 at 37°C and time of ICSI was set as insemination time. At 90 and 114 h postinsemination, embryos were washed in culture medium and transferred to a new pre-equilibrated EmbryoSlide® culture dish containing 15 µl G-TL medium in each well overlaid with 1.4 ml Ovoil. On Day 5 of development, embryos were assessed for transfer or vitrification, or cultured until Day 6 where they were either vitrified or discarded accordingly. The 90–114 h culture dishes containing spent media were stored at −20°C until collection for metabolic analysis. Two hundred and nine embryos that reached the blastocyst stage during culture (i.e. by Day 6) were retrospectively analyzed for morphological grade, morphokinetics, metabolism and transfer success.
Analysis of morphology
Morphological assessment was conducted at 115 h postinsemination. Blastocyst expansion and ICM and TE quality were graded according to the Gardner grading system (Gardner et al., 2000). Embryos graded higher than BB were considered to be of higher viability than embryos graded BB or less (Gardner et al., 2004). Blastocyst diameter was measured (115 h postinsemination) using the EmbryoViewer® software diameter tool (version 7.5.201.20844, Vitrolife AB, Sweden) and calculated as the distance between the outer borders of the TE (Almagor et al., 2016).
Analysis of morphokinetics
Morphokinetic analysis was achieved using EmbryoViewer® software to assess images captured by the EmbryoScope® time-lapse incubator every 10 min in seven focal planes. The specific timings of two-cell cleavage (t2), three-cell cleavage (t3), four-cell cleavage (t4), five-cell cleavage (t5), six-cell cleavage (t6), seven-cell cleavage (t7), eight-cell cleavage (t8), morulae (tM), start of blastulation (tSB), blastocyst (tB), expanded blastocyst (tEB) and hatching blastocyst (tH) were recorded as hours postinsemination (Desai et al., 2014). Annotations were recorded for embryos which could be accurately assessed. KIDScore values (0–9.9) predict the probability that an embryo will successfully implant (Reignier et al., 2019) and are calculated utilizing the D5 KIDScore algorithm (version 2), which is integrated into the EmbryoViewer® software and available for use clinically. Embryos assigned a KIDScore greater than the median cohort score (6.9) were considered to be of higher viability than embryos assigned a lower KIDScore. Of the 209 embryos cultured, two embryos where annotations could not be accurately assessed were not included in analysis. Additionally, rate of expansion (tEB-tSB) was calculated and embryos were grouped into fast (≤13 h) or slow (>13 h) expansion rates as previously described (Desai et al., 2018). To minimize inter-user variability, only one scientist conducted the annotation assessments.
AI selection
Videos of preimplantation development were exported from EmbryoViewer® software (0–115 h postinsemination) and uploaded into IVY (version 1.0.0, Harrison AI, Sydney, AUS) an AI program, which assesses preimplantation embryo development across a single focal plane and calculates an EmbryoScore (%) which represents the probability that an embryo will develop a fetal heartbeat and can subsequently assist in ranking embryos for transfer (Tran et al., 2019). Embryos assigned an EmbryoScore greater than the median cohort score (29%) were considered to be of higher viability than embryos assigned a lower EmbryoScore. Of the 209 embryos cultured, 25 embryos could not be included in analysis as a result of an interruption in the time-lapse video, such as the embryo went out of focus or oil bubbles in the culture well. Such factors can impact the overall EmbryoScore.
Metabolic analysis
Day 5 (90–114 h) spent media samples were collected and analyzed for both glucose and amino acid metabolism to provide a detailed metabolic profile for each individual embryo that reached the blastocyst stage. Spent media samples (test) and no-embryo (control) media were collected for each patient and metabolite consumption/production was calculated by subtracting test samples from controls.
Glucose uptake
Ultramicrofluoresence (UMF), a miniaturization of conventional enzymatic analysis, was utilized to quantitate glucose metabolism (Leese and Barton, 1984; Gardner et al., 2001).
Amino acid utilization
Liquid chromatography-mass spectrometry (LC-MS) analysis using an Agilent 6490 Triple Quadrupole LC-MS with iFunnel Technology coupled with an Agilent 1290 liquid chromatography system (Agilent, Santa Clara, CA, USA) was utilized to measure amino acid concentrations when compared against a standard calibrated curve (Wale and Gardner, 2012). Pooled quality controls and pooled batch quality controls were conducted to ensure uniformity within and between batches and Agilent MassHunter Quantitative Analysis software (B.08.0, Agilent, CA, USA) was used to calculate relative abundances (integrated area) of amine-containing metabolites.
Pregnancy assessment
Of the 209 embryos cultured, 37 single blastocysts were transferred in a fresh cycle and the remaining blastocysts were vitrified as part of a freeze-all cycle. The embryo with the best morphology, followed by the highest KIDScore amongst a cohort was selected for transfer. Only embryos transferred in a fresh cycle were included in pregnancy rate analysis. Biochemical pregnancy was recorded after an hCG blood test (positive pregnancy was an hCG level >5 IU/L), and clinical pregnancies were later confirmed at a 6 week ultrasound and observation of a fetal heartbeat.
Statistical analysis
For morphokinetic analysis blastocysts were grouped according to the median glucose and amino acid utilization. To analyse blastocyst metabolism in comparison to KIDScore and EmbryoScore, embryos were grouped based on the median scores (6.9 and 29%, respectively). Embryos were grouped as per Gardner grade (higher than BB or BB and less) for analysis of blastocyst metabolism and morphological grade. Data are expressed as mean ± SEM and tested for normality using the Shapiro–Wilk test. The difference between two groups was determined using parametric Student’s t-test or nonparametric Mann–Whitney U test and the P-value threshold was set to 0.05. All analyses were conducted using Prism 8 (version 8.3.0, GraphPad, LLC).
Ethical approval
Ethical approval was obtained from Melbourne IVF Human Research Ethics Committee (53/117-MIVF), patients were recruited during clinical consultation.
Results
Blastocyst metabolism is positively related to embryo viability scores
Three different grading systems were used to retrospectively assess embryo viability prior to transfer: (i) morphological grading using the Gardner grading system, (ii) D5 KIDScore algorithm and (iii) EmbryoScores through an AI system (IVY). Regardless of which method embryo viability was measured, blastocysts with the highest viability consumed at least 40% more glucose than lower-quality blastocysts (Fig. 1). Blastocysts with a Gardner grade greater than a BB grade (n = 86) consumed significantly more glucose on Day 5 of development than less viable blastocysts which scored a BB grade or less (n = 123) (91.7 ± 8.5 versus 61.4 ± 5.9 pmol/embryo/h, P < 0.01) (Fig. 1A). Similarly, blastocysts that were assigned a KIDScore greater than the median cohort score (n = 100) consumed more glucose on Day 5 than lower scoring blastocysts (n = 107) (88.1 ± 7.8 versus 60.9 ± 6.3 pmol/embryo/h, P < 0.05) (Fig. 1B) and blastocysts with an EmbryoScore greater than the median cohort score (n = 91) (i.e. those with a higher probability of developing a fetal heartbeat) consumed more glucose on Day 5 of development compared to less viable blastocysts (n = 93) (87.9 ± 8.1 versus 61.7 ± 7.4 pmol/embryo/h, P < 0.05) (Fig. 1C). Of those embryos with a high KIDScore and an EmbryoScore (n = 83), 77% had a high EmbryoScore (n = 64). Of these embryos with both a high KIDScore and EmbryoScore, 64% consumed more glucose than the median cohort uptake (n = 41).
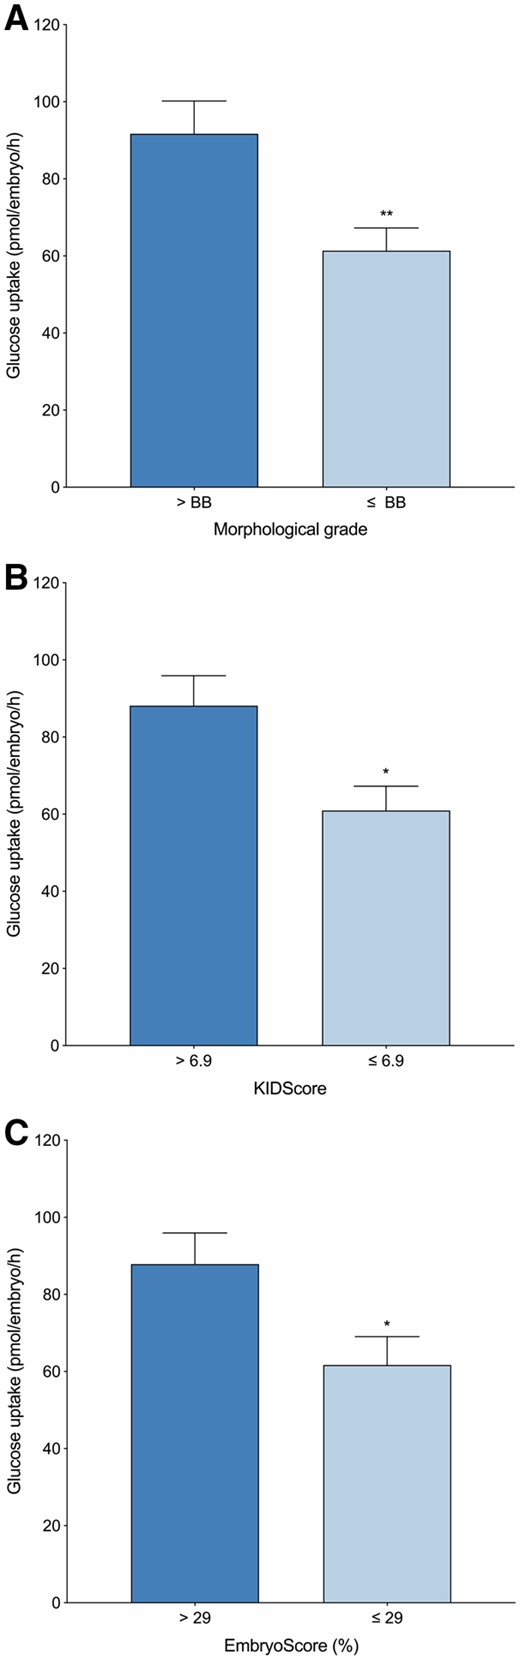
Blastocyst glucose uptake compared to embryo viability. (A) Gardner grade (>BB, n = 86; ≤BB, n = 123), (B) KIDScore (>6.9, n = 100; ≤6.9, n = 107) and (C) EmbryoScore (>29%, n = 91; ≤29%, n = 93). Each data set (A–C) is expressed as mean ± SEM (pmol/embryo/h). Significance is measured utilizing Mann–Whitney U test and denoted by asterisks, *P < 0.05, **P < 0.01.
Blastocyst glucose metabolism is related to clinical pregnancy rates
Blastocysts that resulted in a clinical pregnancy demonstrated a 2-fold increase in glucose consumption on Day 5 of the preimplantation period than blastocysts that failed to implant or maintain a successful pregnancy (77.4 ± 11.7 versus 38.4 ± 11.2 pmol/embryo/h, P < 0.05) (Fig. 2). Of note, blastocysts assigned an AA morphological grade which established a clinical pregnancy consumed the highest level of glucose (84.4 ± 17.3 pmol/embryo/h, n = 11). Additionally, while results were not statistically significant, blastocysts assigned an AA morphological grade which failed to establish a pregnancy (n = 7) consumed lower glucose than blastocysts assigned a B grade for ICM and/or TE (AB, BA or BB) that successfully implanted (n = 6) (22.2 ± 25.3 pmol/embryo/h versus 64.5 ± 9.1 pmol/embryo/h) (P = 0.12). No significant difference was observed in amino acid utilization profiles between embryos that established a clinical pregnancy and embryos that failed to implant (data not shown).
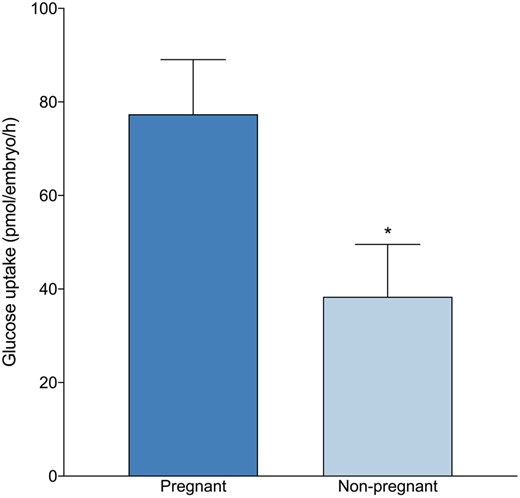
Glucose uptake of blastocysts that were transferred in a fresh single blastocyst transfer cycle and ongoing pregnancy rates. All data are expressed as mean ± SEM (pmol/embryo/h) for pregnant (n = 17) and non-pregnant (n = 20). Significance is measured utilizing Student’s t-test and asterisks denote significance, *P < 0.05.
Amino acid profiles of blastocysts are distinctly different according to embryo viability scores
Blastocysts with high viability according to their Gardner grade consumed significantly higher levels of arginine (P < 0.05), aspartate (P < 0.05), glutamate (P < 0.05), isoleucine (P < 0.05), leucine (P < 0.05), lysine (P < 0.05) and threonine (P < 0.05) and produced significantly lower levels of alanine (P < 0.01) and glutamine (P < 0.0001), compared to blastocysts assigned a lower Gardner grade (Fig. 3A). Similarly, these same amino acids as well as asparagine, phenylalanine, taurine and tryptophan were utilized differently by blastocysts that had a high implantation potential, as assessed by D5 KIDScore algorithm, compared to less viable blastocysts (alanine, P < 0.01; arginine, P < 0.05; asparagine, P < 0.05; aspartate, P < 0.05; glutamine, P < 0.01; glutamate, P < 0.05; isoleucine, P < 0.05; leucine, P < 0.05; lysine, P < 0.05; phenylalanine, P < 0.05; taurine, P < 0.05; threonine, P < 0.05; tryptophan, P < 0.05) (Fig. 3B). Furthermore, each amino acid with the exception of alanyl-glutamine, glycine and valine were either consumed at higher levels or produced at lower levels by blastocysts with a higher EmbryoScore than less viable blastocysts (alanine, P < 0.001; arginine, P < 0.01; asparagine, P < 0.01; aspartate, P < 0.01; glutamine, P < 0.001; glutamate, P < 0.001; histidine, P < 0.05; isoleucine, P < 0.05; leucine, P < 0.01; lysine, P < 0.01; methionine, P < 0.05; phenylalanine, P < 0.05; proline, P < 0.05; serine, P < 0.01; taurine, P < 0.01; threonine, P < 0.01; tryptophan, P < 0.01; tyrosine, P < 0.05) (Fig. 3C).
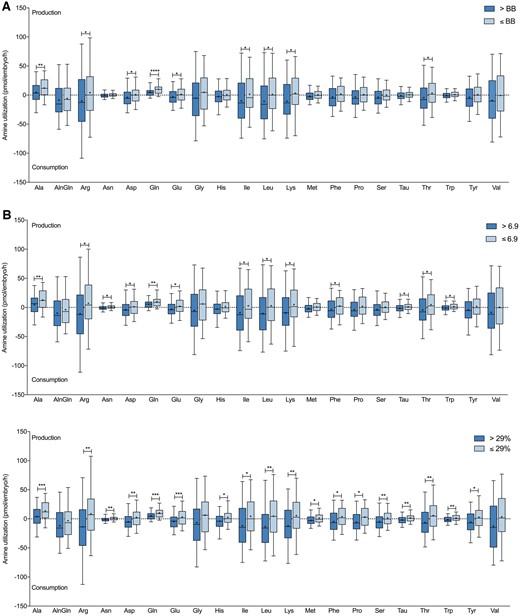
Blastocyst amino acid utilization profiles compared to embryo viability. (A) Gardner grade (>BB, n = 86; ≤BB, n = 123), (B) KIDScore (>6.9, n = 100; ≤6.9, n = 107) and (C) EmbryoScore (>29%, n = 91; ≤29%, n = 93). Negative values represent amino acid consumption and positive values represent amino acid production. Alanine (Ala), alanyl-glutamine (AlnGln), arginine (Arg), asparagine (Asn), aspartate (Asp), glutamine (Gln), glutamate (Glu), glycine (Gly), histidine (His), isoleucine (Ile), leucine (Leu), lysine (Lys), methionine (Met), phenylalanine (Phe), proline (Pro), serine (Ser), taurine (Tau), threonine (Thr), tryptophan (Trp), tyrosine (Tyr) and valine (Val). Boxes represent 25th to 75th percentile, whiskers represent 5th to 95th percentile, ‘+’ represents mean, and median represented by horizontal line. Significance is measured utilizing Student’s t-test and denoted by asterisks, *P < 0.05, **P < 0.01, ***P < 0.001, ****P < 0.0001.
Blastocyst total amino acid consumption and production are related to embryo viability scores
Overall amino acid turnover (sum of consumption and production) was analyzed as a further measure of blastocyst metabolic activity. There was no significant difference in amino acid turnover between blastocysts of high and low viability when assessed using Gardner grade, KIDScore or EmbryoScore (Fig. 4). However, the total production of amino acids on Day 5 of preimplantation development was significantly lower in blastocysts with high viability, as determined by Gardner grade (171.6 ± 30.5 versus 210.2 ± 24.1 pmol/embryo/h, P < 0.05), D5 KIDScore algorithm (166.1 ± 27.0 versus 221.1 ± 26.6 pmol/embryo/h, P < 0.05) and EmbryoScore (160.5 ± 26.4 versus 235.9 ± 30.4 pmol/embryo/h, P < 0.01) (Fig. 4). Additionally, blastocysts with high EmbryoScores also consume significantly more amino acids overall compared to less viable blastocysts (245.2 ± 28.6 versus 134.7 ± 20.6 pmol/embryo/h, P < 0.01) (Fig. 4C).
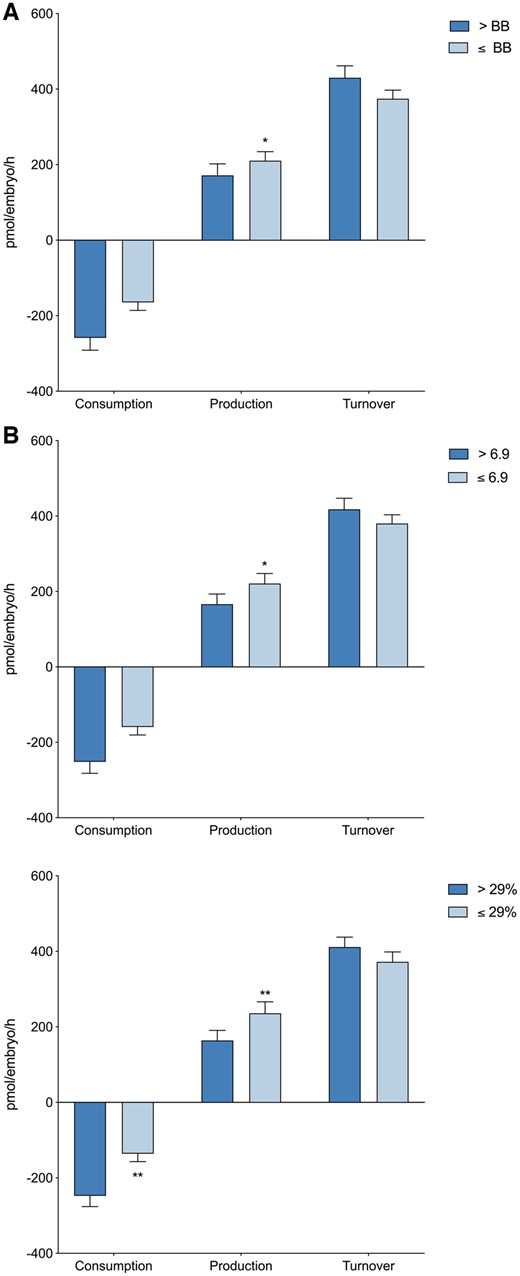
Total amino acid consumption, production and amino acid turnover in relation to embryo viability. (A) Gardner grade (>BB, n = 86; ≤BB, n = 123), (B) KIDScore (>6.9, n = 100; ≤6.9, n = 107) and (C) EmbryoScore (>29%, n = 91; ≤29%, n = 93). Each data set (A–C) is expressed as mean ± SEM (pmol/embryo/h). Significance is measured utilizing Mann–Whitney U test and denoted by asterisk, *P < 0.05, **P < 0.01.
Fast developing embryos have different Day 5 metabolic profiles compared to slow developing embryos
Embryos that consumed more than the median amount of glucose (61 pmol/embryo/h) on Day 5 of development developed faster across all morphokinetic parameters (with the exception of t3, t5, t8 and tH) compared to embryos that consumed lower levels of glucose on Day 5 of development (Fig. 5A). A delay of ∼1 h during the early cleavage stages was observed in embryos that consumed lower levels of glucose on Day 5, and this delay was extended to 2–4 h by the blastocyst stage (Fig. 5A). Furthermore, embryos with an expansion rate (tEB-tSB) of 13 h or less consumed significantly higher levels of glucose on Day 5 of development compared to embryos that took longer than 13 h to fully expand (85.0 ± 6.9 versus 61.6 ± 9.2 pmol/embryo/h, P < 0.05) (Fig. 5B). Blastocysts with a diameter greater than the mean of 151 µm (n = 96) consumed significantly more glucose than smaller blastocysts (n = 104) (94.7 ± 8.1 versus 56.2 ± 6.6 pmol/embryo/h, P < 0.001), with a significant linear relationship between blastocyst size and glucose uptake (P < 0.001). Consistent with glucose consumption, the amino acid profiles of faster developing embryos were significantly different. Specifically, embryos that consumed higher levels of arginine, asparagine, aspartate, isoleucine, lysine, taurine and/or valine developed faster to tM, tSB, tB and/or tEB (P < 0.05) (Table I). Additionally, alanine and glutamate were produced at lower levels by embryos that developed faster to tM, tSB, tB and/or tEB (P < 0.05) (Table II). No significant difference was observed between Day 5 amino acid profiles and the time between tSB and tEB (i.e. rate of expansion).
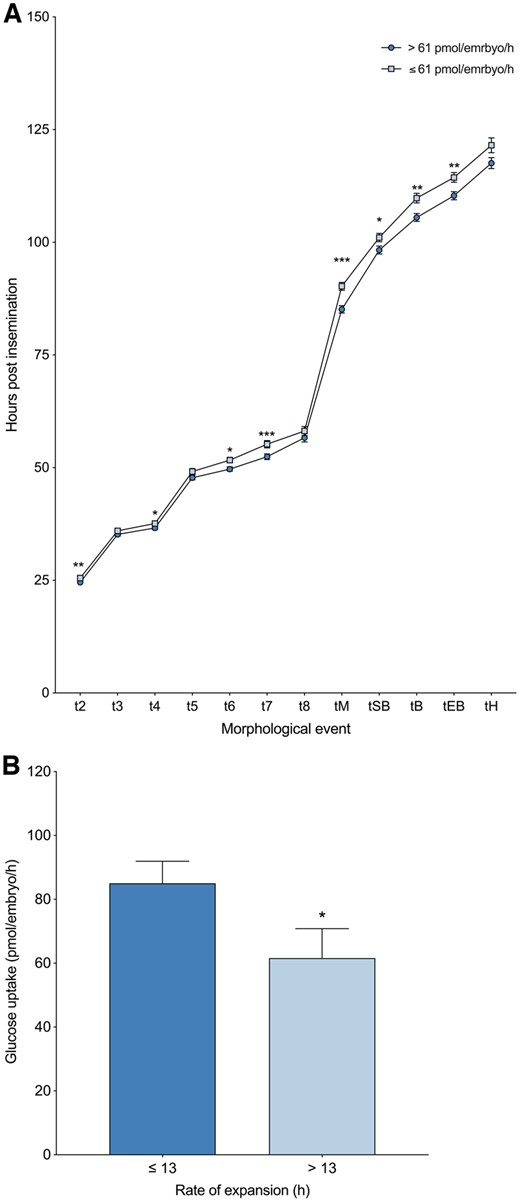
Blastocyst glucose uptake and the relationship to morphokinetic development of preimplantation embryos. (A) Morphokinetic development of embryos that consumed high or low levels of glucose. Dark, circular data points represent the timing of each key morphokinetic event of embryos that consumed greater than the median amount of glucose (61 pmol/embryo/h). Light, square data points represent the timing of each key morphokinetic event of embryos that consumed less than the median amount of glucose. Morphokinetic parameters calculated as hours post-insemination: two-cell cleavage, t2 (n = 209); three-cell cleavage, t3 (n = 209); four-cell cleavage, t4 (n = 209); five-cell cleavage t5 (n = 209); six-cell cleavage, t6 (n = 205); seven-cell cleavage, t7 (n = 200); eight-cell cleavage, t8 (n = 200); morulae, tM (n = 204); start of blastulation, tSB (n = 209); blastocyst, tB (n = 209); expanded blastocyst, tEB (n = 201); and hatching blastocyst, tH (n = 137). (B) Glucose uptake of embryos that fully expanded (tEB-tSB) in ≤13 h (n = 116) compared to embryos that fully expanded in >13 h (n = 84). Data are expressed as mean ± SEM, significance is measured utilizing Mann–Whitney U test and asterisks denote significance, *P < 0.05, **P < 0.01, ***P < 0.001.
Morphokinetic development of embryos and their correlation to blastocyst consumption of individual amino acids.
| Timing of specific morphokinetic events (h) | |||||
|---|---|---|---|---|---|
| Consumption of amino acids (pmol/embryo/h) | tM | tSB | tB | tEB | |
| Arginine | > Median | 86.1 ± 1.1 | 98.3 ± 0.7* | 106.4 ± 0.9 | 111.1 ± 0.9 |
| ≤ Median | 88.3 ± 1.1 | 101.0 ± 1.1 | 108.9 ± 1.1 | 113.7 ± 1.1 | |
| Asparagine | > Median | 86.6 ± 0.7 | 98.5 ± 0.7 | 106.3 ± 0.9* | 111.0 ± 0.8* |
| ≤ Median | 88.7 ± 1.0 | 100.9 ± 1.0 | 109.0 ± 1.1 | 113.9 ± 1.1 | |
| Aspartate | > Median | 86.4 ± 0.7* | 98.3 ± 0.7* | 106.4 ± 0.8 | 111.0 ± 0.8 |
| ≤ Median | 89.0 ± 1.0 | 101.1 ± 1.1 | 108.9 ± 1.1 | 113.8 ± 1.1 | |
| Isoleucine | > Median | 85.8 ± 1.1 | 98.5 ± 0.7 | 106.2 ± 0.8* | 110.9 ± 0.8* |
| ≤ Median | 88.6 ± 1.0 | 100.9 ± 1.0 | 109.1 ± 1.1 | 114.0 ± 1.1 | |
| Lysine | > Median | 86.0 ± 1.1 | 98.5 ± 0.7 | 106.3 ± 0.8* | 111.0 ± 0.8* |
| ≤ Median | 88.5 ± 1.0 | 100.8 ± 1.1 | 109.9 ± 1.2 | 113.9 ± 1.2 | |
| Taurine | > Median | 86.9 ± 0.7 | 98.5 ± 0.8 | 106.0 ± 0.8* | 111.2 ± 0.9 |
| ≤ Median | 88.4 ± 1.0 | 100.9 ± 1.0 | 109.3 ± 1.1 | 113.7 ± 1.1 | |
| Valine | > Median | 87.0 ± 0.8 | 98.0 ± 0.7 | 106.1 ± 0.8* | 110.8 ± 0.9 |
| ≤ Median | 88.3 ± 1.0 | 101.4 ± 1.0 | 109.2 ± 1.1 | 114.0 ± 1.1 | |
Median consumption (pmol/embryo/h): arginine 5.10; asparagine 0.37; aspartate 1.40; isoleucine 6.10; lysine 0.15; taurine 0.20; valine 5.40. The timing of specific morphological events (time to morulae (tM), n = 204; start of blastulation (tSB), n = 209; blastocyst (tB), n = 209; and expanded blastocyst (tEB), n =201; expressed as mean ± SEM (hours postinsemination)). Significance is measured utilizing Student’s t-test and asterisks denote level of significance.
P < 0.05.
Morphokinetic development of embryos and their correlation to blastocyst production of individual amino acids.
| Timing of specific morphokinetic events (h) | |||||
|---|---|---|---|---|---|
| Production of amino acids (pmol/embryo/h) | tM | tSB | tB | tEB | |
| Alanine | > Median | 88.3 ± 1.0 | 101.4 ± 1.0 | 109.2 ± 1.1 | 114.0 ± 1.1 |
| ≤ Median | 87.0 ± 0.8 | 98.0 ± 0.7** | 106.1 ± 0.8* | 110.8 ± 0.9* | |
| Glutamate | > Median | 89.1 ± 1.0 | 101.5 ± 1.1 | 109.8 ± 1.1 | 114.2 ± 1.1 |
| ≤ Median | 86.2 ± 0.7* | 97.9 ± 0.7*** | 105.5 ± 0.8** | 110.7 ± 0.8* | |
Median production (pmol/embryo/h): alanine 8.95; glutamate 6.70. The timing of specific morphological events (time to morulae (tM), n = 204; start of blastulation (tSB), n = 209; blastocyst (tB), n = 209; and expanded blastocyst (tEB), n = 201; expressed as mean ± SEM (hours postinsemination)). Significance is measured utilizing Student’s t-test and asterisks denote level of significance.
P < 0.05,
P < 0.01 and
P < 0.001.
Discussion
In this study, blastocyst metabolism was shown to positively correlate with existing methods of embryo selection, Gardner grade, D5 KIDScore algorithm as well as the AI EmbryoScore. Of paramount significance, glucose consumption was found to be over 40% higher in blastocysts with a higher developmental and implantation potential. Indeed, when related to clinical pregnancy, glucose consumption was doubled in blastocysts that led to a successful pregnancy. Furthermore, blastocysts with a higher developmental potential and probability to succeed post-transfer also exhibited distinct amino acid profiles than blastocysts of lower viability, irrespective of which grading system was used.
Glucose is the predominant energy source utilized during blastocyst formation, supporting formation of the blastocoel, development of the first epithelium, and exponential cellular growth; processes which are energetically demanding (Biggers et al., 1988; Watson et al., 1990, 1992). High glucose consumption ensures carbon flux through the pentose phosphate pathway required to produce biosynthetic precursors for DNA, RNA and lipid synthesis (Reitzer et al., 1980; Morgan and Faik, 1981; Gardner, 1998). Furthermore, the blastocyst has the capacity to convert glucose to lactate, even in the presence of sufficient oxygen, through aerobic glycolysis (Gardner, 1998). Lactate, long perceived as a by-product or regulator of metabolism (Lane and Gardner, 1996, 2000), has more recently been implicated as a key signaling molecule and immunomodulator, thereby regulating initial events of implantation (Gardner, 2015). Additionally, lactate may directly affect embryonic epigenetic state and gene expression through lactylation of histone proteins (Zhang et al., 2019), an example of a metaboloepigenetic interaction, further highlighting the significance of blastocyst glucose metabolism in assessing embryonic physiology and health. Consistent with previous reports that embryos consuming higher levels of glucose are associated with a higher developmental potential (Renard et al., 1980; Gardner and Leese, 1987; Gardner et al., 2001; 2011; Lee et al., 2015), we show that blastocysts with higher viability consume more glucose during Day 5 of development than less viable blastocysts. Furthermore, embryos that experienced a delay of 2–4 h in development to the blastocyst stage consumed lower levels of glucose on Day 5 of the preimplantation period. This is consistent with data on the mouse embryo which determined that slow cleaving embryos give rise to blastocysts with reduced glucose consumption (Lee et al., 2015). Together, these results support the hypothesis that slower developing embryos, or embryos of lower viability, have a diminished ability to maintain the energy and biosynthetic requirements to support viable blastocyst formation, and subsequently viability post-transfer (Edwards et al., 1984; Wong et al., 2010; Meseguer et al., 2011; Lee et al., 2015).
Blastocyst size has been linked to metabolic activity and viability due to the high energy demands of blastocyst expansion (Gardner and Balaban, 2016; Niederberger et al., 2019). Blastocyst diameter, as an accurate measure of blastocyst size, is positively correlated to clinical pregnancy rates where larger embryos are more likely to establish a clinical pregnancy (Shapiro et al., 2008). Similarly, this study found a positive relationship between blastocyst diameter and glucose consumption. Consistently, blastocysts with a faster expansion rate (tEB-tSB) consumed more glucose than slower expanding blastocysts, plausibly due to these embryos having a higher capacity to maintain energy requirements, subsequently supporting high developmental potential. However, it has been established that even when blastocysts do have the same diameter (Lane and Gardner, 1996; Gardner et al., 2001), there is still a large metabolic variation between embryos, inferring that although the size of a blastocyst is related to metabolism, it is not the sole factor dictating the overall metabolic activity of the embryo.
Of further interest, Desai et al. (2018) found embryos that have a faster expansion rate were associated with a lower rate of aneuploidy. Changes to karyotypes associated with aneuploidy leads to alterations in gene expression, the proteome and metabolism a phenomenon termed aneuploid-stress (Zhu et al., 2018), suggesting embryonic metabolism may be directly related to the genetic composition of embryos in addition to embryo viability and health. Ongoing investigations are currently underway to determine whether metabolic biomarkers can provide a non-invasive measure of embryonic genetic composition.
Retrospective analysis of clinical pregnancy rates confirms that glucose consumption is significantly higher in blastocysts that successfully implant and result in a clinical pregnancy compared to blastocysts that fail to development post-transfer. These data are consistent with Gardner et al. (2011) who determined that glucose consumption of human blastocysts cultured at 5% oxygen was higher in blastocysts with positive transfer outcomes. It was further noted that while data were not significantly different, plausibly due to low sample numbers, blastocysts with a top Gardner grade (AA) that failed to lead to a successful pregnancy had a lower glucose uptake than lower graded blastocysts which were successful post-transfer. This supports the findings of Gardner et al. (2011) who concluded glucose metabolism was a stronger predictor of pregnancy success than morphological grade.
Higher developmental potential and probability of forming a viable pregnancy was also related to amino acid profiles, which may provide an additional means of measuring embryo physiology and health. Specifically, alanine, arginine, aspartate, isoleucine, leucine, lysine, glutamate, glutamine and threonine were utilized differently by blastocysts with high viability, regardless of the embryo selection method used. Of significance, arginine and leucine are both implicated in regulating the mammalian target of rapamycin (mTOR) pathway (González et al., 2012). mTOR is responsible for maintaining cellular homeostasis by responding to nutrient, energy and/or oxygen availability and regulates translation machinery and metabolic processes accordingly. A significant increase in arginine and leucine consumption by blastocysts with higher viability suggests less viable blastocysts are unable to maintain cellular homeostasis as effectively thereby impacting embryo developmental potential. Additionally, arginine and leucine, together and individually, also promote TE motility, which assists TE invasion and is a requirement for penetration of the endometrium during implantation (Martin et al., 2003; Gangloff et al., 2004; Guertin et al., 2006; González et al., 2012). Of further significance, blastocysts that consumed high levels of glucose also consumed significantly more aspartate than less viable embryos. Aspartate is the rate-limiting factor in the malate-aspartate shuttle that facilitates the regeneration of cytosolic nicotinamide adenine dinucleotide (NAD+) required for glucose metabolism (Gardner, 1998; Lane and Gardner, 2005; Mitchell et al., 2009). More recently NAD+ has been recognized as a metaboloepigenetic signaling molecule via activation of sirtuins, a class of NAD+-dependent histone deacetylases (Haigis and Sinclair, 2010; Tatone et al., 2018). Hence, the relative availability of aspartate and subsequently NAD+ may also influence embryonic gene regulation and subsequent health (Houtkooper et al., 2010; Donohoe and Bultman, 2012; Gardner and Harvey, 2015; Harvey et al., 2016; Ferrick et al., 2019; Lees et al., 2020). Given the wide array of metabolic and regulatory pathways amino acids are involved in, it is evident that between blastocysts of high and low viability, individual amino acid profiles represent distinct physiologies and provide a means of assessing important regulators of cellular homeostasis, cell-signaling, implantation and embryonic health. Of note, the amino acid analysis performed in this study assessed amino acid profiles over a 24 h period during blastocyst formation and is therefore limited in its ability to identify differences in flux and interactions between amino acid pathways. Targeted amino acid assays, designed to quantitate the utilization of an individual amino acid with high accuracy will plausibly provide further insight into amino utilization, and further studies are required for the development and validation of such assays.
The results of this study demonstrate that a blastocyst with a high probability of developing into viable and healthy pregnancy is one that consumes high levels of glucose and specific amino acids. Furthermore, this study shows no significant difference in total amino acid turnover, despite the distinct patterns of amino acid consumption and production between blastocysts with different levels of viability. Consequently, these data do not align with the Quiet Hypothesis, which states that the most viable preimplantation embryo has the lowest overall metabolism and the lowest amino acid turnover (Leese, 2002). Of note, studies that lay the foundation for this hypothesis utilized 20% oxygen for culture or metabolic analysis (Bowman and McLaren, 1970; Leese, 1991; Turner et al., 1994; Houghton et al., 2002). Given that 20% oxygen directly perturbs both carbohydrate and amino acid metabolism leading to an altered physiology of the preimplantation embryo, it is plausible that the differences observed in this study and those which formed the basis of the Quiet Hypothesis are due to the concentration of oxygen utilized (Umaoka et al., 1992; Guérin et al., 2001; Wale and Gardner, 2012; Gardner, 2016; Kelley and Gardner, 2016; Gardner and Kelley, 2017; Kelley and Gardner, 2017, 2019). It was proposed by Gardner and Wale (2013) that viable embryos metabolize an optimal range of metabolites, i.e. one that is not suppressed nor unduly elevated (Gardner and Wale, 2013). This concept has gained traction and has been coined the ‘Goldilocks Principle’ (Leese et al., 2016). Our data have shown that within this optimal range the most viable blastocyst is a blastocyst that is characterized by an ‘active’ metabolism and utilizes metabolites in a distinct manner. This metabolic profile represents the embryos ability to maintain sufficient energy to support both cellular homeostasis and biosynthesis required to support embryo development, viability and health of the resulting offspring.
Due to the retrospective nature of this study and low numbers of transferred embryos it was not feasible to establish the cumulative predictive power of metabolism combined with either morphological grades, KIDScore or EmbryoScore. However, as it was shown by Gardner et al. (2011) that metabolism is a stronger predictor of transfer success than morphological grades, it is tempting to speculate that the assessment of blastocyst metabolism (and indirectly the metaboloepigenome) will be complimentary to any system used to assess developmental potential based on morphological parameters such as the KIDScore and EmbryoScore. For example, of the 64 blastocysts with both a high KIDScore and EmbryoScore, inferring high viability, over a third had reduced glucose uptake indicating an impaired physiology which may therefore prevent such top-scoring embryos from resulting in a successful pregnancy. We therefore propose that a combination of metabolic activity together with morphological analysis will culminate in a single algorithm that provides greater power in predicting success post-transfer as well as subsequent fetal health.
This study is the first of its kind to incorporate analysis of both glucose and amino acid metabolism of individual preimplantation embryos under physiological (5%) oxygen concentrations. Of significance, while UMF is a highly sensitive technology and LC-MS is a great discovery tool as it allows analysis of all amino acids in a single sample, neither are translatable to a clinical setting. Bench top assay technologies, however, have previously been used to measure mouse embryo carbohydrate metabolism (Guerif et al., 2013; Kelley and Gardner, 2019) and amino acids (Lee and Gardner, unpublished) and hence provide a means of assessing metabolic biomarkers clinically within an hour, making assessment of metabolic activity prior to a fresh transfer feasible. Consequently, we are now evaluating the predictive power of metabolic biomarkers to create an ‘embryo health’ selection algorithm incorporating morphology, morphokinetics (optimized through AI) and metabolism in order to reduce the time to pregnancy and facilitate the birth of healthy children.
Acknowledgements
The authors would like to thank the embryologists and physicians at Melbourne IVF for their support, and Metabolomics Australia for their expert assistance in amine analysis. The authors would also like to thank Dr. Alex Harvey, Dr. Rebecca Kelley, Mai Truong, Kathryn Gurner and Emma Whatley for their valuable comments on the manuscript.
Authors’ roles
D.K.G prepared the study design and contributed to the manuscript. Y.S.L.L assisted in the study design, coordination of sample collections and the preparation of the manuscript. L.F assisted in the study design, performed all viability assessments, carbohydrate analyses and statistical analysis and contributed to the manuscript.
Funding
This work was supported by Virtus Health. L.F. was the recipient of Australian Government Research Training Program Scholarship, University of Melbourne.
Conflict of interest
Virtus Health and Harrison AI have patented the AI technology used. D.K.G is contracted with Virtus Health. The other authors have no conflict of interest.
