


Abstract
Do children conceived by ART have an increased risk of cancer?
Overall, ART-conceived children do not appear to have an increased risk of cancer.
Despite the increasing use of ART, i.e. IVF or ICSI worldwide, information about possible long-term health risks for children conceived by these techniques is scarce.
A nationwide historical cohort study with prospective follow-up (median 21 years), including all live-born offspring from women treated with subfertility treatments between 1980 and 2001.
All offspring of a nationwide cohort of subfertile women (OMEGA study) treated in one of the 12 Dutch IVF clinics or two fertility clinics. Of 47 690 live-born children, 24 269 were ART-conceived, 13 761 naturally conceived and 9660 were conceived naturally or through fertility drugs, but not by ART. Information on the conception method of each child and potential confounders were collected through the mothers’ questionnaires and medical records. Cancer incidence was ascertained through linkage with The Netherlands Cancer Registry from 1 January 1989 until 1 November 2016. Cancer risk in ART-conceived children was compared with risks in naturally conceived children from subfertile women (hazard ratios [HRs]) and with the general population (standardized incidence ratios [SIRs]).
The median follow-up was 21 years (interquartile range (IQR): 17–25) and was shorter in ART-conceived children (20 years, IQR: 17–23) compared with naturally conceived children (24 years, IQR: 20–30). In total, 231 cancers were observed. Overall cancer risk was not increased in ART-conceived children, neither compared with naturally conceived children from subfertile women (HR: 1.00, 95% CI 0.72–1.38) nor compared with the general population (SIR = 1.11, 95% CI: 0.90–1.36). From 18 years of age onwards, the HR of cancer in ART-conceived versus naturally conceived individuals was 1.25 (95% CI: 0.73–2.13). Slightly but non-significantly increased risks were observed in children conceived by ICSI or cryopreservation (HR = 1.52, 95% CI: 0.81–2.85; 1.80, 95% CI: 0.65–4.95, respectively). Risks of lymphoblastic leukemia (HR = 2.44, 95% CI: 0.81–7.37) and melanoma (HR = 1.86, 95% CI: 0.66–5.27) were non-significantly increased for ART-conceived compared with naturally conceived children.
Despite the large size and long follow-up of the cohort, the number of cancers was rather small for subgroup analyses as cancer in children and young adults is rare.
Overall, ART-conceived children do not appear to have an increased cancer risk after a median follow-up of 21 years. This large study provides important results, enabling physicians to better inform couples considering ART about the long-term safety of ART for their children. However, larger studies with prolonged follow-up are needed to investigate cancer risk in adults and in children conceived by ICSI and/or from cryopreserved embryos.
This work was supported by The Dutch Cancer Society (NKI 2006-3631) which funded the OMEGA-women’s cohort and Children Cancer Free (KIKA;147) which funded the OMEGA-offspring cohort. We declare no competing interests.
Introduction
The use of ART, i.e. IVF and ICSI, has strongly increased in Western countries (Calhaz-Jorge et al., 2016; Sunderam et al., 2017). Over 6 million ART-conceived children have been born, including 80 000 in The Netherlands (Calhaz-Jorge et al., 2016; Sunderam et al., 2017).
Each phase of the ART procedure, including stimulation of multiple follicles, the process of oocyte retrieval and sperm preparation, culture of embryos, cryopreservation of sperm, oocytes and embryos, and embryo transfer, is substantially different from natural conception (Buitendijk, 1999). These processes occur in the same timeframe as epigenetic programming (Iliadou et al., 2011). During the first days after conception, the pre-implantation embryo is sensitive to environmental factors as created during embryo culture which may alter fetal development, with both prenatal and postnatal consequences (Geuns et al., 2007; Ceelen et al., 2008; Market-Velker et al., 2010). Additionally, differences in methylation of several genes have been found in cord blood and placenta samples from children conceived in vitro versus in vivo (Katari et al., 2009). Altered epigenetic patterns have been found in embryos derived from animals after ART(Farin et al., 2004; Iliadou et al., 2011). Furthermore, some studies of ART-conceived children reported an unexpectedly high incidence of rare cancer predisposition syndromes such as Beckwith–Wiedemann syndrome and Angelman syndrome (DeBaun et al., 2003; Gosden et al., 2003; Maher et al., 2003; Orstavik et al., 2003).
In 2013, a systematic meta-analysis showed an increased overall cancer risk in children born after fertility treatment (relative risk: 1.33; 95% CI: 1.08–1.63) (Hargreave et al., 2013b). However, this meta-analysis concluded that it is not clear whether other factors underlying subfertility rather than the ART procedure itself are the most important factors for (childhood) cancer. Therefore, more research was recommended (Hargreave et al., 2013b). Since then, several cohort studies reported reassuring results for overall cancer risk (Williams et al., 2013, 2018; Sundh et al., 2014; Hargreave et al., 2015; Reigstad et al., 2016; Lerner-Geva et al., 2017); however, two studies found an increased overall cancer risk among offspring of women with fertility problems (Hargreave et al., 2013a; Wainstock et al., 2017). While all studies found increased risks for specific cancer types (Williams et al., 2013; Hargreave et al., 2013a, 2015; Sundh et al., 2014; Reigstad et al., 2016; Lerner-Geva et al., 2017; Wainstock et al., 2017), these findings were inconsistent across studies. Studies had relatively short follow-up (median: 10 years [range: 6.6–18.0]) and other limitations such as a small number of cases (median: 119 [range: 7–481]) or restriction to a general population comparison group (no possibility for confounding adjustment) (Williams et al., 2013, 2018; Hargreave et al., 2013a, 2015; Sundh et al., 2014; Reigstad et al., 2016; Lerner-Geva et al., 2017; Wainstock et al., 2017), precluding firm conclusions (Reigstad et al., 2017). We therefore evaluated cancer risk in ART-conceived children and young adults in the Dutch nationwide OMEGA-offspring cohort (van den Belt-Dusebout et al., 2016). This cohort is uniquely positioned to examine this important question as it includes the oldest Dutch generation of ART-conceived children and a comparison group of naturally conceived children born to subfertile women.
Materials and Methods
Study design and participants
The OMEGA-women’s cohort
A large nationwide historical cohort study (OMEGA-cohort) was initiated in The Netherlands in 1995 to examine cancer risk among women who received ovarian stimulation for ART (van Leeuwen et al., 2011; Spaan et al., 2015; van den Belt-Dusebout et al., 2016). In short, 30 838 women were identified who started ART treatment in 1983–2000 in 1 of the 12 Dutch IVF clinics.
In The Netherlands only hospitals with a certified ART lab are allowed by law to perform ART treatments. However, hospitals without an ART lab, are allowed to provide ovarian stimulation medication which is part of ART treatment. To obtain a large enough comparison group of subfertile women not treated with ART, we identified women who were diagnosed with fertility problems shortly before ART became a routine procedure for subfertile patients. The non-ART comparison group consisted of 10 013 women whose subfertility was diagnosed in the six participating clinics that had a computerized registry of all subfertile women evaluated during 1980–2000.
All women were asked to complete a risk factor questionnaire and an informed consent form for future linkage with disease registries; only 5.5% refused. In total, 62.8% women filled in the questionnaire. The questionnaire ascertained information on women’s reproductive histories (for each pregnancy ≥24 weeks: conception method, date of birth, gestational length, sex, birth weight, congenital malformations, and death), parental cause of subfertility and fertility treatment.
Additionally, information about cause of subfertility and fertility treatments was abstracted from the women’s medical records. For each ART, insemination and other fertility drug (FD) treatment date, dosage, type of FDs and outcome were recorded.
The OMEGA-offspring cohort
For the present research question, we used the Dutch Municipal Personal Records Database to identify all live-born offspring of 94.5% of all OMEGA-women, i.e. who responded or did not respond to the questionnaire. Offspring from the women who refused to participate (5.5%) could not be identified. In brief, in The Netherlands the personal record of a woman also includes information about her children. To identify all children from OMEGA-women a linkage was performed based on birthdate, name and postal code(s) of the mother, yielding complete information on dates of birth of all offspring for 99% of the cohort. Because of concerns about potential birth cohort effects on childhood cancer risk, we excluded children born before 1975, providing an equal age distribution between ART-conceived and non-ART-conceived children. After excluding children with incomplete birth dates, the cohort comprised 54 113 children. After the exclusion of children with unknown conception method (n = 1423) and adopted children (n = 4995) (see Assessment of conception method), the analytical cohort consists of 47 690 children (Fig. 1).
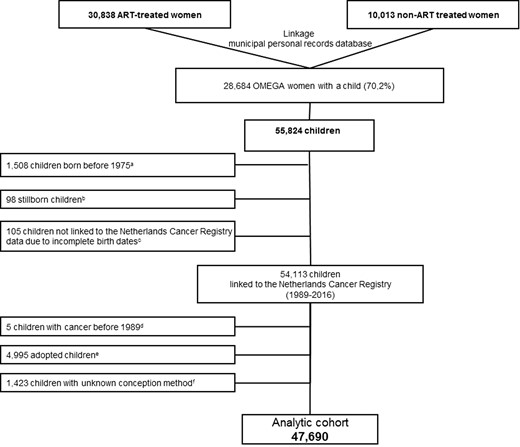
Identification of the OMEGA-offspring cohort.aChildren born before 1975 were excluded from the cohort because of potential birth cohort effects on childhood cancer risk. bStillborns were excluded from the cohort. cChildren with incomplete birth dates were excluded from the cohort. dChildren with a cancer diagnosis before 1989 (reported in the mothers’ questionnaires) were excluded from the cohort. eAdopted children were excluded from the cohort. fChildren with an unknown conception method were excluded from the cohort.
Assessment of conception method
To determine the conception method of each child the exposure status of the mother (ART-treated versus not treated by ART) was insufficient because children of ART-treated women could have been conceived by ART, FDs or naturally. In addition, children from non-ART treated women could have been conceived by FD’s or naturally. Therefore, each child’s conception method was based on data regarding pregnancies (≥24 weeks) from the mother’s questionnaires and medical records. For 70% of children, conception method was self-evident because complete information was available from a specific pregnancy reported by the mother in the questionnaire and/or, if the child was conceived by ART, about the specific ART cycle that led to the birth of the child (reported in the medical record). In the small proportion (1%) where self-reported information from the mother in the questionnaire was discrepant with that from the medical record, medical record data were used. For another 18% of children, conception method could be assigned based on the combination of birthdate of the child and first and last date of fertility treatments (ART and FD cycles (with/without intrauterine insemination)) of the mother. For example, children born before the first IVF-treatment cycle of a mother were classified as non-ART. For the remaining children with incomplete data in the questionnaires and/or medical records on dates of first and last ART-treatments and FD cycles of the mother (12%), conception method was assigned based on decision rules established by expert opinions (gynaecologists and reproductive epidemiologists) using the following variables: exposure status of the mother (ART vs non-ART), parental subfertility cause, child’s birth year and medical record information about ovulation induction and intrauterine insemination.
In total, six (mutually exclusive) exposure categories were created: children conceived (i) by IVF/ICSI/cryopreservation of embryos (ART-conceived); (ii) by FDs, with/without intrauterine insemination, but not by ART (FD-conceived (non-ART)); (iii) naturally conceived; (iv) naturally or by FDs, but not by ART (naturally- or FD-conceived (non-ART)); (v) adopted children; and (vi) children for whom the conception method remained unknown. Children with unknown conception method (n = 1423) and adopted children (n = 4995) were excluded, leaving 47 690 children for analysis (Fig. 1).
To prevent misclassification especially in the naturally conceived group, children born before 1983 (when ART was not available in The Netherlands) but for whom we could not distinguish whether they were conceived naturally or by FDs, were classified in the mixed-group ‘naturally or FD-conceived (non-ART)’. In analyses comparing ART-conceived children with non-ART children, this mixed group was classified as non-ART.
Assessment of cancer incidence
The OMEGA-offspring cohort was linked with The Netherlands Cancer Registry (NCR), under strict privacy regulations. The NCR is a national population-based registry, with 96–98% completeness from 1989 (Schouten et al., 1993). For each cancer among OMEGA children until 1 November 2016, NCR electronically provided information on date of diagnosis, topography, morphology and stage (International Classification of Diseases for Oncology (ICD-O)) (IKNL, 2016).
Statistical analysis
As the NCR did not fully cover The Netherlands before 1989, observation time for each child started on 1 January 1989 or date of birth, whichever came last. Person-years of observation were calculated until 1 November 2016, date of first cancer, or date of death, whichever came first. Deaths were ascertained from questionnaires completed by the mothers (response 62.8%) or by linkage with the digital database of the Dutch Municipal Personal Records Database. Children with a cancer diagnosis before 1989 were excluded (Fig. 1).
Cancer incidence in the OMEGA-offspring cohort was compared with that in the Dutch general population by determining the standardized incidence ratio (SIR), defined as the ratio of the observed and expected number of cancers in the study population. Expected numbers were calculated by applying the person-year distribution in the cohort to sex-, age- and calendar year-specific cancer incidence rates from NCR.
Multivariable Cox regression models, with attained age on the X-axis, were used to directly compare cancer risk between ART-conceived and naturally conceived offspring, adjusting for confounding. We defined confounders as factors which changed the risk estimate for the exposure of interest by ≥10%. Based on a priori knowledge about risk factors for childhood cancer and perinatal factors associated with ART, we tested the following variables for confounding: parental subfertility cause, maternal age, child’s birth year, birth weight, gestational length and multiple birth. Effect modification of the association between ART and cancer risk was tested for sex, parental cause of subfertility, and different age groups. Missing data in covariates were imputed. Single imputation was performed for missing data in birth weight (43.3%), gestational length (43.3%) and sex (5%), predicted by these variables and additionally multiple birth, child’s birth year and conception method. Missing parental cause of subfertility (17.8%) was imputed using conception method, child’s birth year and fertility clinic as predictors. The variables adjusted for in the analysis are provided in the footnotes to each table.
To disentangle potential associations with the in vitro procedures performed in ART treatments and associations with hormonal stimulation used in ART and other fertility treatments, different analyses were performed. The association between cancer risk and in vitro procedures was evaluated comparing cancer risk in ART children with that in non-ART children (i.e. all FD- and naturally conceived combined). To evaluate cancer risk after hormonal stimulation, cancer risk in children born after hormonal stimulation (i.e. ART- and FD-conceived combined) was compared with that in naturally conceived children.
Furthermore, risk was assessed according to various ART aspects (IVF, ICSI and cryopreservation of embryos), follow-up period, and for different cancer sites. Besides using the ICD-O, for exploratory analyses cancers were also classified according to cell type: blastoma, carcinoma, sarcoma, melanoma, lympho-haematopoietic malignancies and other.
Sensitivity analyses were performed to evaluate the influence of (i) inclusion of children with uncertain conception method (12%); (ii) inclusion of children born before 1989 (starting date NCR); and (iii) a propensity score adjustment. All tests were two-sided and a P-value of <0.05 was considered statistically significant. All statistical analyses were performed with Stata version 13.0.
Ethical approval
The participating IVF clinics and fertility clinics, the Authority for Personal Data Protection, and the NCR gave permission for the performance of this study according to the Dutch personal data protection act, by which the dataset with children’s names has been encrypted by a Trusted Third Party (ZorgTTP).
Results
Population characteristics
In total, 24 269 children were conceived by ART, 4181 by FDs with/without intrauterine insemination (non-ART), 13 761 naturally, and 5479 were conceived naturally or by FDs (non-ART). After a median follow-up of 21.0 years (IQR: 17.2–25.0), 231 cancers were observed; 93 in the ART group and 138 in the non-ART group. Follow-up was shorter in ART-conceived children (mean 19.8 years) than in naturally conceived children (mean 25.1 years) (Table I). As expected, ART-conceived children had older mothers, shorter mean gestational age, lower mean birth weight, and were more often part of a multiple birth than all other conception groups.
Characteristics of OMEGA-offspring cohort by conception method.
| ART | Non-ART | ||||
|---|---|---|---|---|---|
| ART-conceived, N = 24 269 | FD-conceived (non-ART), N = 4181 | Naturally conceived, N = 13 761 | Naturally or FD-conceived (non-ART)a, N = 5479 | Total, N = 47 690 | |
| Sex, No. (%) | |||||
| Male | 11 950 (49.2) | 2153 (51.5) | 6738 (49.0) | 2535 (46.3) | 23 376 (49.0) |
| Female | 11 092 (45.7) | 1900 (45.4) | 6623 (48.1) | 2306 (42.1) | 21 922 (46.0) |
| Unknown | 1227 (5.1) | 128 (3.1) | 400 (2.9) | 638 (11.6) | 2392 (5.0) |
| Year of birth, No. (%) | |||||
| 1975–1984 | 108 (0.5) | 103 (2.5) | 2816 (20.5) | 1052 (19.2) | 4079 (8.6) |
| 1985–1989 | 966 (4.0) | 427 (10.2) | 2626 (19.1) | 1042 (19.0) | 5061 (10.6) |
| 1990–1994 | 6923 (28.5) | 1027 (24.5) | 3316 (24.1) | 1590 (29.0) | 12 856 (27.0) |
| 1995–1999 | 10 003 (41.2) | 1503 (36.0) | 3071 (22.3) | 1144 (20.9) | 15 721 (33.0) |
| 2000–2013 | 6269 (25.8) | 1121 (26.8) | 1932 (14.0) | 651 (11.9) | 9973 (20.9) |
| Age at end of follow-upb (years), mean (SD) | 19.8 (4.2) | 20.3 (5.5) | 25.1 (7.6) | 25.2 (7.2) | 22.0 (6.4) |
| Age at end of follow-upb (years), No. (%) | |||||
| 0–9 | 204 (0.8) | 107 (2.6) | 225 (1.6) | 79 (1.4) | 615 (1.3) |
| 10–14 | 2514 (10.4) | 484 (11.6) | 1062 (7.7) | 314 (5.7) | 4374 (9.2) |
| 15–19 | 10 252 (42.2) | 1489 (35.6) | 2192 (15.9) | 859 (15.7) | 14 792 (31.0) |
| 20–24 | 8794 (36.2) | 1343 (32.1) | 3885 (28.2) | 1645 (30.0) | 15 667 (32.9) |
| 25–29 | 2264 (9.3) | 556 (13.3) | 2738 (19.9) | 1225 (22.4) | 6783 (14.2) |
| ≥30 | 241 (1.0) | 202 (4.8) | 3659 (26.6) | 1357 (24.8) | 5459 (11.5) |
| Parental cause of subfertilityc, No. (%) | |||||
| Male factor | 7048 (29.0) | 1312 (31.4) | 2285 (16.6) | 1135 (20.7) | 11 780 (24.7) |
| Tubal factor | 5783 (23.8) | 316 (7.6) | 5947 (43.2) | 0 (0.0) | 12 046 (25.3) |
| Hormonal and other factors or Unexplainedd | 7604 (31.3) | 1761 (42.1) | 4669 (33.9) | 1344 (24.5) | 15 378 (32.3) |
| Unknown | 3834 (15.8) | 792 (18.9) | 860 (6.3) | 3000 (54.8) | 8486 (17.8) |
| Birth weight (g), mean (SD) | 2904 (792) | 3182 (719) | 3344 (620) | 3222 (732) | 3099 (753) |
| Birth weight, No. (%) | |||||
| <2500 | 3942 (16.2) | 407 (9.7) | 749 (5.4) | 49 (0.9) | 5147 (10.8) |
| 2500–2999 | 3085 (12.7) | 487 (11.7) | 1487 (10.8) | 69 (1.3) | 5128 (10.8) |
| 3000–3499 | 3424 (14.1) | 875 (20.9) | 3341 (24.3) | 89 (1.6) | 7729 (16.2) |
| 3500–3999 | 2442 (10.1) | 719 (17.2) | 3053 (22.2) | 106 (1.9) | 6320 (13.3) |
| ≥4000 | 1006 (4.2) | 312 (7.5) | 1340 (9.7) | 54 (1.0) | 2712 (5.7) |
| Unknown | 10 370 (42.7) | 1381 (33.0) | 3791 (27.6) | 5112 (93.3) | 20 654 (43.3) |
| Gestational age (weeks) at birth, mean (SD) | 37.8 (3.1) | 38.9 (2.6) | 39.4 (2.2) | 39.1 (2.4) | 38.5 (2.9) |
| Multiple birth, No. (%) | |||||
| Singleton | 15 934 (65.7) | 3718 (88.9) | 13 501 (98.1) | 5269 (96.2) | 38 422 (80.6) |
| Twin | 7472 (30.8) | 415 (9.9) | 260 (1.9) | 210 (3.8) | 8357 (17.5) |
| Triplet | 835 (3.4) | 48 (1.2) | 0 (0.0) | 0 (0.0) | 883 (1.9) |
| Quadruplet | 28 (0.1) | 0 (0.0) | 0 (0.0) | 0 (0.0) | 28 (0.1) |
| Maternal age at birth of child (years), No. (%) | |||||
| <25 | 391 (1.6) | 122 (2.9) | 2542 (18.5) | 1092 (19.9) | 4147 (8.7) |
| 25–29 | 3380 (13.9) | 934 (22.3) | 3148 (22.9) | 1477 (27.0) | 8939 (18.7) |
| 30–34 | 10 306 (42.5) | 1791 (42.8) | 4255 (30.9) | 1675 (30.6) | 18 027 (37.8) |
| 35–39 | 8636 (35.6) | 1149 (27.5) | 3157 (22.9) | 1037 (18.9) | 13 979 (29.3) |
| ≥40 | 1556 (6.4) | 185 (4.4) | 659 (4.8) | 198 (3.6) | 2598 (5.5) |
FD = fertility drug.
aNaturally conceived children or children conceived by fertility drugs (FDs) with/without intrauterine insemination.
bFollow-up ended at date of any cancer diagnosis or date of completeness of cancer registry, whichever came first.
cDefined as the major cause of subfertility, based on information from medical records and on questionnaire data if no medical record information was available.
dHormonal factors include factors such as ovulation disorders, polycystic ovary syndrome and premature menopause, ‘other factors’ include factors such as endometriosis and cervical factors.
Comparisons with external reference rates
Compared with the general Dutch population, overall cancer risk was not increased in the entire OMEGA-offspring cohort (SIR = 1.06, 95% CI: 0.93–1.21) (Table II), the ART group (SIR = 1.11, 95% CI: 0.90–1.36), or the non-ART group (SIR = 1.04, 95% CI: 0.87–1.22). Furthermore, with longer follow-up the risk of cancer compared with the general population did not increase in ART-conceived children age 15–19 years (SIR = 1.14, 95% CI: 0.70–1.74) and 20–24 years (SIR = 0.93, 95% CI: 0.46–1.66) (data not shown). Non-significantly increased risks were observed in children conceived by ICSI and from cryopreserved embryos (SIR = 1.67, 95% CI: 0.89–2.86 and 1.97, 95% CI: 0.54–5.04) compared with the general population (data not shown).
Risk of cancer according to conception method compared with Dutch general population.
| Type of malignancy | ART-conceived, N = 24 269 | Naturally conceived, N = 13 761 | Totala, N = 47 690 | |||
|---|---|---|---|---|---|---|
| No. | SIR (95% CI) | No. | SIR (95% CI) | No. | SIR (95% CI) | |
| All first cancersb | 93 | 1.11 (0.90–1.36) | 92 | 1.09 (0.88–1.34) | 231 | 1.06 (0.93–1.21) |
| Bone and articular cartilagec | 12 | 1.03 (0.53–1.80) | 9 | 1.19 (0.55–2.26) | 25 | 1.03 (0.67–1.52) |
| Osteosarcoma | 5 | 2.26 (0.74–5.28) | 0 | 0.00 (0.00–2.60) | 6 | 1.31 (0.48–2.85) |
| Ewing sarcoma | 1 | 0.58 (0.02–3.25) | 2 | 2.01 (0.24–7.25) | 6 | 1.76 (0.65–3.83) |
| Skin, melanoma | 10 | 1.93 (0.92–3.54) | 9 | 0.89 (0.41–1.69) | 26 | 1.27 (0.83–1.87) |
| Breast | 1 | 1.34 (0.03–7.44) | 11 | 1.68 (0.84–3.00) | 16 | 1.60 (0.91–2.59) |
| Female genital tractd | 2 | 1.25 (0.15–4.52) | 6 | 1.44 (0.53–3.14) | 9 | 1.17 (0.53–2.21) |
| Male genital tracte | 5 | 0.85 (0.28–1.98) | 13 | 1.29 (0.69–2.20) | 22 | 1.03 (0.64–1.56) |
| Urinary tract | 5 | 1.54 (0.50–3.59) | 2 | 1.06 (0.13–3.84) | 9 | 1.40 (0.64–2.65) |
| Nephroblastomaf | 4 | 1.30 (0.36–3.34) | 1 | 0.72 (0.02–4.02) | 7 | 1.27 (0.51–2.61) |
| Eye and adnexag | 4 | 2.64 (0.72–6.76) | 0 | 0.00 (0.00–5.51) | 4 | 1.48 (0.40–3.78) |
| Brain and other parts of central nervous systemh | 8 | 0.92 (0.37–2.19) | 6 | 1.01 (0.37–2.19) | 18 | 0.97 (0.57–1.53) |
| Endocrine glands | 1 | 0.43 (0.01–2.38) | 4 | 1.34 (0.36–3.42) | 6 | 0.86 (0.32–1.88) |
| Lymphohematopoietic malignancies | 38 | 1.09 (0.77–1.50) | 25 | 1.02 (0.66–1.50) | 76 | 1.01 (0.79–1.26) |
| Hodgkin lymphoma | 9 | 1.24 (0.57–2.35) | 7 | 0.99 (0.40–2.03) | 17 | 0.92 (0.53–1.46) |
| Lymphoblastic leukemia | 17 | 1.04 (0.60–1.66) | 4 | 0.49 (0.13–1.26) | 31 | 1.01 (0.69–1.44) |
| Mature T/NK cell lymphoma | 2 | 2.61 (0.32–9.42) | 3i | 4.56 (0.94–13.33) | 5 | 2.73 (0.89–6.38) |
| Acute myeloid leukemia | 2 | 0.56 (0.07–2.02) | 5 | 1.95 (0.63–4.56) | 7 | 0.90 (0.36–1.85) |
FD = fertility drug; SIR = standardized incidence ratio.
aTotal cohort, includes ART and non-ART (non-ART includes naturally conceived children and children conceived by FDs (with/without intrauterine insemination)).
bOnly first cancers were included in the analyses. One child had a second cancer (hematologic malignancy), three children had a second cancer diagnosed at the same date as the first cancer (1x bilateral breast cancer, 1x bilateral retinoblastoma, 1x bone tumor).
cOsteosarcoma: 5x ART, 1x naturally or FD-conceived (non-ART); Ewing sarcoma: 2x naturally conceived, 1x ART, 3x naturally- or FD-conceived (non-ART); Rhabdomyosarcoma: 3x naturally conceived, 3x ART.
dCervix: 4x naturally conceived, 1x ART; Corpus uteri: 1x naturally conceived; Ovary: 1x naturally conceived, one x ART, 1x FD-conceived (non-ART).
eAll cancers were testicular cancers.
fNephroblastoma: 1x naturally conceived, 4x ART, 2x naturally or FD-conceived (non-ART).
gAll cancers were retinoblastomas.
hAll cancers were brain tumors.
iIncluding one juvenile T cell T/NK cell lymphoma.
Site-specific cancer risks were not significantly increased in the entire cohort (Table II). However, when stratifying according to conception method, risks of melanoma and retinoblastoma were non-significantly increased in ART-conceived children (SIR = 1.93, 95% CI: 0.92–3.54, based on 10 cases, and SIR = 2.64, 95% CI: 0.72–6.76, four cases, respectively), but not in naturally conceived children (SIR = 0.89, 95% CI: 0.41–1.69 and SIR = 0.0, 95% CI: 0.00–5.51, respectively) (Table II). Results from a sensitivity analysis without children for whom conception method was a bit uncertain showed comparable results (ART-conceived children without those with an uncertain conception method: SIR = 1.10, 95% CI: 0.87–1.37).
Comparisons within the cohort
We first investigated whether the in vitro procedures of ART were associated with overall cancer risk. Risk in ART-conceived children was neither increased compared with non-ART children from subfertile women (multivariably adjusted hazard ratio [aHR] = 1.10, 95% CI: 0.83–1.48), nor when compared with naturally conceived children of subfertile women (aHR = 1.00, 95% CI: 0.72–1.38) (Table III). Analyses investigating the association with hormonal stimulation showed that cancer risk in children conceived by either ART or FDs (i.e. after ovarian stimulation), compared with naturally conceived children, was also not increased (aHR:0.95, 95% CI: 0.69–1.30) (Table III). Non-significantly increased cancer risks were observed in ICSI-conceived children compared with naturally conceived children (aHR = 1.52, 95% CI: 0.81–2.85) (Table III) or with IVF-conceived children (aHR = 1.60, 95% CI: 0.87–2.93). Children conceived from cryopreserved embryos also had a non-significantly increased risk (aHRs = 1.80, 95% CI: 0.65–4.95 and 1.83, 95% CI: 0.67–4.98) compared with naturally conceived children (Table III) and with children born from fresh ART embryos, respectively. Perinatal factors, such as multiple birth, birth weight, and gestational length, were not significantly associated with cancer risk (Supplementary Table SI).
Risk of cancer according to specific conception methods; multivariable Cox regression analyses.
| Total no. | No. of cancers | Age-adjusted HR (95% CI) | Multivariably adjusted HR (95% CI)a | |
|---|---|---|---|---|
| ART versus non-ARTb,c | ||||
| ART | 24 269 | 93 | 1.10 (0.82–1.47) | 1.10 (0.83–1.48)f |
| Conception by hormonal stimulation versus naturally conceivedd | ||||
| ART or FDs | 28 450 | 106 | 0.99 (0.73–1.35) | 0.95 (0.69–1.30) |
| ART | 24 269 | 93 | 1.03 (0.75–1.42) | 1.00 (0.72–1.38) |
| FDs (non-ART) | 4181 | 13 | 0.77 (0.42–1.39) | 0.70 (0.38–1.27) |
| IVF or ICSI (ART) versus naturally conceivedd | ||||
| IVF | 21 246 | 80 | 0.99 (0.71–1.37) | 0.96 (0.69–1.34) |
| ICSI | 3023 | 13 | 1.55 (0.85–2.86) | 1.52 (0.81–2.85) |
| Type of embryo transfer (ART) versus naturally conceivedd | ||||
| Fresh | 23,600 | 89 | 1.02 (0.74–1.40) | 0.98 (0.71–1.36) |
| Cryoe | 669 | 4 | 1.85 (0.67–5.29) | 1.80 (0.65–4.95) |
FD = fertility drug; HR = hazard ratio.
Each row represents a separate regression analysis.
aAdditionally adjusted for parental cause of subfertility.
bNon-ART includes naturally conceived children and children conceived by FDs (with/without intrauterine insemination).
cReference group is non-ART: N = 23,421, n = 138.
dReference group is naturally conceived: N = 13 761, n = 92.
eThree cases in children born from cryopreserved embryos after IVF, one case in a child born after a cryopreserved embryo after ICSI.
fIn sensitivity analyses with propensity-score adjustment results were comparable when comparing cancer risk in ART-conceived children with non-ART children (HR = 1.02, 95% CI: 0.72–1.45). The propensity score for being conceived by ART (yes/no) was calculated using a mixed-effects logistic model with random intercept and fixed effects for parental cause of subfertility, the child’s year of birth, maternal age and fertility clinic.
Sensitivity analyses excluding children with uncertain conception method (12%) showed similar risk of cancer in ART- versus naturally conceived children (HR = 0.96, 95% CI: 0.68–1.36). Excluding children born before 1989 (starting date NCR) yielded a hazard ratio for ART- versus naturally conceived children of 0.81 (95% CI: 0.56–1.16). Propensity score adjustment showed similar results (HR = 1.02 95% CI: 0.72–1.45).
In analyses stratified according to attained age, cancer risk in ART-conceived children was neither increased before 18 years (HR = 0.95, 95% CI: 0.64–1.42), nor from 18 years onwards (HR = 1.25, 95% CI: 0.73–2.13), compared with naturally conceived children (Supplementary Table SII). Similar results were observed when ART-conceived children were compared with non-ART children (<18 years: HR = 1.02, 95% CI: 0.72–4.44, ≥18 years: HR = 1.31, 95% CI: 0.79–2.18) (Supplementary Table SII). Furthermore, in analyses stratified before and after age 15 or age 25, results were comparable(data not shown).
There were no significantly increased site-specific cancer risks in ART-conceived children when compared with naturally conceived children (Table IV). However, risks of lymphoblastic leukemia were non-significantly higher in ART- and FD-conceived children than in naturally conceived children. Risk of melanoma was non-significantly higher in ART-conceived children than in naturally conceived children (HR = 1.86, 95% CI: 0.66–5.27). ART-conceived boys tended to have a lower risk of testicular cancer, although not statistically significant. When cancers were classified according to cell type, HRs were non-significantly higher for blastoma and melanoma in children conceived by ART or FDs than in naturally conceived children (Supplementary Table SIII).
Risk of selected malignancies according to conception method; Cox regression analyses.
| ART-conceived, N = 24 269 | FD-conceived (non-ART), N = 4181 | Naturally conceived, N = 13 761 | |
|---|---|---|---|
| Leukemiaa | |||
| No. of cancers | 19 | 4 | 9 |
| Age-adjusted HR (95% CI) | 1.10 (0.49–2.47) | 1.36 (0.42–4.44) | 1.0 (reference) |
| Lymphoblastic leukemia | |||
| No. of cancers | 17 | 4 | 4 |
| Age-adjusted HR (95% CI) | 2.20 (0.73–6.63) | 3.05 (0.76–12.26) | 1.0 (reference) |
| Multivariably adjusted HR (95% CI)b | 2.44 (0.81–7.37) | 3.13 (0.78–12.59) | 1.0 (reference) |
| Lymphomac | |||
| No. of cancers | 15 | 0 | 12 |
| Age-adjusted HR (95% CI) | 0.98 (0.44–2.17) | – | 1.0 (reference) |
| Breast | |||
| No. of cancers | 1 | 0 | 11 |
| Age-adjusted HR (95% CI) | 0.80 (0.09–7.29) | – | 1.0 (reference) |
| Multivariably adjusted HR (95% CI)d | 0.67 (0.07–6.18) | – | 1.0 (reference) |
| Testis | |||
| No. of cancers | 5 | 3 | 13 |
| Age-adjusted HR (95% CI) | 0.39 (0.13–1.12) | 1.17 (0.33–4.16) | 1.0 (reference) |
| Multivariably adjusted HR (95% CI)e | 0.38 (0.13–1.12) | 0.93 (0.25–3.43) | 1.0 (reference) |
| Kidney | |||
| No. of cancers | 5 | 0 | 2 |
| Age-adjusted HR (95% CI) | 1.60 (0.28–9.01) | – | 1.0 (reference) |
| Multivariably adjusted HR (95% CI)d | 1.32 (0.23–7.46) | – | 1.0 (reference) |
| Brain | |||
| No. of cancers | 8 | 1 | 6 |
| Age-adjusted HR (95% CI) | 0.93 (0.31–2.80) | 0.65 (0.08–5.50) | 1.0 (reference) |
| Multivariably adjusted HR (95% CI)f | 1.37 (0.44–4.24) | 0.75 (0.09–6.33) | 1.0 (reference) |
| Melanoma | |||
| No. of cancers | 10 | 2 | 9 |
| Age-adjusted HR (95% CI) | 2.15 (0.79–5.89) | 1.83 (0.38–8.71) | 1.0 (reference) |
| Multivariably adjusted HR (95% CI)d | 1.86 (0.66–5.27) | 1.42 (0.29–6.99) | 1.0 (reference) |
FD = fertility drug; HR = hazard ratio.
aAcute myeloid leukemia and lymphoblastic leukemia.
bAdditionally adjusted for gestational length.
cHodgkin lymphoma and non-Hodgkin lymphoma.
dAdditionally adjusted for parental cause of subfertility.
eAdditionally adjusted for parental cause of subfertility and birth weight.
fAdditionally adjusted for multiple birth.
Discussion
This large-scale study with 21 years of follow-up shows that overall cancer risk in ART-conceived children is not increased, neither when compared with the general population nor when compared with naturally conceived offspring born to subfertile women. Our study is the first one to compare long-term cancer risk in ART-conceived children both with the general population and with naturally conceived offspring from subfertile women, while adjusting for confounders.
Results from this study are in line with those of recently published studies to the extent that no increased overall cancer risk was observed. However, we found non-significantly increased risks in children conceived by ICSI and/or born after cryopreservation of embryos. Because the number of cancers in these groups were small, these findings may be due to chance and must be interpreted with caution. Only three earlier studies investigated cancer risk in children born after ICSI and/or cryopreservation of embryos; no significantly increased risks were found. In a large study among 106 381 British ART-conceived children, with a short median follow-up (6.6 years), the SIR for ICSI was 1.07 (95% CI: 0.70–1.57) and after cryopreservation 1.24 (95% CI: = 0.69–2.04) (Williams et al., 2013). No comparison with naturally conceived children from subfertile women was made. In another British study among 12 137 children born after donor ART, with a short mean follow-up (7.9 years), overall cancer risk was not increased compared with the general population. Neither the risk of childhood cancer in children conceived after ICSI (SIR = 0.00, 95% CI: 0.00–1.76) nor that after cryopreservation of embryos (SIR = 0.88, 95% CI: 0.11–3.18) was increased (Williams et al., 2018). In a Swedish cohort study among 26 692 ART-conceived children, 15 cancers in ICSI-conceived children were observed while 15.5 were expected (Kallen et al., 2010). As ever more children are born through ICSI and/or cryopreservation of embryos, long-term cancer risk should be investigated in cohorts comprising larger numbers of children born through ICSI and/or cryopreservation of embryos.
In analyses according to cancer site and cell type, risks of lymphoblastic leukemia, melanoma, and blastoma were non-significantly increased in ART-conceived children compared with naturally conceived children. Compared with the general Dutch population, risks of melanoma and retinoblastoma were non-significantly increased in ART-conceived children. An increased risk of childhood leukemia was reported by seven studies (Schuz et al., 1999; Kallen et al., 2010; Petridou et al., 2012; Rudant et al., 2013; Hargreave et al., 2013a; Reigstad et al., 2016). Two out of six studies investigating risks of leukemia subtypes, found increased risks of lymphoblastic leukemia, one after ART (Petridou et al., 2012) and one after ovulation induction (Rudant et al., 2013). Literature on melanoma risk in ART-conceived children is scarce. Only one previous study reported on skin cancer in young adults born to women evaluated for infertility (HR = 1.22, 95% CI: 0.94–1.60) (Hargreave et al., 2013a). Two other studies reported the number of observed melanomas (Kallen et al., 2010) and skin cancers (Wainstock et al., 2017) but numbers were too small for statistical analysis. Therefore, more large studies are needed to further investigate risks of cancer types frequently occurring at young adult ages, such as melanoma. Since we are the first to explore cancer risk according to cell type we could not compare our results regarding a potential increase of blastoma risk with other studies.
So far, cancer risk in ART-conceived children at young adult ages could not be studied due to lack of sufficient follow-up time. Only one Danish study examined cancer risk in young adults conceived after FD use of the mother, but could not study the specific association of ART on cancer risk (Hargreave et al., 2015). Reassuringly, in analyses according to attained age in the current cohort, cancer risk in ART-conceived children from age 18 onwards (young adulthood) was not significantly higher than in naturally conceived children (HR = 1.25) or the general population.
Strengths and limitations
Strengths of this study include long and complete follow-up, a comparison group of naturally conceived children from subfertile women, and detailed information on potential confounders. Furthermore, selection bias is minimized because the Dutch Municipal Personal Records Database yielded complete information about all offspring from women included in the OMEGA study (all responding and non-responding women to the questionnaire) and cancer incidence in offspring was obtained through the national population-based NCR. Furthermore, information was available about ART and FDs, enabling the investigation of cancer risk separately for children born after FDs or ART. We could also investigate whether cancer risk was associated with hormonal stimulation used in ART and other fertility treatments or with the in vitro procedure used in ART, giving insight into potential mechanisms of cancer development in case of elevated risks. In addition, potentially increased risks of cancer due to parental subfertility were addressed in our study design, as we included a comparison group of children from subfertile women who were conceived naturally.
This study also has several limitations. First, as cancer in children and young adults is rare, the number of cancers was rather small for subgroup analyses, despite the large size and long follow-up of the cohort. Therefore, the observed non-significantly increased risks must be interpreted with caution. Second, for 12% of children the conception method could not be derived from information on pregnancies reported in the mothers’ questionnaire or medical records. Although their likely conception method could be determined based on a combination of exposure status of the mother (ART versus non-ART), parental subfertility cause, child’s birth year and medical record information about ovulation induction and intrauterine insemination, using expert knowledge about clinical practice at the time, some non-differential misclassification may have attenuated the risk estimates. Results from a sensitivity analysis restricted to children for whom conception method was known were comparable, rendering misclassification bias unlikely. In determining the likely conception method for the 12% children with partially missing data, we did not take the uncertainty into account. Multiple imputation would do so and result in wider confidence intervals, which would support our conclusion that cancer risk is not elevated. Third, the cohort includes children born from 1975 onwards while cancer registration was incomplete before 1989. Therefore, accrual of person-years and childhood malignancies started in 1989. We expected only 6.1 cancer diagnoses in our cohort before 1989 and excluded five cancer cases diagnosed before 1989 identified by the mothers’ questionnaires. Survivor bias is therefore highly unlikely. Finally, potential confounding might have affected our results since data for factors such as gestational age, birth weight, multiple birth, and parental cause of subfertility were missing for a substantial proportion of the cohort and had to be imputed. However, although mechanistic evidence is still insufficient, gestational age, multiple birth and birth weight might also be intermediate factors, i.e. adjustment might not be indicated. After multiple imputation of missing data, adjustment for some of these factors in the analyses for specific cancer sites (Table IV) slightly affected the results, i.e. the HRs increased somewhat. If these factors were mediating factors a decrease in HR would be expected. Therefore, these results do not support evidence for either strong confounding or mediation. In addition, in the main analysis perinatal factors did not influence the results at all. Only adjustment for parental cause of subfertility (with 17.8% missing data) changed the risk estimate by more than 10% but still did not affect our conclusions (Table III).
In conclusion, reassuringly, ART-conceived children do not have an increased cancer risk after a median follow-up of 21 years. This large study provides important results, enabling physicians to better inform couples considering ART about long-term safety of ART in ART-conceived children. More large studies with prolonged follow-up are needed to investigate cancer risk in adults and in children conceived by ICSI and/or from cryopreserved embryos. In addition, international pooling of studies is recommended to provide sufficient power to study risk of specific cancer sites.
Acknowledgements
The authors thank the participants of the OMEGA study, without whom this study would not have been possible. The authors thank all attending physicians for selecting patients, providing fertility treatment details and for inviting all OMEGA cohort members. The authors thank the registration team of the Netherlands Comprehensive Cancer Organization (IKNL) for the collection of data for the Netherlands Cancer Registry as well as IKNL staff for scientific advice. The authors also thank the Dutch Municipal Personal Records Database for providing offspring data.
Authors’ roles
F.E.v.L. M.S., A.W.v.d.B.D., C.W.B., M.H., C.B.L. and M.M.v.d.H.E. had full access to all of the data in the study and take responsibility for the integrity of the data and the accuracy of the data analysis. Study concept and design: F.E.v.L., C.W.B., C.B.L., M.M.v.d.H.E., M.S., A.W.v.d.B.D. and M.H. Acquisition, analysis or interpretation of data: F.E.v.L., M.H., M.S., A.W.v.d.B.D., C.W.B., C.B.L. and M.M.v.d.H.E. Drafting of the article: M.S., A.W.v.d.B.D., F.E.v.L., C.W.B., C.B.L., M.M.v.d.H.E. and M.H. Critical revision of the manuscript for important intellectual content: M.S., A.W.v.d.B.D., F.E.v.L., C.W.B., C.B.L., M.H. and M.M.v.d.H.E. Statistical analysis: M.S., A.W.v.d.B.D., M.H. and F.E.v.L. Obtained funding: F.E.v.L., C.W.B., AW.v.d.B.D., M.M.v.d.H.E. and M.S. Administrative, technical or material support: A.W.v.d.B.D., F.E.v.L. and M.S. Study supervision: F.E.v.L., C.W.B. and C.B.L.
Funding
The Dutch Cancer Society (NKI 2006-3631) funded the OMEGA-women's cohort Children Cancer Free (KIKA; 147) funded the OMEGA-offspring cohort.
Conflict of interest
We declare no competing interests.
Appendix
The OMEGA-steering group includes R. Schats (Amsterdam UMC, Vrije Universiteit Amsterdam, Amsterdam), M. Kortman (University Medical Center Utrecht, Utrecht), J.S.E. Laven (Erasmus Medical Center, Rotterdam), E.J.P. van Santbrink (Reinier de Graaf Hospital, Voorburg), L.A.J. van der Westerlaken (Leiden University Medical Center, Leiden), B.J. Cohlen (Isala Clinics, Zwolle), D.D.M. Braat (Radboud University Nijmegen Medical Center, Nijmegen), J.M.J. Smeenk (St Elisabeth Hospital, Tilburg), J.A. Land (University Medical Center Groningen, University Groningen, Groningen), M. Goddijn (Amsterdam UMC, University of Amsterdam, Amsterdam), R.J.T. van Golde (Maastricht University Medical Center, Maastricht), M.M.E. van Rumste (Catharina Hospital, Eindhoven), C.J.C.M. Hamilton (Jeroen Bosch Hospital, Den Bosch), and P.A.M. Meeuwissen (Admiraal de Ruyter Hospital, Vlissingen).
References
Author notes
OMEGA-steering group: see Appendix.
