


Abstract
What is the accuracy of preimplantation genetic testing for aneuploidies (PGT-A) when considering human peri-implantation outcomes in vitro?
The probability of accurately diagnosing an embryo as abnormal was 100%, while the proportion of euploid embryos classified as clinically suitable was 61.9%, yet if structural and mosaic abnormalities were not considered accuracy increased to 100%, with a 0% false positive and false negative rate.
Embryo aneuploidy is associated with implantation failure and early pregnancy loss. However, a proportion of blastocysts are mosaic, containing chromosomally distinct cell populations. Diagnosing chromosomal mosaicism remains a significant challenge for PGT-A. Although mosaic embryos may lead to healthy live births, they are also associated with poorer clinical outcomes. Moreover, the direct effects of mosaicism on early pregnancy remain unknown. Recently, developed in vitro systems allow extended embryo culture for up to 14 days providing a unique opportunity for modelling chromosomal instability during human peri-implantation development.
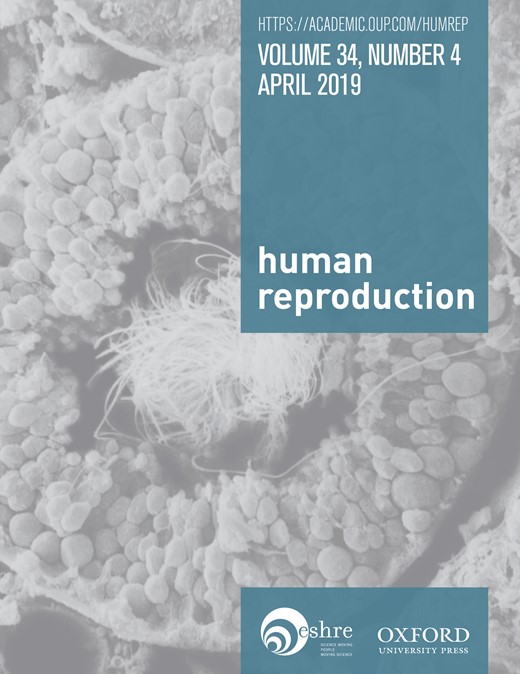
A total of 80 embryos were cultured to either 8 (n = 7) or 12 days post-fertilisation (dpf; n = 73). Of these, 54 were PGT-A blastocysts, donated to research following an abnormal (n = 37) or mosaic (n = 17) diagnosis. The remaining 26 were supernumerary blastocysts, obtained from standard assisted reproductive technology (ART) cycles. These embryos underwent trophectoderm (TE) biopsy prior to extended culture.
We applied established culture protocols to generate embryo outgrowths. Outgrowth viability was assessed based on careful morphological evaluation. Nine outgrowths were further separated into two or more portions corresponding to inner cell mass (ICM) and TE-derived lineages. A total of 45 embryos were selected for next generation sequencing (NGS) at 8 or 12 dpf. We correlated TE biopsy profiles to both culture outcomes and the chromosomal status of the embryos during later development.
Of the 73 embryos cultured to 12 dpf, 51% remained viable, while 49% detached between 8 and 12 dpf. Viable, Day 12 outgrowths were predominately generated from euploid blastocysts and those diagnosed with trisomies, duplications or mosaic aberrations. Conversely, monosomies, deletions and more complex chromosomal constitutions significantly impaired in vitro development to 12 dpf (10% vs. 77%, P < 0.0001). When compared to the original biopsy, we determined 100% concordance for uniform numerical aneuploidies, both in whole outgrowths and in the ICM and TE-derived outgrowth portions. However, uniform structural variants were not always confirmed later in development. Moreover, a high proportion of embryos originally diagnosed as mosaic remained viable at 12 dpf (58%). Of these, 71% were euploid, with normal profiles observed in both ICM and TE-derived lineages. Based on our validation data, we determine a 0% false negative and 18.5% false positive error rate when diagnosing mosaicism. Overall, our findings demonstrate a diagnostic accuracy of 80% in the context of PGT-A. Nevertheless, if structural and mosaic abnormalities are not considered, accuracy increases to 100%, with a 0% false positive and false negative rate.
The inherent limitations of extended in vitro culture, particularly when modelling critical developmental milestones, warrant careful interpretation.
Our findings echo current prenatal testing data and support the high clinical predictive value of PGT-A for diagnosing uniform numerical aneuploidies, as well as euploid chromosomal constitutions. However, distinguishing technical bias from biological variability will remain a challenge, inherently limiting the accuracy of a single TE biopsy for diagnosing mosaicism.
This research is funded by the Ghent University Special Research Fund (BOF01D08114) awarded to M.P., the Research Foundation—Flanders (FWO.KAN.0005.01) research grant awarded to B.H. and De Snoo-van’t Hoogerhuijs Stichting awarded to S.M.C.d.S.L. We thank Ferring Pharmaceuticals (Aalst, Belgium) for their unrestricted educational grant. The authors declare no competing interests.
N/A.
Introduction
Human preimplantation development is remarkably vulnerable to error, leading to the high frequency of chromosomal abnormalities observed in human embryos. Insight into this vulnerability has been obtained following the implementation of preimplantation genetic testing for aneuploidies (PGT-A) in conjunction with ART. Aberrant chromosomal constitutions have been reported in up to 75% of Day 3 embryos (Mertzanidou et al., 2013) and are as high as 50% in blastocysts (Harper et al., 2012). The vast majority of these abnormalities end in implantation failure or early pregnancy loss, as observed in up to 50% of all first trimester miscarriages (van den Berg et al., 2012). However, the application of next generation sequencing (NGS) for PGT-A has led to an increase in reports of chromosomal mosaicism in trophectoderm (TE) biopsies (Sachdev et al., 2016; Vera-Rodriguez and Rubio, 2017). Although mosaic embryos may lead to healthy live births (Greco et al., 2015; Spinella et al., 2018), they have also been linked to poorer clinical outcomes compared to euploid blastocysts (Maxwell et al., 2016; Munné et al., 2017). However, the developmental capacity of mosaic blastocysts has thus far only been evaluated based on clinical outcome data (Greco et al., 2015; Munné et al., 2017; Spinella et al., 2018) and no blinded, non-selection studies have been performed to assess the true predictive value of reporting mosaicism in regards to IVF outcomes. Balancing the unknown risks of transferring mosaic blastocysts with the possibility of discarding viable embryos continues to raise uncomfortable uncertainty. Nevertheless, chromosomal mosaicism is currently routinely diagnosed in many PGT-A centres worldwide. Moreover, mosaic embryos are prioritised for transfer with respect to abnormality involved, as well as the degree of mosaicism reported.
Current clinical data point to the findings of Bolton et al., 2016 based on a mouse model of chromosomal mosaicism. Here, mosaic mouse blastocysts demonstrated normal developmental potential if they contained a sufficient number of euploid cells, resulting in viable, normal pups and never mosaic mice (Bolton et al., 2016). However, the timing of developmental events and regulation of the cell cycle differ in mouse and human (Rossant and Tam, 2017). Additionally, the mouse model relied on artificially induced chaotic abnormalities, which are incompatible with life. It thus remains unclear whether a mosaic, single chromosome aberration, as seen in human, would lead to similar outcomes. Moreover, outcomes of mosaic trisomies leading to live birth even when present in all cells of the embryo, remain to be investigated (Munné and Wells, 2017).
Newly established embryo culture systems allow blastocyst attachment, outgrowth formation and extended culture for up to 14 days in vitro (Deglincerti et al., 2016; Shahbazi et al., 2016), providing a unique opportunity for investigating chromosomal instability during early human post-implantation development. Here, we use an extended in vitro embryo culture protocol to investigate the effects of chromosomal aberrations and blastocyst mosaicism on the early peri-implantation, up to 12 days post-fertilisation (dpf). While a consensus regarding the clinical management of embryo mosaicism remains difficult to attain, examining the potential implications of specific mosaic aberrations may enhance diagnosis. Moreover, evaluating chromosomal instability during these, so far, hidden stages of embryogenesis may provide valuable insights into the predictive value of reporting mosaicism in clinical practice, ultimately enhancing the embryo selection process and improving clinical outcomes.
Materials and Methods
Ethical permission
This study was approved by the Ghent University Institutional Review Board (EC2017/584) and the Belgian Federal Commission for medical and scientific research on embryos in vitro (ADV_075_UZGent). All embryos used for this research were donated with patients’ written informed consent, following cryopreservation.
Embryo source
Our study included blastocysts donated following PGT-A, as well as standard IVF/ICSI cycles. A total of 80 embryos from 51 patients were included in the analysis. Maternal age ranged from 23 to 42 years (with a mean of 32.84 years). PGT-A was performed within the Department for Reproductive Medicine in collaboration with the Center for Medical Genetics, Ghent University Hospital.
Blastocyst warming and biopsy
Blastocysts vitrified on Day 5 or Day 6 of development were warmed using the Vitrification Thaw kit (Irvine Scientific, Netherlands), as previously described (Van Landuyt et al., 2011). Embryos were cultured in Cook Blastocyst Medium (COOK, Ireland) in 25μL drops under mineral oil (Irvine Scientific, Netherlands) at 37°C, 6% CO2 and 5% O2 (balance N2). Blastocysts obtained from standard ART cycles underwent laser-assisted biopsy, as per Deleye et al. (2015b), prior to plating. Biopsy procedures were performed on an Olympus IX73 microscope, fitted with a LYKOS laser (Hamilton Thorne, MA, USA). To assist TE herniation, the zona pellucida was breached using a series of laser pulses, following embryo warming. Biopsied samples were processed for whole genome amplification (WGA) and subsequent NGS, as described below.
Blastocyst grading
Blastocyst quality was evaluated prior to plating using the Gardner and Schoolcraft grading criteria (Gardner and Schoolcraft, 1999).
Extended embryo culture and sample processing
All blastocysts were plated at 6 dpf. When required, embryos were briefly exposed to pre-warmed Acidic Tyrode’s Solution (Sigma-Aldrich, Belgium) for removal of the zona pellucida. After washing, individual blastocysts were plated, per well, in an eight-well IbiTreat μ-plate (Ibidi, GmbH). Embryos were cultured using an in vitro extended culture protocol, based on previously described methods (Deglincerti et al., 2016; Shahbazi et al., 2016). However, all cultures were performed in hypoxic conditions (5%). Additionally, the medium was supplemented with 100 ng/mL of Activin A for the entire duration of the extended culture (6 to 12 dpf).
Of the 80 embryos plated, 54 were PGT-A blastocysts, donated to research following an abnormal (n = 37) or mosaic (n = 17) diagnosis, while the remaining 26 were supernumerary blastocysts, obtained from standard ART cycles (Fig. 1). Outgrowth viability was carefully assessed based on morphological analysis. Nine outgrowths were further separated into two or more portions, corresponding to inner cell mass (ICM) and one or more TE-derived samples. A stem cell cutting tool (Vitrolife, Sweden) was used to perform the microdissection. Both entire outgrowths and embryo portions were used for further chromosomal testing.
Study design. A total of 80 embryos were cultured for either 8 or 12 days post-fertilisation (dpf). Of these, 54 blastocysts underwent preimplantation genetic testing for aneuploidy (PGT-A) and were donated to research following an abnormal or mosaic diagnosis, while 26 were supernumerary blastocysts, obtained from standard ART cycles. The latter underwent blastocyst biopsy prior to extended culture. Nine outgrowths were further separated into inner cell mass (ICM) and trophectoderm (TE)-derived portions. A total of 45 embryos were selected for next generation sequencing (NGS) at 8 or 12 dpf.
Next generation sequencing and analysis
We have previously shown that our NGS platform can be efficiently applied for the detection of both numerical, as well as structural chromosomal aberrations in human embryos, at a resolution of ~4.5 Mb (Deleye et al., 2015a, 2015b). Moreover, we have validated our sequencing platform for the detection of mosaicism present in as low as 3 out of 10 cells, at a resolution >10 Mb (Popovic et al., 2018). As such, WGA and NGS was performed as previously described (Deleye et al., 2015b; Popovic et al., 2018).
Per sample, our platform generated an average of ~5.5 million uniquely mapped DNA sequence reads. We have previously demonstrated that this number of reads is more than sufficient for the accurate detection of aberrations for PGT-A (Deleye et al., 2015b). Our data analysis was performed using the QDNAseq algorithm, as previously described (Scheinin et al., 2014). This algorithm divides the genome into fixed-sized non-overlapping windows and counts the number of sequence reads that map within each window. These counts are used to calculate a ratio to perform a median centralisation and a simultaneous two-dimensional LOESS correction for sequence mappability and GC content. Finally, these ratios are log2 transformed, ultimately resulting in the log2 relative copy numbers values (log2(CN)) used in the manuscript. The QDNAseq algorithm improves on previous methods by creating a ‘blacklist’ of problematic genome regions based on the ENCODE Project Consortium, particularly regions with known repeat elements, such as satellites, centromeric and telomeric repeats (Scheinin et al., 2014). The QDNAseq algorithm is incorporated into the Vivar software, which we apply for further analysis (Sante et al., 2014). All sequencing results were analysed in 500 kb windows, previously determined to give the best trade-off between sensitivity and specificity (Deleye et al., 2015b). Analysis was restricted to aberrations >10 Mb in size and performed based on thresholds established from our NGS validation data (Popovic et al., 2018). Analysis of chromosomal profiles of the outgrowths and embryo portions was performed blindly with respect to the original TE biopsy.
Immunohistochemistry
Prior to commencing the study, several viable embryos were fixed at 12 dpf with 4% paraformaldehyde for 20 min at room temperature. Embryo outgrowths were permeabilised with 0.2% Triton X-100 (Sigma-Aldrich, the Netherlands) and blocked in 10% foetal calf serum (Thermo Fisher Scientific, the Netherlands) and 1% bovine serum albumin (Sigma-Aldrich, the Netherlands). Primary antibodies used were mouse anti-POU5F1 (sc-5279, Santa Cruz, 1:250) and rabbit anti-GATA6 (sc-9055, Santa Cruz, 1:250), while secondary antibodies included Alexa Flour 555 donkey anti-rabbit (A-31572, Thermo Fisher Scientific, 1:500) and Alexa Fluor 488 donkey anti-mouse (A-21202, Thermo Fisher Scientific, 1:500). Outgrowths were counterstained with 1 μg/ml 4′,6-diamidino-2-phenylindole (DAPI, Vector Laboratories).
Embryo Imaging
Brightfield images of blastocysts and embryo outgrowths were taken on an Olympus IX73 inverted microscope (Olympus, Belgium). Fluorescence images were obtained on a Leica TCS SP8 inverted confocal microscope (Leica, Germany), equipped with a white light laser and LAS X software. Z-stack images were acquired with 2μm spacing, at Airy 1-unit pinhole, at 12 bits in 1024 × 1024 pixels and at 200 Hz laser frequency. Z-stack images were processed using Fiji (version 2.0.0-rc43/1.5k) (Schindelin et al., 2012).
Statistical analysis
Fisher’s Exact test (two-sided) was used for evaluating the association of blastocyst quality, as well as blastocyst chromosomal profiles and culture outcomes. Both R (v3.5.0) (R Foundation for Statistical Computing, Vienna, Austria) and GraphPad Prism (v6.01) (GraphPad Software, San Diego, CA, USA), were used for evaluating statistical significance. All P-values < 0.05 were considered significant.
Results
Extended embryo culture: modelling human peri-implantation in vitro
A total of 80, good-quality blastocysts (≥ 5BB) were plated and cultured until 8 or 12 dpf (Fig. 1, Table I). Embryos were maintained in hypoxic conditions during the entire culture period, representative of the maternal environment during peri-implantation. It has been well-established that low oxygen concentrations improve ART outcomes (Bontekoe et al., 2012). Furthermore, we supplemented cultures with Activin A. Activins have been shown to be important regulators of implantation, embryogenesis and embryo viability in vivo (Refaat and Ledger, 2011). We validated our extended in vitro culture protocol prior to commencing the study, confirming phenotypes associated with early post-implantation development, including the formation of epiblast and hypoblast-like structures (Supplementary Figure S1A).
Overview of chromosomal profiles and culture outcomes for all blastocysts used in the study.
| Blastocyst number | Blastocyst grade | Blastocyst profile | Outgrowth profile | Culture outcome, 12 dpf |
|---|---|---|---|---|
| E1 | 5AA | Euploid | Euploid | Attached |
| E2 | 5AA | Euploid | Euploid | Attached |
| E3 | 5AA | Euploid | Attached | |
| E4 | 5BB | Euploid | Attached | |
| E5 | 6AA | Euploid | Euploid | Attached |
| E6 | 6AA | Euploid | Euploid | Attached |
| E7 | 6BA | Euploid | Detached | |
| E8 | 6BA | Euploid | ICM + TE derived: Euploid | Attached |
| E9 | 5AA | Euploid | Detached | |
| E10 | 5BB | Euploid | Euploid | Attached |
| E11 | 5BA | Euploid | Euploid | Attached |
| E12 | 6AA | Euploid | Euploid | Attached |
| E13 | 5AB | Euploid | Detached | |
| E14 | 5AA | Euploid | Euploid | Attached |
| E15 | 5BA | Euploid | Euploid | Attached |
| E16 | 5AA | Euploid | Euploid | Attached |
| E17 | 5AA | Euploid | Euploid | Attached |
| E18 | 5BB | Euploid | Attached | |
| E19 | 5BB | Euploid | Euploid | Attached |
| PGT1 | 5AB | Trisomy 16 | ICM + TE derived: Trisomy 16 | Attached |
| PGT2 | 6AB | Trisomy 22 | Attached | |
| PGT3 | 5BB | Trisomy 22 | Attached | |
| PGT4 | 6BA | Trisomy 21 | Trisomy 21 | Attached |
| PGT5 | 6AA | Trisomy 22 | ICM + TE derived: Trisomy | Attached |
| PGT6 | 6AB | Trisomy 19 | Detached | |
| PGT7 | 5AA | Trisomy 16 | ICM + TE derived: Trisomy 16 | Attached |
| PGT8 | 5AA | Trisomy 22 | Trisomy 22 | Attached |
| PGT9 | 6AA | Trisomy 22 | Attached | |
| PGT10 | 5BA | 11q dup (17.5 Mb) | 11q dup (17.5 Mb) | Attached |
| E20 | 5BA | 3p dup (27.0 Mb) | Euploid | Attached |
| PGT11 | 6BB | 7q dup (68.5 Mb) | Detached | |
| PGT12 | 6AB | 1q dup (102.0 Mb) | ICM + TE derived: Euploid | Attached |
| PGT13 | 5BA | 2q del (mosaic) (72.5 Mb) | ICM + TE derived: Euploid | Attached |
| PGT14 | 5AB | 3p del (mosaic) (80.5 Mb) | Euploid | Attached |
| PGT15 | 6AA | 2p del (mosaic) (35.0 Mb) | Euploid | Attached |
| PGT16 | 5AA | Monosomy 14 (mosaic) | Detached | |
| E21 | 5AB | Trisomy 3 (mosaic) | ICM + TE derived: Trisomy 3 | Attached |
| E22 | 5AB | 7q del (mosaic) (18.0 Mb) | Detached | |
| PGT17 | 5BB | Monosomy 18 (mosaic) | Detached | |
| E23 | 5BA | Trisomy 4 (mosaic) | Monosomy 4 (mosaic) | Attached |
| PGT18 | 5BB | Monosomy 7 (mosaic) | Monosomy 7 | Detached |
| PGT19 | 6AA | Trisomy 5 (mosaic) | ICM + TE derived: Euploid | Attached |
| PGT20 | 6BB | Trisomy 11 (mosaic), 9q dup (mosaic) (69.5 Mb) | Euploid | Attached |
| PGT21 | 5AA | Trisomy 20 (mosaic), Monosomy 14 (mosaic) | Detached | |
| PGT22* | 6BB | Trisomy 1 (mosaic), Trisomy 16 (mosaic) | Euploid | |
| E24 | 6BA | Monosomy 2, Monosomy 1 (mosaic) | Detached | |
| PGT23 | 5AB | Trisomy 11, Monosomy 3 (mosaic) | Trisomy 11 | Detached |
| PGT24 | 5BA | Monosomy 21, 7q del (mosaic) (65.5 Mb) | Detached | |
| PGT25 | 5AB | Monosomy 16, Trisomy 15 (mosaic) | Monosomy 16 | Detached |
| PGT26 | 5AA | Monosomy 22, Trisomy 5 (mosaic) | Monosomy 22 | Attached |
| PGT27 | 5BB | Trisomy 21, Trisomy 22, 5p dup (mosaic) (141.0 Mb), 5q del (mosaic) (39.0 Mb) | ICM + TE derived: Trisomy 21, 22 | Attached |
| PGT28* | 5AB | 1p dup (118.5 Mb), 6q dup (mosaic) (55.5 Mb) | 1p dup (118.5 Mb) | |
| PGT29* | 6AA | 11q dup (79.0 Mb), 11p del (mosaic) (47.5 Mb) | Euploid | |
| PGT30 | 5BA | Monosomy 14 | Detached | |
| PGT31 | 5AA | Monosomy 8 | Detached | |
| PGT32 | 5AA | Monosomy 2 | Detached | |
| PGT33 | 5BB | Monosomy 10 | Detached | |
| PGT34 | 5BA | Monosomy 14 | Detached | |
| E25 | 5BA | Monosomy 16 | Monosomy 16 | Attached |
| PGT35* | 5AA | Monosomy 13 | Monosomy 13 | |
| PGT36 | 5BB | Monosomy 4 | Monosomy 4 | Detached |
| PGT37 | 6AA | Monosomy 22 | Detached | |
| PGT38 | 5BB | Monosomy 9 | Detached | |
| PGT39 | 6AA | Monosomy 16 | Detached | |
| PGT40 | 5BA | 10q del (22.0 Mb) | 10q del (22.0 Mb) | Detached |
| PGT41* | 5AB | 1p del (118.0 Mb) | 1p del (118.0 Mb) | |
| PGT42 | 5BA | Trisomy 15, Trisomy 21 | Trisomy 15, Trisomy 21 | Detached |
| PGT43 | 5BB | Trisomy 5, Trisomy 15 | Trisomy 5, Trisomy 15 | Detached |
| PGT44 | 6AB | Chaotic profile | Detached | |
| E26 | 6AA | Chaotic profile | Detached | |
| PGT45 | 5BA | Trisomy 13, Monosomy 21, 16p del (20.5 Mb) | Detached | |
| PGT46 | 5AA | 2q dup (54.0 Mb), 3p del (72.0 Mb) | Detached | |
| PGT47 | 6AA | 1q del (36.0 Mb), 20p dup (28.0 Mb) | Detached | |
| PGT48 | 5AA | 1q del (36.0 Mb), 20p dup (28.0 Mb) | Detached | |
| PGT49 | 5BB | Trisomy 16, 2p del (187.5 Mb), 3p dup (125.5 Mb) | Detached | |
| PGT50 | 5BB | Monosomy 5, Monosomy 22 | Detached | |
| PGT51 | 5BA | Monosomy 18, Monosomy 22 | Detached | |
| PGT52 | 5AB | Monosomy 7, Trisomy 15 | Detached | |
| PGT53* | 5BB | Monosomy 4, Trisomy 19 | Monosomy 4, Trisomy 19 | |
| PGT54* | 6AA | 3q del (74.5 Mb), 10q dup (30.5 Mb) | 3q del (74.5 Mb), 10q dup (30.5 Mb) |
Embryo numbers starting with ‘E’ denote blastocysts donated following standard ART cycles. Embryo numbers starting with ‘PGT’ denote blastocysts donated following PGT-A. Embryos cultured until 8 days post-fertilisation are indicated with (*). dup = duplication, del = deletion, Mb = megabase.
All plated blastocysts formed outgrowths by 8 dpf. Viable embryos remained attached during the in vitro culture and displayed morphologies comparable to early stages of cavitation, as previously described (Shahbazi et al., 2016). Based on morphological analysis, we were able to confidently distinguish ICM and TE-derived phenotypes in nine embryos (Supplementary Figure S1B). Of the total embryos cultured until 12 dpf, 51% (37 out of 73) remained attached. These embryos showed good developmental progression and were viable at 12 dpf. The remaining embryos (49%) displayed considerable signs of cell death and degeneration and detached between 8 and 12 dpf (Supplementary Figure S1C). We observed no significant difference in regard to ICM nor TE quality and culture outcomes (P = 0.6418 and P = 0.6378, respectively).
Blastocysts presenting with euploid profiles, chromosomal gains and mosaicism were more likely to remain viable at 12 dpf
Of the total embryos plated from both blastocyst groups, 73 were cultured to 12 dpf (Fig. 1, Table I). Of these, 36 originally presented with either one (n = 24) or multiple aberrations (n = 12), while 18 were reported as mosaic. The latter were diagnosed with either one (n = 10) or multiple (n = 2) mosaic abnormalities, or both uniform (complete) and mosaic aberrations (n = 6). Additionally, 19 previously untested blastocysts were determined to be euploid (Table I).
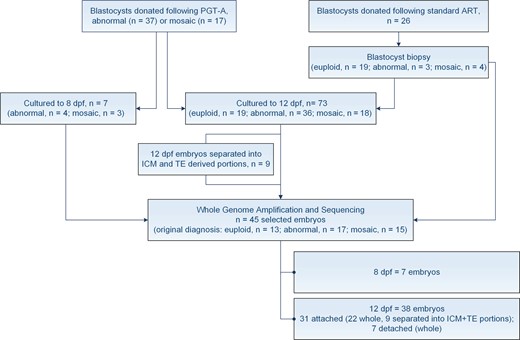
We further correlated 12 dpf outgrowth viability to the chromosomal status of the plated blastocysts (Table I, Fig. 2). Viable 12 dpf outgrowths were predominantly generated from euploid blastocysts, as well as those diagnosed with trisomies, duplications or mosaic aberrations (34 out of 44 attached, 77%). Conversely, monosomies, deletions and chromosomal constitutions consisting of multiple aberrations, significantly impaired in vitro embryo development to 12 dpf (3 out of 29 attached, 10%; P < 0.0001) (Fig. 2).
Blastocyst chromosomal profiles related to culture outcomes. Euploid blastocysts and those presenting with chromosomal gains and mosaicism were significantly more likely to remain viable 12 days post-fertilisation (dpf), compared to blastocysts with chromosomal losses or multiple aberrations.
Sensitivity and specificity of NGS for detecting chromosomal mosaicism
We have previously demonstrated that SurePlex amplified samples show a high overall accuracy for calling copy number variations (CNVs; Deleye et al., 2015a). Nevertheless, representation bias, particularly of GC-content rich genomic regions is known to hinder NGS analysis (Capalbo et al., 2017). In addition, we have shown that the size of the aberration has a major impact on the likelihood that its log2 relative copy number value will lie outside the determined thresholds for calling CNVs (Deleye et al., 2015a; Popovic et al., 2018). We previously validated our sequencing platform for the detection of mosaicism present in as low as 3 out of 10 cells, at a resolution >10 Mb (Popovic et al., 2018). We further used this data to examine the sensitivity and specificity of detecting mosaicism with our approach (Goodrich et al., 2017). Samples were blinded and reassessed. Results were then evaluated for consistency with the expected chromosomal constitutions, taking into account pre-determined thresholds for calling mosaicism. Sensitivity, the ratio of samples determined to be abnormal for the correct chromosome was 100% (21 out of 21), with a 0% false negative error rate. Furthermore, specificity, the proportion of samples accurately diagnosed as euploid for all chromosomes expected to be normal, was determined to be 81.5% (22 out of 27), with a 18.5% false positive error rate.
Uniform numerical aneuploidies and euploid profiles were always verified later in development, but structural variants were not always concordant
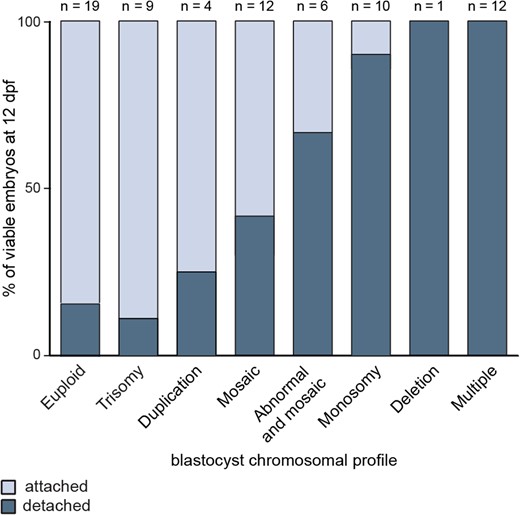
We determined 100% concordance between uniform numerical aneuploidies diagnosed at the blastocyst stage and at both 8 and 12 dpf (Table I). This applied to whole outgrowths and those for which lineage-specific profiles were obtained (Table I, Supplementary Fig. S2). ICM and TE-derived samples were concordant to each other in all instances. Moreover, euploid chromosomal complements were always confirmed in the outgrowth. Remarkably, however, for two embryos at 12 dpf, we observed no evidence of a uniform structural aberration reported in the TE biopsy. In the first instance, the blastocyst presented with a 27,Mb, 3p duplication, however a euploid profile was observed at 12 dpf (Table I, Fig. 3A). Similarly, we could not confirm a 102 Mb, 1q duplication for embryo PGT12 at 12 dpf. In this case, both the ICM and two TE-derived embryo portions all presented with euploid profiles (Table I, Fig. 3B). Finally, a third blastocyst diagnosed with a 79,Mb, 11q duplication and a 11p mosaic deletion also presented with a euploid profile at 8 dpf (Table I, Fig. 3C).
Uniform structural variants diagnosed at the blastocyst stage, but not confirmed 8 or 12 days post-fertilisation (dpf). Blue bars indicate duplications, red bars indicate deletions. M = million (A) Results for embryo E20. 1 = Blastocyst profile, 2 = 12 dpf embryo outgrowth profile. Profiles for chromosome 3 show a uniform 3p26p24.1, 27.0 Mb duplication at the blastocyst stage, while a euploid profile was observed at 12 dpf. (B) Results for embryo PGT12. 1 = Blastocyst profile, 2 = 12 dpf, inner cell mass (ICM)-derived embryo outgrowth portion. 3 and 4 = 12 dpf, trophectoderm (TE)-derived embryo outgrowth portions. Profiles for chromosome 1, reveal a uniform 1q21.1q44, 102.0 Mb duplication diagnosed at the blastocyst stage and euploid profiles for both ICM and TE-derived embryo portions. (C) Profiles for chromosome 11, embryo PGT29, reveal a 47.5Mb mosaic 11p15.5p11.2 deletion in addition to a uniform 79.0Mb, 11q11q25 duplication at the blastocyst stage, while a euploid profile was observed at 8 dpf.
Embryos originally diagnosed as chromosomally mosaic were often viable, presenting with euploid profiles as early as 8 dpf
Interestingly, a high proportion of embryos originally diagnosed with mosaicism remained viable at 12 dpf (7 out of 12, 58%). Markedly, of these, 71% (5 out of 7) presented with normal profiles, including two embryos that were separated into ICM and TE-derived portions (Table I, Fig. 4). All 12 dpf embryo segments were euploid. Similar outcomes were observed for both numerical and structural CNVs (Table I, Fig. 4A, B, Supplementary Fig. S5). Furthermore, we could not confirm mosaicism in any 12 dpf outgrowths generated from blastocysts diagnosed with both uniform and mosaic aberrations. Here, only uniform abnormalities were detected at 12 dpf (Fig. 4C). As expected, embryos within this group showed reduced developmental potential (Fig. 2, Table I). Our analysis of a further seven blastocysts sequenced at 8 dpf revealed similar results (Table I). We observed no evidence of chromosomal heterogeneity in any of the 8 dpf embryos originally diagnosed as mosaic (Table I, Supplementary Fig. S3A,B). Most of the blastocysts investigated were low-grade mosaics, however euploid profiles were also observed when the degree of mosaicism exceeded 50% (Supplementary Fig. S3A). Interestingly, this embryo presented with two mosaic aneuploidies (Supplementary Fig. S3A).
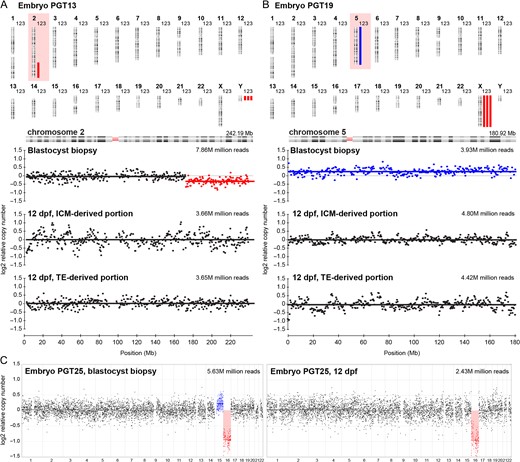
Mosaicism at the blastocysts stage not detected 12 days post-fertilisation (dpf). Blue bars indicate duplications, red bars indicate deletions. 1 = Blastocyst profile, 2 = 12 dpf, inner cell mass (ICM)-derived embryo outgrowth portion. 3 = 12 dpf, trophectoderm (TE)-derived embryo outgrowth portion. M = million (A) Results for embryo PGT13. Profiles for chromosome 2, reveal a 2q31.1q37.3, 72.5Mb mosaic deletion, while both ICM and TE-derived 12 dpf embryo portions show euploid profiles. (B) Results for embryo PGT19. Profiles for chromosome 5, reveal a mosaic trisomy 5, while euploid profiles were observed for both ICM and TE-derived portions of the embryo outgrowth at 12 dpf. (C) Line graph sequencing results for embryo PGT25. The blastocyst biopsy profile revealed a mosaic trisomy 15 in addition to a uniform monosomy 16. Only the monosomy 16 can be detected at 12 dpf.
In some instances, however, mosaicism at the blastocyst stage led to further chromosomal instability during development (Table I). Two such embryos remained viable at 12 dpf. The first presented with a mosaic trisomy 3 at the blastocyst stage, while this aberration was present in all cells at 12 dpf, in both embryonic lineages (Fig. 5A). The second blastocyst was originally diagnosed with a mosaic trisomy 4 and showed a reciprocal mosaic monosomy 4 at 12 dpf (Fig. 5B). Finally, non-viable embryos (n = 5) commonly presented with mosaic monosomies or deletions at the blastocyst stage (Table I, Supplementary Fig. S4). We often observed that embryos showing higher levels of mosaicism were more likely to detach during culture, although not in all cases (Supplementary Fig. S4).
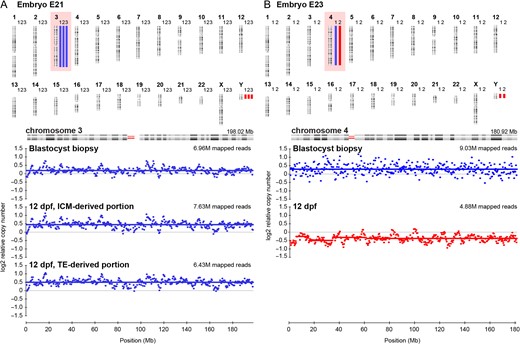
Mosaicism confirmed 12 days post-fertilisation (dpf). Blue bars indicate duplications, red bars indicate deletions. M = million (A) Results for embryo E21. 1 = Blastocyst profile, 2 = 12 dpf, inner cell mass (ICM)-derived embryo outgrowth portion. 3 = 12 dpf, trophectoderm (TE)-derived embryo outgrowth portion. Profiles for chromosome 3 reveal a mosaic trisomy 3, while both ICM and TE-derived 12 dpf embryo portions show a uniform trisomy 3. (B) Results for embryo E23. 1 = Blastocyst profile, 2 = 12 dpf outgrowth profile. Profiles for chromosome 4, reveal a mosaic trisomy 4, while a reciprocal mosaic monosomy 4 was observed at 12 dpf.
PGT-A demonstrates high sensitivity, however a proportion of euploid embryos remain inadvertently diagnosed as clinically unsuitable
Based on our sequencing data, we further evaluated sensitivity and specificity in the context of PGT-A. To estimate the diagnostic accuracy of a TE biopsy in predicting the chromosomal constitution of the embryo outgrowth at 8 or 12 dpf, we used classifications such as true positive (abnormal embryo outgrowth, abnormal TE biopsy), true negative (normal embryo outgrowth, normal TE biopsy), false negative (abnormal outgrowth, normal TE biopsy) or false positive (normal embryo outgrowth, abnormal TE biopsy). Sensitivity, the probability to accurately diagnose an embryo as abnormal from a TE biopsy was 100% (19 out of 19). However, specificity, the proportion of accurately diagnosed euploid embryos classified as clinically suitable was 62% (13 out of 21), revealing a relatively high false positive rate of 38% (8 out of 21). Of these, 67% were diagnosed as chromosomally mosaic (6 out of 9). Yet, the remaining 33% (3 out of 9) presented with a uniform aberration in the TE biopsy. Overall, our findings demonstrate a diagnostic accuracy of 80% for PGT-A. Nevertheless, if structural and mosaic abnormalities are not considered, accuracy increases to 100%, with a 0% false positive and false negative rate.
Discussion
In the present study we use an extended in vitro embryo culture system to provide novel insights into cytogenetic (in)stability during human peri-implantation development. Good-quality blastocysts, biopsied on Day 5 or 6, were plated and cultured in vitro until 8 or 12 dpf. To assess the impact of chromosomal aberrations on embryogenesis, several outgrowths were selected for NGS and correlated to their original diagnosis. To our knowledge, this is the first study to assess the fate of chromosomally abnormal and mosaic human embryos cultured until 12 dpf in vitro, using a high-resolution sequencing approach.
Despite the high frequency of genetic instability observed in preimplantation embryos, the incidence of chromosomal aberrations becomes significantly reduced during gestation. It is thus widely recognised that most abnormalities are incompatible with live birth. During preimplantation development, both trisomies and monosomies occur at a relatively similar frequency, most commonly affecting chromosomes 22, 16, 21, 18 and 15 (Fragouli et al., 2013). However, tissues from early miscarriages rarely show chromosomal losses, while the prevalence of trisomies remains fairly similar to that observed in preimplantation embryos (Rodriguez-Purata et al., 2015). It has thus been postulated that monosomies lead to very early pregnancy loss (Goddijn and Leschot, 2000). As seen in our study, embryos with trisomies 16, 21 and 22 all remained viable at 12 dpf, while those presenting with monosomies were significantly more likely to detach after Day 8. In accordance with prenatal data, our findings suggest lethality of autosomal monosomies at the time of implantation or shortly thereafter. We reveal similar outcomes for structural aberrations, with embryos diagnosed with duplications more likely to develop to 12 dpf compared to those with deletions. Furthermore, all embryos diagnosed with multiple aberrations were non-viable at 12 dpf, attesting to the higher genetic burden of more complex chromosomal constitutions.
As with uniform abnormalities, prenatal specimens show a reduced incidence of chromosomal mosaicism (van Echten-Arends et al., 2011). The higher frequency of blastocyst heterogeneity reported with the advent of NGS, has thus raised substantial controversy surrounding both the diagnosis of mosaicism, as well as the implantation potential of mosaic embryos. Goodrich et al., 2017 determined variable accuracy for detecting mosaicism across several NGS analysis platforms. Our results also illustrate the technical limitations of NGS for accurately reporting mosaicism, with a misdiagnosis rate of ~18%. Distinguishing biological variability from possible technical artefacts, including amplification bias, DNA degradation and S-phase artefacts undoubtedly confounds the diagnosis of mosaicism (Capalbo et al., 2017). Although NGS allows scaling, WGA remains the limiting factor in achieving higher resolution with low DNA input (Deleye et al., 2015b). These aspects must be acknowledged and potentially contribute to an overestimation of chromosomal mosaicism in clinical practice. Our previous findings comparing chromosomal profiles of different portions of the blastocyst, uncovered a high sensitivity in the context of PGT-A (Popovic et al., 2018). Our current data support this evaluation. All aberrations observed at 8 and 12 dpf were accurately diagnosed at the blastocyst stage, confirming the high reliability of PGT-A as a tool to select euploid embryos suitable for transfer, showing no false negative results. However, a proportion of euploid embryos remain inadvertently diagnosed as clinically unsuitable. False positive diagnoses (n = 9) were either attributed to a mosaic (6 out of 9) or structural aberration reported in the TE biopsy (3 out of 9). Although the finding of mosaicism is generally valid, overestimation will in part inevitably contribute to the reduced specificity reported. Nevertheless, attempting to accurately identify and categorise mosaic blastocysts based on a single TE biopsy also remains fundamentally unattainable due to the complex nature of chromosomal heterogeneity itself, leading to sampling bias (Popovic et al., 2018).
Current data regarding clinical outcomes following the transfer of mosaic embryos remain exceptionally scarce, with just over 100 pregnancies and 50 live births reported to date (Greco et al., 2015; Fragouli et al., 2017; Lledó et al., 2017; Spinella et al., 2018). We show that some blastocysts reported as mosaic generated viable euploid outgrowths, as early as 8 dpf. Our findings correlate to clinical data, reporting comparable implantation rates for single, double and structural mosaic gains and losses (Munné et al., 2017). Although, we observed, that embryos with mosaic monosomies detached more readily in vitro. This was the case regardless of the degree of mosaicism originally reported, possibly indicative of the added pressure of the extended in vitro culture system. Overall, however, mosaic blastocysts diagnosed with a higher percentage of abnormal cells were more likely to be non-viable at 12 dpf. Clinical data suggest that the load of abnormal cells may impact the developmental fate of mosaic blastocysts (Fragouli et al., 2017; Spinella et al., 2018). Similarly, Bolton et al., 2016 reveal that mosaic embryos containing a sufficient proportion of euploid cells developed normally. Our findings may suggest the depletion of abnormal cells in the embryo outgrowths. Aneuploidy is known to decrease the rate of cell proliferation (Sheltzer and Amon, 2011). Nevertheless, the rate of mosaicism in a TE biopsy does not always reflect the rate of mosaicism for the entire blastocyst (Popovic et al., 2018). As multiple samples obtained from the same outgrowth showed concordant results in all instances, we cannot exclude the possibility that altered log2 relative copy number values may in some cases result from amplification bias, leading to over- or under-represented regions in the genome. With an aim to provide a framework for clinical care, guidelines for prioritising mosaic embryos for transfer were recently issued in two position statements (PGDIS, 2016; CoGEN, 2017). Our data uphold these guidelines, however, we reveal that thorough validation prior to diagnosing mosaicism in a clinical setting is vital.
In some instances, we observed that a mosaic diagnosis may be indicative of further genomic instability during peri-implantation. For one embryo, we observed a low-grade mosaic trisomy 3 at the blastocyst stage, while we detected this aberration in all cells, in both embryonic lineages. In this case, the possibility of misdiagnosis is relatively low. Reports of trisomy 3 are rare in blastocysts (Rodriguez-Purata et al., 2015), hence viability is likely to be compromised prior to the blastocyst stage of development, if a uniform aberration is present. Moreover, while WGA can introduce a representation bias for smaller genomic segments, under-representation of an entire chromosome is very unlikely (Deleye et al., 2015a). For a further embryo, we observed reciprocal mosaic abnormalities at the blastocyst stage and 12 dpf. Reciprocal chromosomal errors reveal strong evidence of a mitotic non-disjunction event, a striking example of embryo mosaicism. Here, we reveal that the reciprocal aberration associated with a higher level of risk may persist within the embryo, ultimately leading to negative clinical outcomes. Nonetheless, studying human peri-implantation events remains exceptionally challenging. Established models omit the requirement of endometrial tissues and hence do not account for trophoblast-endometrial interactions. Additionally, estimating mosaicism will inevitably be influenced by the number of cells analysed. Our embryo outgrowths contain numerous cells, therefore detecting low levels of mosaicism, when a significantly higher number of euploid cells are present, will not be possible.
Overall, our findings demonstrate that distinguishing technical bias from biological variability in a TE biopsy will remain a challenge with current WGA protocols. This will inherently limit the accuracy of diagnosing mosaicism in clinical practice. As such, a certain proportion of euploid embryos will inevitably be reported as clinically unsuitable, while a portion of mosaic blastocysts will lead to negative clinical outcomes following transfer. Our findings stress that comprehensive validation of NGS platforms, as well as rigorous data interpretation is imperative when reporting chromosomal mosaicism. In addition, modelling genetic instability in vitro may deliver a more fundamental approach for evaluating the clinical implications of chromosomal mosaicism, serving as a prelude to future follow-up studies of clinical outcomes. Above all, the biological and methodological drawbacks of diagnosing mosaicism must be recognised and carefully communicated to all patients undergoing PGT-A.
Acknowledgements
We thank all patients of the Department for Reproductive Medicine, Ghent University Hospital, for donating their cryopreserved embryos for this study. We further wish to thank Machteld Baetens, Tine De Pretre and Melek Yörük for their assistance in the sequencing experiments. This research has been conducted through a collaboration with the Bimetra biobank, a high-quality bio-repository for the Ghent University Hospital and Ghent University.
Authors’ roles
M.P. contributed to the conception and design of the study, performed experiments, acquired and analysed data and wrote the article. L.D., J.T., A.D. and B.M. analysed data. M.B. and S.M.C.d.S.L. assisted in the establishment and validation of the extended in vitro embryo culture system. Critical revisions were given by P.D.S., S.M.C.d.S.L, B.M. and B.H. All authors contributed to the interpretation of the results and reviewed the article.
Funding
This research is funded by the Ghent University Special Research Fund, Bijzonder Onderzoeksfonds (BOF01D08114) awarded to M.P., the Research Foundation—Flanders (FWO.KAN.0005.01) research grant awarded to B.H. and De Snoo-van ‘t Hoogerhuijs Stichting awarded to S.M.C.d.S.L. We would like to thank Ferring Pharmaceuticals (Aalst, Belgium) for an unrestricted educational grant. The authors declare no competing interests.
Conflict of interest
None declared.
References
Author notes
B. Menten, and B. Heindryckx authors contributed equally to the study.
