


ABSTRACT
Are there differences in the proteomic profile of exosomes isolated from seminal plasma of normozoospermic (NSP) and severe asthenozoospermic (SA) men, potentially contributing to sperm features?
A relevant group of proteins known to positively regulate sperm functions were over-represented in seminal exosomes of NSP men, i.e. cysteine-rich secretory protein-1 (CRISP1), while the inhibitory protein glycodelin was enriched in exosomes of SA subjects.
Exosomes are secreted along the male reproductive tract and are thought to be involved in spermatozoa maturation and function. Ejaculated spermatozoa are still able to capture exosomes; exosomes of NSP individuals improve sperm motility and prompt capacitation, while exosomes of SA men fail to exert similar features.
Semen samples from NSP and SA men, aged 18 to 55 and registered at a single IVF center, were considered for this study project. Subjects were subdivided into three groups: a discovery cohort (five NSP men and six SA patients), a validation cohort (seven NSP and seven SA men) and the ‘glycodelin analysis’ cohort (20 NSP and 37 SA men). Exosomes were purified from semen of every participant.
Exosomes were characterized by nanoparticle tracking analysis, transmission electron microscopy and western blot. Comprehensive proteomics analysis of the exosomal proteome was performed by nanoscale liquid chromatographic tandem mass spectrometry analysis. Funrich software was used to determine statistical enrichment of pathways, networks and Gene Ontology terms of the identified proteins. Validation of differentially expressed proteins was performed through ELISA and western blot analysis.
The comprehensive proteomic analysis identified a total of 2138 proteins for both groups. There were 89 proteins found to be differentially expressed in exosomes of NSP versus SA subjects, of which 37 were increased in the NSP group and 52 were increased in the SA group. One-third of the exosomes-associated proteins highly expressed in NSP samples were involved in the reproductive process; conversely, the over-expressed proteins in exosomes of SA samples were not functionally specific. Quantitative data were confirmed on seminal exosomes from different cohorts of subjects.
N/A
Transfer of the proteins from exosomes to spermatozoa has been only partially demonstrated and up-take mechanisms are still poorly defined.
Seminal exosomes carry proteins that are potentially able to either favour or inhibit the reproductive process in humans. A better understanding of these phenomena might pave the way for novel intervention measures in terms of male infertility.
This study was funded by the Italian Ministry of Health through an Institution Seed Grant. None of the authors has any competing interests.
Introduction
The molecular mechanisms involved in sperm maturation are still largely unknown; over the last decades, extracellular vesicles (EVs) secreted along the male reproductive tract have been demonstrated to be involved in the process (Machtinger et al., 2016; Simon et al., 2018; da Silveira et al., 2018). EVs are multifaceted carriers containing a plethora of molecules including proteins, nucleic acids and lipids (Lotvall et al., 2014). The presence of EVs in the seminal fluid was originally described by Ronquist in the 1970s (Ronquist et al., 1977; Ronquist et al., 1978) and such vesicles were called prostasomes, because of their principal identified origin. However, the prostate, epididymis and other compartments of the male reproductive tract have been shown to release EVs that eventually can be retrieved from seminal fluid (Sullivan et al., 2007; Aalberts et al., 2013a; Belleannee et al., 2013). Significant discrepancies can be found in the literature concerning the biological functions of vesicles in human seminal plasma (Machtinger et al., 2016; Simon et al., 2018). Pons-Rejraji et al. (2011), for instance, it was reported that prostasomes participate in avoiding premature sperm capacitation and acrosome reaction. In contrast, other in vitro evidence has shown that prostasomes may contribute to both capacitation and acrosome reaction (Arienti et al., 1999; Bechoua et al., 2011; Park et al., 2011). Our group has recently demonstrated that seminal EVs, mostly characterized as exosomes, could prompt sperm capacitation through an increased induction of tyrosine phosphorylation, therefore inducing the acrosome reaction (Murdica et al., 2019).
Given these potential effects on sperm function, several studies have been carried out to elucidate the content of human seminal EVs. In this context, Utleg et al. (2003) identified 139 proteins obtained from healthy men by using microcapillary high-performance liquid chromatography tandem mass spectrometry (LC-MS). Subsequently, Poliakov et al. (2009) were able to investigate the structure of prostasomes by cryo-electron microscopy and their proteomic analysis led to the identification of 440 proteins. Thereafter, Ronquist et al. (2013) performed proteomic studies comparing prostasomes from four difference species, demonstrating that they are able to produce extracellular ATP and thus to activate G protein-coupled receptors (Neary et al., 1991) or ion channels (Bean, 1992) involved in the process of sperm acrosome exocytosis (Florman et al., 1998) and in the interaction of prostasomes with spermatozoa (Ronquist et al., 1990; Ronquist et al., 2013). Likewise, Dubois et al. (2015) reported a comprehensive liquid chromatography-tandem MS profiling of proteins in lipid rafts derived from seminal exosomes (SEs), identifying more than 370 lipid raft-associated proteins. More recently, Yang et al. (2017) performed a comprehensive proteomics analysis of exosomes derived from the seminal plasma of a pool of six healthy donors, identifying as many as 1474 proteins. Surprisingly, all these previous studies have been performed on seminal EV samples without any evaluation of the sperm parameters but assuming a normal condition. Only 54 proteins were found in common among the major above-mentioned studies (Poliakov et al., 2009; Ronquist et al., 2013; Dubois et al., 2015; Yang et al., 2017). To the best of the current knowledge, only García-Rodríguez et al. (2018) have compared protein expression patterns between prostasomal pools obtained from normozoospermic and dyspermic men; in this context, they observed that 7 and 36 proteins were either significantly over- or under-expressed in prostasomes from dyspermic men, respectively, as compared with those of normozoospermic individuals.
Despite the unquestionable scientific support of all these latter studies, little is known about the difference in terms of protein content of SEs from normozoospermic versus severely asthenozoospermic men. Therefore, our study was aimed to: (i) determine potential discrepancies of the proteomic content of SEs between normozoospermic and severe asthenozoospermic white-Caucasian men and (ii) define the role of SEs in different reproductive processes in human beings.
Materials and Methods
Patients enrolment and ethics statement
Men, aged 18–45 years, undergoing semen analysis at a single IVF center (for any reason) were considered for the specific purposes of the study. Men with a severe asthenozoospermia (SA) or a normal semen analysis, i.e. normozoospermia (NSP), were enrolled. Patients with known varicocele, genitourinary inflammation, seminal tract infections and smokers were excluded. Fresh semen samples were evaluated according to the 2010 guidelines of the World Health Organization (WHO, 2010; Cooper et al., 2010). Subjects were subdivided into three groups: a discovery cohort (five NSP men and six SA patients), a validation cohort (seven NSP and seven SA men) and the ‘glycodelin analysis’ cohort (20 NSP and 37 SA men). All the experiments were performed in accordance to the principles set out in the World Medical Association Declaration of Helsinki. The study was approved by the Institutional ethical committee and subjects provided written informed consent (Prot. 2016 - Mummy Sperm).
Isolation of exosomes from human seminal plasma
Fresh samples were obtained from every participant after at least two days of sexual abstinence (Cooper et al., 2010), allowed to liquefy at 37°C for 30 min and then processed immediately according to the 2010 guidelines of the WHO (WHO, 2010; Cooper et al., 2010). Exosomes were isolated by employing a protocol based on sequential centrifugation and ultracentrifugation, in order to separate them from microvesicles (MVs) (Murdica et al., 2019). Briefly, to isolate exosomes, samples were centrifuged at 800×g for 15 min at 25°C to separate spermatozoa. Seminal plasma was then centrifuged at 10 000×g for 30 min at 4°C to remove cell debris and other impurities like macroparticles. Supernatants were in turn centrifuged at 20 000×g for 90 min to pellet MVs. Remaining supernatants were ultra-centrifuged at 200 000×g for 120 min and exosome-containing pellets were washed with PBS, ultra-centrifuged again, then re-suspended in PBS and utilized.
Nanoparticle tracking analysis
To evaluate the size distribution and concentration of vesicles, nanoparticle tracking analysis (NTA) was performed on isolated vesicles using a NanoSight LM10-HS microscope (NanoSight Ltd., Amesbury, UK), as previously described (Zarovni et al., 2015). Briefly, three 60 s videos were recorded for each sample, with camera level set at 16 and detection threshold set at 10. Videos were analysed with NTA software version 2.3 that allows defining both the concentration and size of measured particles. The NanoSight system was calibrated with polystyrene latex microbeads of 50, 100 and 200 nm (Thermo Scientific Waltham, MA, USA) prior to analysis and auto-settings were used to define the blur, minimum track length and minimum expected particle size. Samples were used at ~1000-fold starting dilution with concentrations adjusted, if necessary, in order to specifically fit the optimal working range of the instrument particle tracking analysis (i.e. 20 particles per frame).
Transmission electron microscopy
Exosomes, freshly purified from seminal plasma, were absorbed on glow discharged carbon-coated formvar copper grids, washed with water, contrasted with 2% uranyl acetate and air-dried. Grids were observed with a Zeiss LEO 512 transmission electron microscope. Images were acquired by a 2k × 2k bottom-mounted slow-scan Proscan camera controlled by EsivisionPro 3.2 software.
Western blot analysis
Samples of 10–30 μg of isolated exosomes were lysed in reducing Laemmli buffer and boiled for 5 min at 95°C. In particular, 10 μg of isolated exosomes were used for the detection of tetraspanins, 20 μg was used for ALIX, TSG101, prostate-specific antigen (PSA) and flotillin and 30 μg was used for TGM4, CRISP1 and glycodelin, respectively. For tetraspanins detection, non-reducing sample buffer was used. Proteins were resolved by sodium dodecyl sulphate–polyacrylamide gel electrophoresis on the basis of equivalent quantity of proteins per lane and electro-transferred onto a nitrocellulose membrane. Non-specific sites were blocked with 5% (w/v) skimmed milk in T-TBS (Tris-buffered saline: 150 mM NaCl, 20 mM TrisHCl, pH 7.4 and 0.5% Tween 20). Membranes were incubated overnight at 4°C with the following antibodies: anti-CD63 (1:20000; BD Pharmingen, #556019, San Jose, CA, USA), anti-CD81(1:5000; BD Pharmingen, #555675, San Jose), anti-ALIX (1:500, Santa Cruz, #sc-271975, Santa Cruz, CA, USA), anti-TSG101 (1:500, Novus Bio, #NB200-112, Littleton, CO, USA), anti-PSA (1:1000), anti-flotillin (1:1000, GeneTex, #104769), anti-TGM4 (1:1000, ThermoFisher, #PA5-72495, Rockford, USA), anti-CRISP1(1:1000, Abcam, #ab74785, Abcam Inc., Cambridge, UK) and anti-glycodelin (1:1000, Novus Bio, #NBP1-89782, Littleton, CO, USA).
After washing with T-TBS, membranes were incubated with goat anti-mouse (1:10000–1:50000) or anti-rabbit (1:2000) IgG conjugated to horseradish peroxidase for 45 min. Positive immunoreactive bands were detected by the enhanced chemiluminescence method (ImmobilonTM HRP substrate, #WBKLS0500, Millipore Corp., Billerica, MA, USA).
After antibody detection, amido black (Sigma, #A8181) staining was performed following manufacturer’s indications, to detect total proteins on blot transfer membranes. Proteins appear as dark blue bands on membranes, which, after digitalization with a Kodak Image station 440 documentation system (Kodak), were quantified by using ImageJ v1.48 software (http://imagej.nih.gov).
Proteomics analysis
Exosomes from male seminal fluid of patients were lysed with 8 M Urea 100 mM Tris–HCl pH 8 buffer, proteins were quantified by BCA assay and 30 μg samples were in-solution digested (Osti et al., 2019). Samples were injected in duplicate on an nLC–ESI–MS-MS quadrupole Orbitrap QExactive-HF mass spectrometer (Thermo Fisher Scientific). Peptides separation was achieved on a linear gradient from 100% solvent A (2% ACN, 0.1% formic acid) to 30% solvent B (80% acetonitrile, 0.1% formic acid) over 62 min and from 30 to 60% solvent B in 5 min at a constant flow rate of 0.25 μl/min on UHPLC Easy-nLC 1000 (Thermo Fisher Scientific) connected to a 25 cm fused-silica emitter of 75 μm inner diameter (New Objective, Inc.), packed in-house with ReproSil-Pur C18-AQ 1.9 μm beads (Dr Maisch Gmbh).
Descriptive statistics table of the whole cohort of participants.
| Discovery cohort | Validation cohort | Glycodelin analysis cohort | |||||||||
|---|---|---|---|---|---|---|---|---|---|---|---|
| Characteristic | NSP | SA | P-value NSP vs SA | NSP | SA | P-value NSP vs SA | FERT | NSP | SA | P-value FERT vs SA | P-value NSP vs SA |
| Whole samples (n) | 5 | 6 | 6 | 7 | 12 | 20 | 37 | ||||
| Age (years) | 36.4 ± 9.9 | 39.0 ± 9.6 | 0.67 | 37.3 ± 9.9 | 41.1 ± 9.2 | 0.5 | 33.4 ± 3.8 | 36 ± 9.9 | 35.8 ± 9 | 0.4 | 0.9 |
| pH | 7.6 ± 0.3 | 7.8 ± 0.4 | 0.32 | 7.5 ± 0.3 | 7.7 ± 0.3 | 0.3 | 7.7 ± 0.3 | 7.7 ± 0.3 | 7.8 ± 0.3 | 0.3 | 0.06 |
| Abstinence (day) | 3.6 ± 0.5 | 3.0 ± 1.1 | 0.30 | 4.5 ± 1.4 | 4.0 ± 1.6 | 0.6 | 2.8 ± 0.9 | 3.9 ± 1.3 | 4.1 ± 1.7 | 0.05 | 0.5 |
| Volume (ml) | 3.7 ± 1.3 | 3.3 ± 0.7 | 0.56 | 4.2 ± 0.8 | 3.0 ± 1.2 | 0.1 | 3.2 ± 1.6 | 4.2 ± 1.4 | 3.4 ± 1.9 | 0.8 | 0.1 |
| Motility (%) | 80.2 ± 5.3 | 11.8 ± 4.3 | 1.91E-09* | 72.2 ± 8.3 | 15.9 ± 8.2 | 9.2E-08* | 44.0 ± 12.3 | 65.7 ± 9.5 | 17.3 ± 8.4 | 1.4E-18* | 1.09E-26* |
| Viability (%) | 73.8 ± 8.0 | 67.0 ± 8.0 | 0.19 | 80.7 ± 8.9 | 66.6 ± 16.5 | 0.1 | 66.4 ± 13.2 | 81.8 ± 6.3 | 54.8 ± 17.2 | 1.36E-03* | 4.73E-09* |
Characteristics from patients and semen samples from which exosomes were isolated are reported: discovery cohort (five NSP men and six SA patients), validation cohort (six NSP and seven SA men) and the ‘glycodelin analysis’ cohort (20 NSP, 37 SA and 12 FERT). Keys: NSP = normozoospermic; SA= severe asthenozoospermic; FERT= fertile men. Data presented as mean ± standard deviation. Asterisks indicate statistically significant differences (P-value < 0.001).
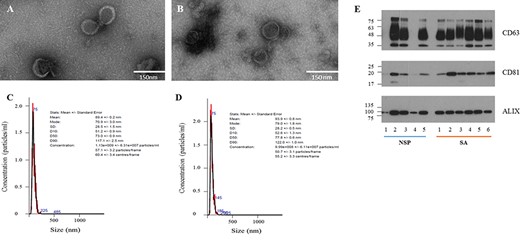
Characterisation of seminal fluid-derived exosomes from different patients. TEM images of exosomes isolated from NSP (A) and SA (B) men; scale bar: 150 nm. Representative NTA plots of exosomes from NSP (C) and SA (D) men. (E) Biochemical characterisation of seminal fluid-derived exosomes: western blot analysis shows the presence of different canonical exosomal markers (CD63, CD81 and ALIX) in NSP and SA populations.
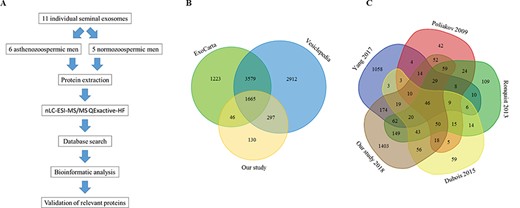
Proteomic comparison of SEs anaysed in this and other studies. (A) Workflow for the processing of exosomes derived from seminal plasma of 11 donors for a comprehensive proteomic analysis. (B) Venn diagram depicting proteins detected in the present study and overlapping with ExoCarta and Vesiclepedia databases. (C) Venn diagram comparing our identified proteins with previously published data from other four studies.
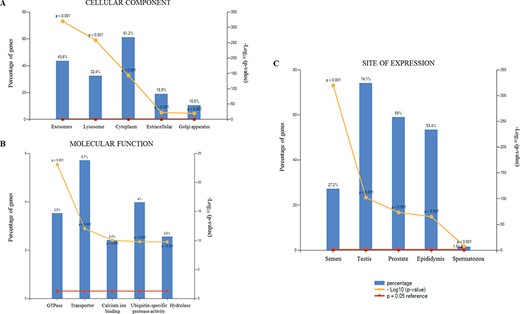
The GO analysis of the 2138 proteins identified in SEs in the present study. (A) cellular component, (B) molecular function and (C) site of expression.
MS data were acquired using a data-dependent top 15 method for HCD fragmentation. Survey full scan MS spectra (300–1650 Th) were acquired in the Orbitrap with 60 000 resolution, AGC target 3e6, IT 20 ms. For HCD spectra, resolution was set to 15 000 at m/z 200, AGC target 1e5, IT 80 ms; NCE 28% and isolation width 1.2 m/z.
For quantitative proteomics, raw MS files were processed with MaxQuant (version 1.5.2.8) using label-free quantification, searching against the database Uniprot_cp_human_setting trypsin specificity, up to two missed cleavages, cysteine carbamidomethyl as fixed modification, methionine oxidation and protein N-terminal acetylation as variable modifications. The peptides and protein FDR were set to 0.01; the minimal length required for a peptide was six amino acids, and a minimum of two peptides and at least one unique peptide were required for high-confidence protein identification. The lists of identified proteins were filtered to eliminate reverse hits and known contaminants.
Label-free quantification (LFQ) intensity were imported into Perseus (version 1.5.0.31) applying imputation and Z-score transformation. Statistical analysis was performed using t-test, Benjamini–Hochberg correction, FDR 0.05 (Cox et al., 2014).
Gene Ontology, Funrich and String Network analysis
The Funrich software was used to verify statistical over-representation of pathways, networks and Gene Ontology (GO) terms, such as biological processes and cellular components of the proteins found. The Kyoto Encyclopedia of Genes and Genomes (KEGG) pathway (http://www.genome.jp/kegg/pathway.html) was used to evaluate other categorical annotations. The threshold for significance was set at an adjusted P-value of 0.05 after correcting for multiple testing by Benjamini and Hochberg FDR correction to obtain enriched components. The PANTHER (version 9.0, http://www.pantherdb.org) and STRING (version 10, http://string-db.org) softwares were used to obtain functional annotation and characterisation of identified proteins.
ELISA
ELISA (BIOSERV DiagnCox c) was used for the quantitative determination of glycodelin, following manufacturer’s indications. SE samples (4 μg/50 μl) were loaded in duplicates and incubated for 90 min at room temperature, followed by the addition of 50 μl of the enzyme conjugate solution (monoclonal anti-glycodelin antibody conjugated to horseradish peroxidase). After 30 min incubation at room temperature, 100 μl of chromogenic substrate solution (solution of tetramethylbenzidine) were added for 15 min at room temperature. The reaction was stopped with 100 μl 0.25 M H2SO4 and absorbance at 450 nm was measured using a plate reader. Plates were washed five times with Milli-Q water after each step. A standard curve was established by a glycodelin standard ranging from 3 ng to 100 ng (provided by the kit).
Statistical analysis
For nLC–ESI–MS-MS data, statistical analysis was performed using Student’s t-test. Results were filtered using the Benjamini–Hochberg procedure for FDR correction (FDR <0.05) (Cox et al., 2014). Two-way ANOVA followed by Bonferroni multiple comparison post-tests were used to determine significance of western blot and ELISA data. Differences were considered statistically significant for P-values <0.05. All results are expressed as mean ± SEM.
Results
Isolation and characterisation of exosomes derived from the seminal plasma
Table I details the descriptive statistics of the whole cohort of participants. As expected, groups showed comparable features, only differing in terms of progressive sperm motility, which was significantly decreased in SA men. A comprehensive characterisation of purified exosomes was performed: NSP and SA samples analysed by transmission electron microscopy displayed the classica round-shape, electron-dense vesicles, of ~50–150 nm diameter (Fig. 1A–B). Nanoparticle tracking analysis confirmed that all vesicles fell into the dimensional range of exosomes with no significant differences between NSP and SA men. Moreover, the size distribution overlapped between the groups (Fig. 1C–D). Purified exosomes showed the typical protein markers CD63, CD81 and ALIX (Fig. 1E); these proteins were usually expressed in a comparable manner between groups. The total protein content was used as loading control (Supplementary Fig. S1).
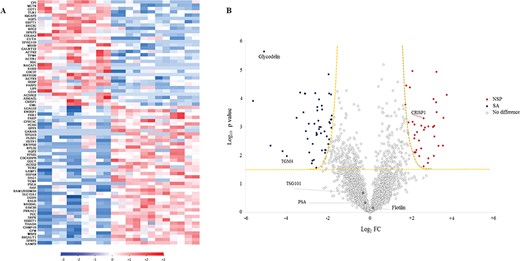
Exosomes derived from the seminal fluid of NSP and SA men displayed significant differences in their proteomic profile. (A) Heat map of supervised hierarchical clustering of differentially expressed proteins detected in each individual sample. Blue, increased expression relative to SEs from SA men; red, increased expression relative to SEs from NSP men; white, no difference in expression. (B) Volcano plot showing significantly differentially expressed proteins. The data for all proteins are plotted as log2 fold change (FC) versus the −log10 of the adjusted P-value. Thresholds are shown as dashed lines. Proteins selected as significantly different are highlighted as blue dots if over-represented in exosomes from SA patients or red dots if over-represented in exosomes derived from NSP men. White dots: no difference in expression. Named proteins have been evaluated in the validation phase.
Comprehensive proteomics analysis of exosomal proteome
The flowchart in Fig. 2A details the analysis performed on semen samples. By employing nLC-MS/MS, the proteomic analysis identified a total of 2138 proteins for both groups. Of these, 1665 proteins overlapped between the ExoCarta and Vesiclepedia databases (Fig. 2B). Among the proteins shared between the two groups, several exosomal markers, including CD63, CD9, CD81, flotillin, ALIX and TSG101, were found to be quantitatively comparable in SEs of NPS and SA patients (Supplementary Table SI).
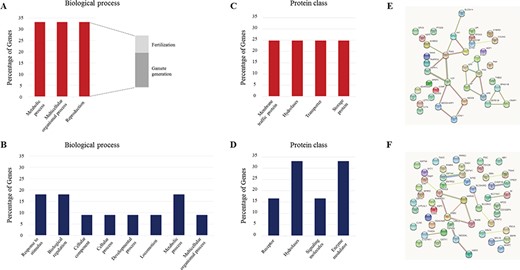
The GO analysis of the 89 differentially expressed proteins in SEs from SA and NSP men identified in the study. (A) Biological process and (C) protein class of the 37 overexpressed proteins in SEs from the NSP group. (B) Biological process and (D) protein class of the 52 overexpressed proteins in SEs from the SA group. STRING protein–protein interaction (with known and predicted functional partners) in SEs from NSP (E) and SA (F) groups are displayed.
Subcellular origins of the identified proteins were then evaluated by functional-enrichment analysis in order to determine cellular components (Fig. 3A), molecular function (Fig. 3B) and site of expression (Fig. 3C). Since exosomes derived from seminal plasma originate from several cell types throughout the male genital tract, we analysed the site of localisation of these proteins. Indeed, the top five sites of localisation were represented by semen, testis, prostate, epididymis and by spermatozoa themselves, though with a minor contribution for the latter (Fig. 3C).
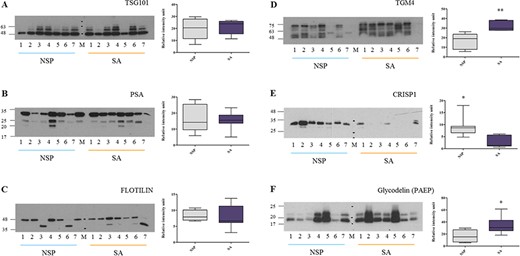
Validation of the proteomic results by western blot analysis. The presence of TSG101, PSA, flotillin, TGM4, glycodelin and CRISP1 in SEs derived from seven NSP and seven SA men was analysed by western blot. Bands intensity of TGM4, CRISP1 and glycodelin were normalised to total protein content (revealed by amido black staining, see Supplementary Fig. S2) and quantified by using ImageJ software. Box and Whisker plot shows minimum, 25th percentile, 50th percentile (median), 75th percentile and maximum values of the quantified bands. Two-way ANOVA followed by Bonferroni post-tests were used to determine significance: **P < 0,01 and *P<0,05.
Proteomic profile of SEs derived from NSP and SA men
The comparative analysis of the SE proteins shared by NSP and SA patients revealed 89 proteins differentially expressed (Supplementary Table SII), of which 52 were increased and 37 were reduced in SA versus NSP samples, respectively (Fig. 4). In detail, every protein was evaluated in a technical replicate and a two-tailed, two-sample t-test was used to compare protein levels between SEs of the case (SA) and the control group (NSP). Results were filtered using the Benjamini–Hochberg procedure for FDR correction (FDR <0.05). The comparative visualisation of the levels of the differentially expressed proteins in each individual sample was displayed in heat maps (Fig. 4A). A different pattern of protein expression was evident between SEs of NSP and SA men (Fig. 4A). Figure 4B depicts the findings of the volcano plot analysis; the –Log10 of adjusted P-value was plotted against the differential protein expression (log2 of fold change) of the means between SEs of NSP and SA subjects. This plot showed significantly dysregulated proteins. Among all, cysteine-rich secretory protein-1 (CRISP1), sperm associated antigen 11B (SPAG11B) and defensin B126 (DEFB126), which are known to positively regulate sperm-specific functions, were among the proteins most strongly enriched in SE samples from NSP men; conversely, glycodelin (PAEP) and TGM4, were among the more represented proteins in SE from SA subjects. To gain further insight in the pathways that are represented by the 89 differentially expressed proteins, they were sorted into categories according to their ontology as determined with GO annotation terms, such as biological process (Fig. 5A–B) and protein class (Fig. 5C–D). The annotated biological processes in exosome-associated proteins in SA individuals were related to processes such as ‘response to stimulus’, ‘biological regulation’, ‘metabolic and developmental process’, ‘multicellular organismal process’ and ‘locomotion’ (Fig. 5B). On the other hand, one-third of exosomes-associated proteins in samples from NSP men were involved in reproduction, in particular in fertilisation and gamete generation processes (Fig. 5A).
The STRING database was used to identify protein–protein interactions (PPI) and to generate a network of interactions based on a variety of sources, thus including various interaction databases, text mining, genetic interactions and shared pathway interactions. The differentially expressed proteins were uploaded for the PPI network, and interaction with at least medium confidence (interaction score >0.4) were set by default. Among the proteins involved in reproduction (in particular in fertilisation and gamete generation processes) recovered in the 37 differentially expressed proteins of NSP group, CRISP1, SPAG11B and DEFB126 were found to be interacting (Fig. 5E). On the other hand, the 52 differentially expressed proteins in SEs from SA subjects were completely unassociated with any process promoting reproduction (Fig. 5F).
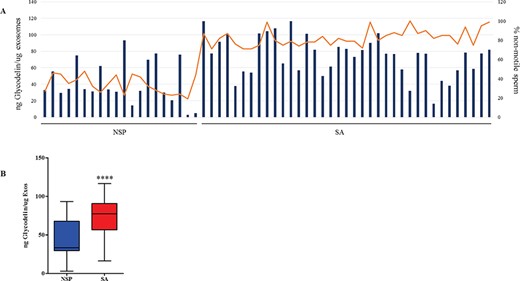
Comparison of glycodelin levels in different groups of seminal fluid-derived exosomes from NSP and SA men. (A) Results are expressed as ng of glycodelin per μg of exosomes (orange line) and as percentage of non-motile sperm (blue histograms). (B) Box and Whisker plots showing minimum, 25th percentile, 50th percentile (median), 75th percentile and maximum values of glycodelin. Two-way ANOVA followed by Bonferroni post-tests were used to determine significance: ****P<0,0001.
Validation of the nLC–ESI–MS-MS data using a different cohort of patients
To confirm the differential expression of proteins of clinical relevance in SEs from NSP and SA populations, we focused on a subset of exosomal markers and selected protein candidates and assayed their levels in a different cohort of men (see Table I, validation cohort). As expected, several key proteins associated with exosomes biogenesis, including TSG101 and flotillin, were detected in a comparable manner in both groups (Fig. 6A and C). PSA did not differ between groups, as shown in Fig. 6B. We further analysed and quantified TGM4 and glycodelin (Fig. 6D and F), confirming that both were significantly higher in SEs of SA compared to NSP men. In addition, we validated the expression of CRISP1 in SEs from the NSP cohort and significantly reduced expression in the SA cohort (Fig. 6E). The abundance of the proteins of interest was normalized to the total protein content (Supplementary Fig. S2).
By ELISA, glycodelin was confirmed to be more abundant in SEs derived from SA compared to NSP men (Fig. 7).
Discussion
In this study, we have performed a comprehensive proteomic analysis of purified exosomes isolated from the seminal plasma of NSP and SA men by nLC–ESI–MS-MS, detecting 2136 proteins which have been matched both with exosomal proteins already registered in the ExoCarta and Vesiclepedia databases and with those previously found in four proteomic studies on seminal fluid EVs (Poliakov et al., 2009; Ronquist et al., 2013; Dubois et al., 2015; Yang et al., 2017). An overlap of 1665 proteins among the total exosomal proteome and the abovementioned databases was found; likewise, the overlap with previously published data from the four studies indicated that 733 proteins had been already identified but only 46 were common to all the studies. Of importance, 1403 non-overlapping proteins were found in the present study (Poliakov et al., 2009; Ronquist et al., 2013; Dubois et al., 2015; Yang et al., 2017). The higher number of SE proteins detected in our analysis as compared with those previously identified may be explained according to: (i) the evolution of mass spectrometry sensitivity over time, (ii) the type and the number of samples included in the studies and (iii) the method used to isolate exosomes. Moreover, those differences may be due in part to intersample-interindividual variations that some studies have tried to overcome using pools of different samples.
As expected, exosomal proteins are largely represented in our proteomic data along with cytosolic and lysosomal proteins. Exosomal markers CD63, CD9, CD81, flotillin, Alix and TSG101 were quantitatively similar in SEs from NSP and SA men, consistently with previously published western blot results both from our and other groups (Caballero et al., 2013; Lötvall et al., 2014; Murdica et al., 2019). Similarly, the male reproductive tract was the main site of localisation. Several proteins shown to be associated with epididymosomes, such as epididymal sperm-binding protein-1 (ELSPBP1), macrophage migration inhibitory factor, A-disintegrin and metalloproteinase (ADAM), glioma pathogenesis-related protein-1 (GLIPR1) and glutathione peroxidase family members (Sullivan and Saez, 2013), were detected in our proteomic analysis, thus confirming that epididymosomes are part of the complex mixture of exosomes we have isolated. Other bioinformatic analyses indicated that the retrieved proteins were mainly involved in processes of transportation, calcium ion binding and energy production (Ronquist et al., 2013).
Proteins such as aldo-keto reductase family 1, member B1 (AKR1B1), which are supposed to maintain epididymal sperm cells in a quiescent status (Frenette et al., 2010), dicarbonyl/L-xylulose reductase (DCXR), found to be important for the binding between sperm and the zona pellucida, PSA, which cleaves biological substrates in seminal fluid (including semenogelin I and II) into small peptides, and IZUMO, whose absence has been reported to compromise the fusion with oocytes (Inoue et al., 2005), have been also identified in SEs (Berube and Sullivan, 1994; Frenette and Sullivan, 2001; Sullivan et al., 2007). Overall, the presence of these proteins in SEs suggests that these vesicles may be an important source of proteins involved in the process of sperm maturation and acquisition of fertilisation capacity in humans (Caballero et al., 2011). In this context, it has been recently demonstrated that spermatozoa can uptake SEs in vitro (Park et al., 2011; Aalberts et al., 2013a; Aalberts et al., 2013b; Murdica et al., 2019). Different factors have been shown to influence sperm uptake of exosomes and pH has been reported to be important, since its variations can drastically reduce the cell capturing (Park et al., 2011; Aalberts et al., 2013a; Aalberts et al., 2013b). Further, exosomes uptake may be favoured or even impeded by other conditions, including sperm activity and capacitation status (Aalberts et al., 2013a; Aalberts et al., 2013b).
When the protein content of prostasomes isolated from seminal plasma of NSP and non-NSP men was previously compared, five proteins were found to be differentially expressed between the two groups, but none was implicated in the reproductive process (Garcia-Rodriguez et al., 2018). In contrast, our comparative analysis of SE proteins shared by NSP and SA patients revealed 89 proteins to be differentially expressed. Overall, the proteins overexpressed in NSP patients were particularly interesting. Among the 37 augmented proteins, we found SPAG11B, involved in sperm maturation (Radhakrishnan et al., 2009) and DEFB126, the lack of which have been associated with an impaired sperm function (Duan et al., 2015; Xin et al., 2016). In line with previous data from our group by western blot analysis (Murdica et al., 2019), SEs derived from NSP men displayed higher levels of CRISP1 compared to those derived from SA subjects. We have also previously demonstrated that CRISP1 can be transferred to spermatozoa through SEs (Murdica et al., 2019). CRISP1 is a calcium ion channel enabling the entry of Ca2+ and triggering a cascade of protein phosphorylation involved in sperm motility (Maldera et al., 2013; Da Ros et al., 2015; Ernesto et al., 2015; Pereira et al., 2017; Weigel Munoz et al., 2018). Moreover, Crisp−/− sperm in mice exhibit defects in acrosome reaction, motility and tyrosine phosphorylation (Weigel Munoz et al., 2018).
Even more interesting, among the 52 differentially expressed proteins augmented in SEs of SA men, the epididymal secretory protein E3-alpha, which has been never reported in exosomes before and is poorly characterized, is a protein predominantly expressed in the corpus region of the epididymis and moderately in the vas deferens, likely involved in sperm maturation (Kirchhoff et al., 1994). Aquaporins 2 and 5, expressed in different sections of the epididymis and testis of some species (Yeste et al., 2017), were found to be upregulated respectively in SEs of SA and NSP individuals. Both TGM4 and glycodelin, increased in SEs of SA men, have been associated with primary infertility (Chiu et al., 2005; Yeung et al., 2006; Landegren et al., 2015). Semen glycodelin (glycodelin-S) inhibits albumin-induced cholesterol efflux from spermatozoa (Chiu et al., 2005), and thereby may prevent capacitation, which is triggered by a cholesterol decrement in the sperm plasma membrane. After removal of glycodelin-S, cholesterol efflux and capacitation can occur. We herein confirmed previous findings from Ronquist et al. (2013) showing the presence of glycodelin in seminal EVs; moreover, we have demonstrated for the first time that the content of glycodelin depends on the exosome origin, presenting the highest level in SEs of SA men. Transfer of glycodelin from SEs to sperm has not been demonstrated yet but we cannot exclude a role for the exosomal protein in regulating cholesterol quantity in the membrane, and consequently the ability to undergo capacitation.
As a whole, our findings strongly support the evidence that the network of SE-associated proteins may be connected to the molecular mechanisms involved in sperm maturation and motility. Therefore, current observations, along with the demonstration that exosomes can be taken up by spermatozoa (Park et al., 2011; Murdica et al., 2019), prompt for a critical role of SEs in affecting sperm parameters and function. Further investigations are needed to gain a deeper understanding of the possible mechanisms that are involved in these phenomena.
Acknowledgements
Part of this work was carried out in the Advanced Light and Electron Microscopy BioImaging Center (ALEMBIC) of San Raffaele Scientific Institute and Vita-Salute University and in the Proteomics Facility at Cogentech.
Authors’ roles
V.M., G.C. and N.Z. performed the experiments and acquired and analysed data; P.V. and R.V. supervised and coordinated the project; A.S., V.M., P.V. and R.V. discussed the results; V.M., P.V. and R.V. drafted the manuscript. All authors read and approved the manuscript.
Funding
This study has been supported by the Italian Ministry of Health (5x1000 project).
Conflict of interest
The authors have declared that no conflict of interest exists.
