


Abstract
What proportion of fertilized human ova are lost before implantation?
An estimated 40 to 50% of fertilized ova fail to implant.
Preimplantation loss is not detectable with current technology. Published estimates of preimplantation loss range from 10 to 70%.
We combine data from epidemiologic, demographic, laboratory and in vitro fertilization studies to construct an empirical framework for the estimation of preimplantation loss. This framework is summarized in a user-friendly Excel file included in supplement.
We draw from multiple sources to generate plausible estimates of fecundability, sterility, transient anovulation, intercourse patterns and the proportion of ova fertilized in the presence of sperm. We combine these estimates to generate a summary estimate of preimplantation loss. This estimate can be considered an average for couples in their prime reproductive years.
Under a plausible range of assumptions, we estimate that 40 to 50% of fertilized ova fail to implant.
A crucial factor in estimating preimplantation loss is the probability that an ovum will be fertilized when exposed to sperm. Human data are available only from in vitro fertilization (IVF), which may not accurately represent events in vivo. We therefore assume a range of in vivo fertilization rates, from 64% (human IVF data) to 90% (mouse data).
Our estimate of preimplantation loss takes into account the biological processes relevant to fertilization and loss. Using this empirical basis for estimation, we find support for the usual assumption that risk of loss is highest in the earliest days following fertilization. Furthermore, this framework can provide improved estimates as better reproductive data become available. To the extent that our estimates are accurate, more fertilized ova are apparently lost in vitro than in vivo, suggesting that further improvements in IVF success rates may be possible.
This study was supported by the Intramural Program of the National Institute of Environmental Health Sciences, NIH. Professor Adashi serves as Co-Chair of the Safety Advisory Board of Ohana Biosciences, Inc. The other authors have no competing interests.
N/A.
Introduction
The earliest time at which a fertilized human ovum can be detected in naturally occurring pregnancies is at implantation. Trophoblast cells produce rapidly rising levels of human chorionic gonadotropin (hCG) starting with implantation, an average of 9 days after fertilization (Wilcox et al., 1999). From the time of hCG detection, about one-third of pregnancies are spontaneously lost—25% before becoming clinically apparent, and the remainder after clinical recognition (Wilcox et al., 1998, Baird and Strassmann, 2000). There is no comparable way to measure loss of fertilized ova before implantation. In vivo fertilized ova are undetectable before implantation by any current technology. Despite intense interest in the biological mechanisms that might contribute to preimplantation loss (Hardy et al., 2001; Norwitz et al., 2001; Jun et al., 2008; Cha et al., 2012; Daughtry and Chavez, 2016; Clark and Kruger, 2017), the extent of such loss remains speculative. Published estimates of preimplantation loss range from 10 to 70% (Chard, 1991; Weinberg and Wilcox, 1995; Kennedy, 1997; Jarvis, 2016).
We propose to improve the estimate of preimplantation loss through a systematic and comprehensive approach, with the foundation being the observed rates of human fecundability. Given the measures of fecundability reported in human populations, we take into account population levels of factors that prevent viable sperm from encountering a viable egg, such as couple sterility or sporadic anovulation. Once the egg is exposed to sperm, the next step is the probability of fertilization. Since this probability is not observable in vivo, we derive a range based on animal in vivo data and human in vitro fertilization (IVF) data. The probability of fertilized ova is then used to generate a measure of preimplantation loss. This approach is summarized in a spreadsheet program (supplement) that allows us to explore a range of alternative assumptions. This generates a robust estimate of preimplantation loss that is more empirically grounded than those previously available.
Materials and Methods
Our framework presumes a hypothetical population of couples in their prime reproductive years, who have ordinary frequency of intercourse without contraception. This population represents a biologically ‘average’ group in their fertility, behavior and risk of pregnancy loss. A useful measure of their capacity to conceive is fecundability—the probability that a couple will conceive a pregnancy in a given menstrual cycle. ‘Pregnancy’ in the context of fecundability is usually defined as either live birth or clinically recognized pregnancies (including miscarriages). We expand this definition to include all biochemically detectable pregnancies, i.e. beginning at implantation. We then build on this expanded measure of fecundability to address the more elusive question of preimplantation loss.
Observed fecundability defined as the probability of implantation
An unbiased estimate of fecundability can be defined as the proportion of couples who achieve pregnancy in their first cycle of trying. This probability is not calculable for a given couple because they provide too few pregnancy attempts for analysis. We can, however, estimate fecundability for large groups of couples.
We expand the definition of pregnancy to include biochemically detectable pregnancies (implantations). This definition is sound in principle, but difficult in practice. An estimate of implantation requires intensive testing for urinary hCG levels (the cardinal sign of implantation) among couples attempting to conceive. Given the logistical difficulties of such testing, only four studies of implantation have been conducted, with varying study designs and assay methods (Wilcox et al., 1988; Zinaman et al., 1996; Bonde et al., 1998; Wang et al., 2003). The percent of hCG-detected pregnancies in the first cycle of attempting pregnancy has been reported in these studies as 16% (Bonde et al., 1998), 30% (Zinaman et al., 1996), 36% (Wilcox et al., 1988) and 42% (Wang et al., 2003). The lowest estimate was biased by at least two factors: inclusion of women who had recently used an oral contraceptive (which suppresses fertility in the cycles immediately following its use) and use of a less sensitive hCG assay (which misses some implantations). The next lowest estimate (30%) also used a less sensitive hCG assay. Baird and Strassmann (2000) adjusted for relative assay insensitivity and showed that the 30% implantation rate would correspond to 36% with the more sensitive assay. For our framework, we assume 36% as a reasonable mid-level probability of implantation.
Events prior to implantation
The proportion of implantation is crucial, because it imposes a strict limit on preimplantation loss. With 36% chance of implantation as a baseline, the maximum possible loss of fertilized ova is 100% minus 36 or 64%. This assumes 100% fertilization, i.e. that an ovum is fertilized in every cycle. It is highly implausible, however, that fertilization occurs in 100% of cycles. Fertilization requires the completion of a series of complex steps, including production of viable male and female gametes, and deposition of sperm in the female reproductive tract during the woman’s six fertile days. We provide population estimates for these steps.
Proportion of couples who are sterile.
There are inevitably couples in any representative population who are unable to conceive naturally, however long they try. The presence of these sterile couples reduces the population level of ovum fertilization by some small amount. A review of the demographic and epidemiologic literature estimated that 2 to 4% of couples at optimal reproductive ages are sterile (Leridon, 2008). A US national survey of fertility and family planning reported that 2% of women are involuntarily childless (Abma et al., 1997). Dunson and colleagues made use of prospectively collected data from the European Fecundability Study to estimate a sterility rate of 1% (Dunson et al., 2004). These published estimates of sterility unavoidably include not only failure to fertilize but also failure to implant. We need a value only for failure to fertilize, since failure to implant is what we intend to estimate. We therefore assume a sterility rate of 2%, which is in the mid-range of published estimates.
Proportion of anovulation in healthy women.
Even fertile women do not necessarily ovulate in every cycle. Sporadic anovulation is difficult to measure, and there is no consensus on the extent of its occurrence in reproductively healthy women. Published studies of anovulation rely on serum and urinary hormone measurements during the menstrual cycle, with varying definitions and incompleteness of data. Best estimates range from 1 to 10% (Baird et al., 1995; Windham et al., 1999; Lynch et al., 2014). We have chosen an intermediate value of 4% anovulation.
Proportion of cycles with mistimed intercourse.
A further obstacle to fertilization is mistimed intercourse. There are 6 days in each menstrual cycle during which intercourse can lead to pregnancy (Weinberg et al., 1994; Wilcox et al., 1995; Dunson et al., 1999). Without intercourse during these 6 days, fertilization rarely if ever occurs. We know of no published data on the probability of intercourse in the fertile window. This cannot easily be derived from overall intercourse frequency because intercourse is more frequent during the fertile days (Wilcox et al., 2004). To fill this data gap, we have analyzed data from our prospective study of ovulation in women attempting to conceive (Baird et al., 1995). We based this analysis on 696 cycles of 221 women attempting pregnancy in 1982–1985. On average, couples had intercourse on 2.1 days per week, with 8% having no intercourse during the woman’s six fertile days. We therefore assume that among women attempting pregnancy, an average of 8% per cycle have no possibility of fertilization due to mistimed intercourse. Couples monitoring ovulation would presumably be less likely to miss their fertile days, with a counterbalancing increase in their implantation rate and no net change in the estimated preimplantation loss.
Proportion of ova fertilized in the presence of sperm.
The most elusive component of fertilization—and the most consequential—is the probability that an ovum exposed to sperm will be fertilized. This event is not directly observable in vivo, so we must turn to human IVF studies and animal studies—with the inevitable limitations of such data.
Mouse ova display high rates of in vivo fertilization. For example, in a study of hormonally stimulated mice, researchers flushed the oviducts and uteri after copulation and found that more than 90% of ova had advanced to the pronuclear stage (Jefferson et al., 2009). The rate of ovum fertilization is also high in species more similar to our own. Rizos et al. report that bovine ova achieve more than 80% fertilization in vivo (Rizos et al., 2002). Primate studies are based on smaller numbers, but show IVF rates as high as 90% (Wolf et al., 1989).
Given that such experiments cannot be conducted in humans, the only direct human data derive from IVF studies. Published studies do not routinely provide rates of ova fertilization. This information can be found in scattered publications, usually in tables. A summary by Roesner and colleagues provided usable data from 6 studies of natural-cycle IVF, with a total of 747 ova exposed to sperm (Roesner et al., 2014). Fertilization rates ranged from 64 to 80%, with an overall mean fertilization rate of 72%. An abstract presented at the 2010 annual meeting of the American Society for Reproductive Medicine (but not subsequently published) provided in vitro fertility data on 13 077 ova from women under the age of 35, with a reported fertilization rate of 67% (Wun W-S A et al., 2010). Fertilization rates were nearly the same for ova from the woman undergoing IVF (67%) and ova from donors (66%), who presumably had no recognized reproductive pathology.
These in vitro studies provide only limited information on the characteristics of mothers and fathers, the conditions of IVF or possible exclusions. We therefore addressed this question in a setting where we could define a study population using careful restrictions. We analyzed primary data from one large US IVF clinic (Center for Assisted Reproduction, Bedford TX). We limited the analysis to fresh oocytes from women who were no older than 35 years (either the women under treatment or egg donors). We used stimulation cycles that produced no fewer than 6 and no more than 20 ova, assuming that under- or over-response of the ovary to stimulation may produce suboptimal ova. Similarly, we excluded data from women with a diagnosis of endometriosis, polycystic ovary disease or diminished ovarian reserve. We also excluded data from male partners who had known fertility problems or semen abnormalities. We defined fertilization as an ovum reaching the stage of two identifiable pronuclei (2PN) following conventional IVF. Fertilization rates were again similar for autologous ova and ova from donors. Of 9606 ova exposed to sperm, 5835 progressed to the 2PN stage, for a fertilization rate of 61%.
We pooled these three rates of IVF (61, 67 and 72%) to obtain a weighted average of 64%. We cannot assume, however, that IVF successfully mimics in vivo conditions, given the complexity of events in the natural setting. Fertilization rates in vivo may well be more successful than in vitro, as has been reported for bovine embryos (Tsuiko et al., 2017). We therefore use 64% as a lower boundary of human fertilization rate and 90% (as obtained from animal studies) as a possible—if conjectural—upper boundary.
Results
Figure 1 provides the schema for our assumptions and calculations. We assume a population of 100 unselected couples of reproductive age, in their first cycle of having intercourse without contraception. The percent of pregnancies in the first cycle provides an unbiased estimate of the mean population fecundability. This allows us to use ‘cycle percent’ and ‘population mean’ interchangeably. We assume implantation in 36% of these cycles as the baseline measure of biochemical fecundability (see Materials and Methods).
Potential range of preimplantation loss among 100 unselected couples in their first-cycle attempt of pregnancy. We assume that 36% of couple will have an implanting pregnancy and 24% of couples will have a live birth. We also take into account cycles where no fertilization is possible due to sterility, anovulation or mis-timed intercourse (14%), leaving 86 couples (or cycles) as the denominator for possible preimplantation loss.
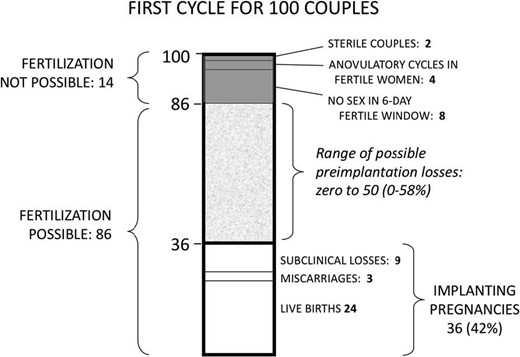
Among these implanting pregnancies, we apply the generally accepted estimates of sub-clinical loss and clinical pregnancy loss. About 25% of implanting embryos are lost before clinical recognition of pregnancy (usually defined as 6 weeks after last menstrual period) (Baird and Strassmann, 2000, Wang et al., 2003, Cole et al., 2009)—thus 9/36 cycles in our framework. Loss between clinical recognition and fetal viability (miscarriages) is generally reported as 11–13% of all clinical pregnancies (Nybo Andersen et al., 2000; Magnus et al., 2019)—thus 3 of the 27 remaining pregnancies in our model (11%). This leaves 24 pregnancies (in 24 cycles) that progress to live birth. This rate of 24 births in the first cycle of 100 couples attempting pregnancy is consistent with average demographic estimates from human populations (Leridon, 1977). The stillbirth rate in developed nations is less than 1%, too few to include in these calculations.
The choice of a 36% implantation rate is crucial because, as discussed above, it imposes a firm upper limit on preimplantation loss. The maximum preimplantation loss would be 100–36%, or 64% if every cycle produced a fertilized ovum. At the other extreme, preimplantation loss could be as low as zero if just 36 ova were fertilized in 100 cycles, and every fertilized egg successfully implanted.
We can narrow this possible range of preimplantation loss by considering natural factors that limit fertilization, namely sterility (2%), transient anovulation (4%), and absence of intercourse during fertile days (8%). Summing these, we estimate that fertilization is not possible in an average of 14% of cycles. This reduces to 86% the chance that viable sperm will encounter an ovum in the average menstrual cycle. With 86 out of 100 cycles potentially fertilizable, 86 becomes the new denominator for estimating preimplantation loss (Fig. 1). Given that implantation takes place in 36 of those 86 cycles, the most preimplantation loss that could occur would be in all remaining 50 cycles, for a maximum preimplantation loss of 58% (50/86). As before, preimplantation loss could be as low as zero if only 36 ova were fertilized in 86 cycles (fertilization rate of 42%), and every fertilized egg successfully implanted.
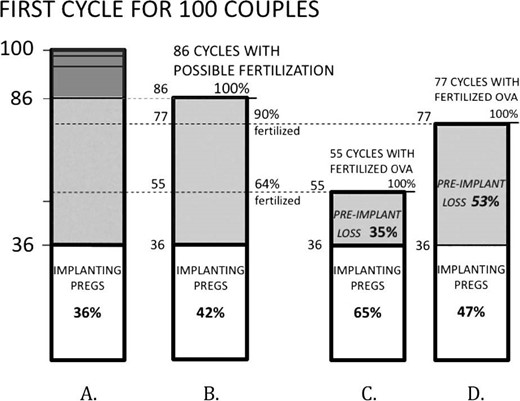
This wide range of possible implantation loss (0 to 58%) can be further narrowed by a final—and crucial—assumption: the probability that an ovum will be successfully fertilized in the presence of sperm. Based on IVF and mouse data, we have proposed that 64 to 90% of human ova exposed to sperm are fertilized (see Materials and Methods) (Fig. 2). If 64% of the 86 available ova are fertilized, this would produce 55 cycles with fertilized ova, of which 36 implant and the remaining 19 (19/55, or 35%) would end in preimplantation loss (Fig. 2C). If 90% of the 84 ova are fertilized, there would be 77 cycles with fertilized ova, of which 36 implant and the remaining 41 (41/77, or 53%) would end in preimplantation loss (Fig. 2D). Thus, preimplantation loss under these assumptions ranges from 35 to 53%.
Potential range of preimplantation loss among 100 unselected couples in their first-cycle attempt of pregnancy. This takes into account the cycles in which fertilization cannot take place (dark gray area, A; see also Fig. 1) and assumes two possible estimates of ova fertilization in the presence of sperm (64% and 90%, B). In C and D, the estimated numbers of fertilized ova become the new denominators for estimating preimplantation loss. For instance, in C, there are 55 cycles with fertilized ova (64% of 86 cycles with viable ova). Given that 36 cycles achieve implantation, the number of cycles with preimplantation loss is 19 (55 minus 36), with a preimplantation loss rate of 19/55 or 35%. Pregs: pregnancies.
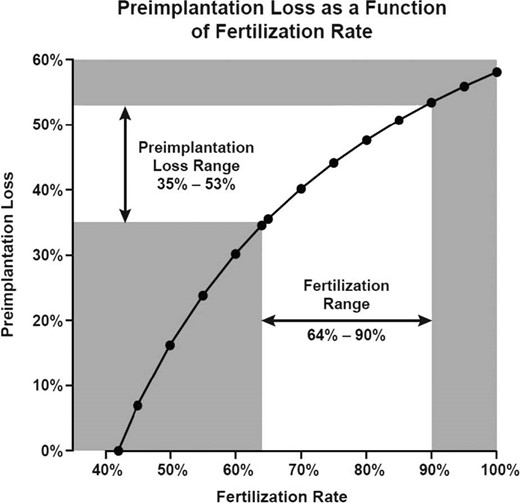
The importance of fertilization rates is shown in Fig. 3, which plots the continuous relationship between fertilization rates and the resulting preimplantation loss. The greater the fertilization rate, the greater the estimated preimplantation loss. The spreadsheet generating these results is provided in Supplement Table S1.
Continuous relationship of fertilization rate and estimated preimplantation loss. Estimated for first-attempt cycles with the following assumptions: 14% of cycles have no opportunity for fertilization (sterility, anovulation, mistimed intercourse) and 36% of first-attempt cycles result in an implanting pregnancy. Assumes a range of 64–90% human ova fertilized in the presence of sperm (based on human IVF data (64%) and animal data (90%)).
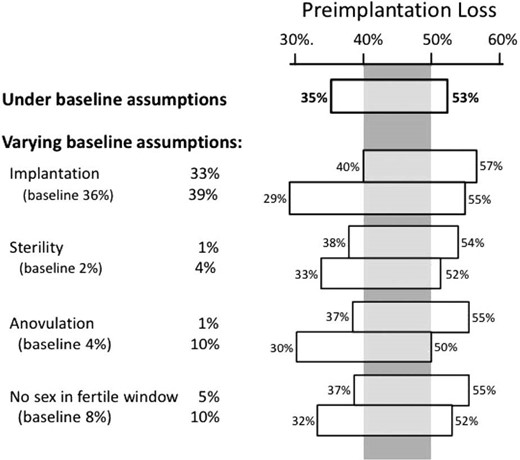
Assumptions about the remaining variables have less impact. Figure 4 shows how varying the remaining assumptions affect the estimated preimplantation loss. The top bar provides the result just discussed, which assumes that the rate of ovum fertilization ranges from 64 to 90% and holds all other assumptions constant. The remaining bars show the range of preimplantation loss when varying the remaining assumptions one at a time. For example, the second bar allows implantation to range from 33 to 39% (around our baseline assumption of 36%). Variations in the remaining assumptions have even less impact. Within these variations, there is a range of preimplantation loss (40 to 50%, shown by the gray vertical panel) that remains under all assumptions. This range can be regarded as the most robust estimate of preimplantation loss available with current data.
Estimated range of preimplantation loss under a series of varying assumptions about underlying biological processes. Numbers in parentheses are the baseline assumptions used in the main analysis, holding constant the assumption of ovum fertilization within the range of 64–90%. Even within these variations, there is a range of preimplantation loss (40 to 50%, shown by the gray vertical panel) that remains under all assumptions.
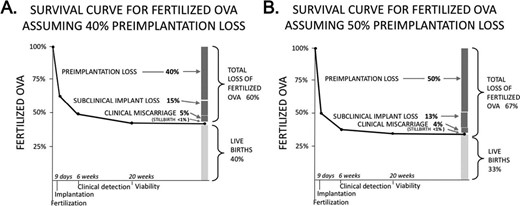
This estimate of preimplantation loss (40 to 50%) can be combined with recognized losses to calculate the total survival of fertilized ova (Fig. 5). The two panels (one for 40% preimplantation loss and the other for 50%) show the resulting percent of all fertilized ova lost at each stage of pregnancy, and the percent culminating in live births. Total loss among conceptions ranges from 60 to 67%, leaving 33 to 40% of all conceptuses surviving to live birth. In each these scenarios, loss is highest immediately following fertilization and steadily declines following implantation and clinical detection. Stillbirth (the only fetal loss that is legally registered in most developed countries and for which we therefore have complete data) constitutes the smallest fraction of all pregnancy loss.
Estimated survival curves for fertilized ova. Scenario A assumes that 40% of fertilized ova will be lost before implantation, while Scenario B assumes 50%. The bar plot at the right of each panel shows the cumulative fate of fertilized ova: loss or live birth. By these estimates, 60–67% of fertilized ova do not result in a live birth, with the largest proportion of loss in both scenarios occurring prior to implantation.
Discussion
The extent of preimplantation loss in humans has been a subject of speculation for decades. Hertig and Rock’s extraordinary 1959 study of uteri surgically removed from fertile women provided the first evidence of extensive early pregnancy loss in humans—although with too few observations to quantitate that extent (Hertig et al., 1959). Since then, there have been many estimates of preimplantation loss, widely varying and mostly based on thin assumptions or scant data (Chard, 1991; Weinberg and Wilcox, 1995; Kennedy, 1997; Jarvis, 2016). No previous estimates have considered natural factors that limit the opportunity for fertilization, such as sporadic anovulation and the absence of intercourse during the six fertile days of the cycle. In the most careful summary to date, Jarvis estimated that 10–40% of fertilized ova are lost before implantation (Jarvis, 2016). Our best estimate of preimplantation loss (40–50%) is at once narrower and more empirically based than previous estimates.
Limitations of these estimates
Every number entered into our framework is of course an approximation—with some more approximate than others. The natural fertilization rate of human ova remains the main uncertainty in any calculation of preimplantation loss. IVF provides the only direct fertilization data for humans, but IVF does not fully replicate the complex orchestration of physiological events leading to in vivo fertilization. Acknowledging this uncertainty, we have considered a range of possible fertilization rates, from the relatively low rates observed in human IVF studies to the higher fertilization rates seen in non-human species including other primates. Even within this range of assumptions, our framework provides a relatively specific estimate of preimplantation loss compared to the range in the literature. As better studies are conducted, the accuracy of the underlying assumptions is likely to improve. Our approach allows new data to be entered into the calculations for better estimates of preimplantation loss. Our spreadsheet can also be used to explore the sensitivity of preimplantation loss to alternative assumptions.
Our framework attempts to address the natural biology of an unselected population in their prime reproductive years. In practice, however, hardly any data come from unselected populations. We extract our reproductive data from studies in diverse settings, with their attendant limitations. Women’s age and, to a lesser degree, men’s age, influence many of the components of our framework. Male and female fertility both decline with age (Dunson et al., 2004), while miscarriage risk dramatically increases with mother’s age (Magnus et al., 2019). Subclinical pregnancy loss may also increase with the mother’s age (Farr et al., 2007). We have tried to restrict our estimates to those from study populations in their most successful reproductive ages, but this was not always possible. A full exploration of how age might affect estimates of preimplantation loss would require additional and more complicated assumptions.
A further limitation of this study is the role of socioeconomic diversity. Most human reproductive data come from relatively affluent populations, and our estimates of loss may therefore reflect conditions that are more optimum than representative.
Estimating total pregnancy loss
Our estimate of preimplantation loss allows the calculation of cumulative loss starting with fertilization and thus the proportion of fertilized ova that survive to live birth. There are diverse speculations on this question. The current view, according to Niakan, is that ‘at most, 30% of fertilized eggs result in a live birth’ (Niakan et al., 2012). Jarvis concluded that a plausible range is 40–60% (Jarvis, 2016). Our estimate falls exactly between those two estimates, with 33 to 40% of fertilizations resulting in live birth (Fig. 5).
Biological mechanisms of preimplantation loss
What are possible causes of preimplantation loss? Numerous biological mechanisms could impair the robustness of a fertilized ovum. These include genetic problems of the ovum or sperm, aneuploidies that arise during meiosis and developmental problems in the early days following fertilization (for example, due to suboptimal oviduct environment (Chegini, 1996) or errors in DNA methylation (Messerschmidt et al., 2014)). Hardy et al. (Hardy et al., 2001) have used mathematical modeling of cell development to argue that the underlying causes of embryonic loss are present at fertilization, with conditions after fertilization being less important. One frequent error at fertilization is chromosomal aberration—whole chromosome defects as well as segmented aneuploidy (Babariya et al., 2017). Aneuploidy may explain much of the failure of IVF fertilized ova to reach the blastocyst stage of development (Hardy et al., 2001). The slower rate of development when aneuploidy is present (Pellestor et al., 2003) may also render the fertilized ova unprepared to implant in the uterus during the brief period when the endometrium is maximally receptive (Yoshinaga, 1988).
Implications for evaluation of IVF success rates
Any comparison of in vivo and in vitro success rates is constrained by a lack of comparable benchmarks in the two settings. Perhaps most important, there is no information on in vivo fertilization of the ovum—an event that is directly observable in IVF. Without this information, there is no comparable denominator for calculating the probability of successful pregnancy in the two settings. Our framework addresses this indirectly by estimating the proportion of fertilized ova that culminate in live birth. Under reasonable assumptions, 33 to 40% of ova fertilized in vivo progress to live birth (Fig. 5). For women under the age of 35 undergoing IVF, the per cycle probability of live birth is 31% (CDC fig 18), although this estimate is inflated by including cycles with more than one embryo transferred.
Another way to estimate success of the in vitro fertilized ovum is to multiply the probability of a fertilized ovum progressing to a five-day blastocyst (around 50% (Hardy et al., 2001, McCollin et al., 2019)) by the probability that a five-day embryo will produce a live birth (50% for women less than 35 years of age (CDC fig 35)), which is 25%. If we regard 25 to 31% as a reasonable range for the probability that an in vitro fertilized ovum will lead to a live birth, this is distinctly less than our estimate of 33% to 40% in vivo. Thus, it appears that ova fertilized in vitro may be moderately less successful in producing a live birth than those fertilized in vivo. Unfortunately, these calculations provide no clear indication of the specific stages at which the IVF process might be improved.
Broader implications
Our findings underscore the fact that failure to conceive in a given cycle is due not only to the absence of fertilization, but to failure of the fertilized ovum to progress to implantation. An added aspect of these results is with regard to legislative efforts to rule that human life legally begins at the moment an egg is fertilized (see for example, H.R.586—Sanctity of Human Life Act,115th Congress, 2017–2018). There is no mention in proposed legislation of the large number of natural losses that occur after fertilization—by our estimation, up to twice as many as live births. Recognition of these losses may not affect the intended legislation, but quantifying preimplantation loss could help the general public better understand the natural events of pregnancy, and provide a better context for policies related to those events.
In sum, we present a framework for incorporating empirical data into an estimate of preimplantation loss. This framework takes into account biological processes relevant to fertilization and loss. Our results support the assumption that risk of loss is highest in the earliest days following fertilization, with a more empirically based range of estimates than has previously been available. To the extent that our estimates are accurate, in vivo conceptions are more likely to culminate in live birth than IVF conceptions, suggesting that further improvements in IVF success rates may be possible. The framework provided here can be adapted to incorporate better reproductive data as such data become available.
Acknowledgements
We are grateful to Martin Langley, who kindly extracted the necessary data from the Texas clinic data set; Dr Carmen Williams, who provided valuable insights into the mechanisms and limitations of IVF studies; Dr D. Robert McConnaughey, who provided the additional analysis of data from the Early Pregnancy Study; and Drs Clarice Weinberg and Donna Baird, who gave critical and constructive comments on previous versions of this manuscript. This research was supported by the Intramural Research Program of the NIH, National Institute of Environmental Health Sciences, NIH.
Authors’ roles
Dr Wilcox was responsible for conception and design of paper and wrote the first draft. Dr Harmon designed the analytic spreadsheet. Dr Doody provided key empirical data from his clinic. All authors took part in analysis and interpretation of data, revision of the paper for important intellectual content and final approval of the published version.
Funding
Intramural Program of the National Institute of Environmental Health Sciences, NIH.
Conflict of interest
Professor Adashi serves as Co-Chair of the Safety Advisory Board of Ohana Biosciences, Inc. The other authors have no competing interests.
