


Abstract
How does the cost-effectiveness (CE) of immediate IVF compared with postponing IVF for 1 year, depend on prognostic characteristics of the couple?
The CE ratio, i.e. the incremental costs of immediate versus delayed IVF per extra live birth, is the highest (range of €15 000 to >€60 000) for couples with unexplained infertility and for them depends strongly on female age and the duration of infertility, whilst being lowest for endometriosis (range 8000–23 000) and, for such patients, only slightly dependent on female age and duration of infertility.
A few countries have guidelines for indications of IVF, using the diagnostic category, female age and duration of infertility. The CE of these guidelines is unknown and the evidence base exists only for bilateral tubal occlusion, not for the other diagnostic categories.
A modelling approach was applied, based on the literature and data from a prospective cohort study among couples eligible for IVF or ICSI treatment, registered in a national waiting list in The Netherlands between January 2002 and December 2003.
A total of 5962 couples was included. Chances of natural ongoing pregnancy were estimated from the waiting list observations and chances of ongoing pregnancy after IVF from follow-up data of couples with primary infertility that began treatment. Prognostic characteristics considered were female age, duration of infertility and diagnostic category. Costs of IVF were assessed from a societal perspective and determined on a representative sample of patients. A cost-effectiveness comparison was made between two scenarios: (I) wait one more year and then undergo IVF for 1 year and (II) immediate IVF during 1 year, and try to conceive naturally in the following year. Comparisons were made for strata determined by the prognostic factors. The final outcome was a live birth.
The gain in live birth rate of the immediate IVF scenario versus postponed IVF increased with female age, and was independent from diagnostic category or duration of infertility. By contrast, the corresponding increase in costs primarily depended on diagnostic category and duration of infertility. The lowest CE ratio was just below €10 000 per live birth for endometriosis from age 34 onwards at 1 year duration. The highest CE ratio reached €56 000 per live birth for unexplained infertility at age 30 and 3 years duration, dropping to values below € 30 000 per live birth from age 32 onwards. It reached values below €20 000 per live birth with 3 years duration at age 34 and older. The CE ratio was in between for the three other diagnostic categories (i.e. Male infertility, Hormonal and Immunological/Cervical).
We applied estimates of chances with IVF, excluding frozen embryos, for which we had no data. Therefore, we do not know the effect of frozen embryo transfers on the CE.
The duration of infertility at which IVF becomes cost-effective depends, firstly, on the level of society's willingness to pay for one extra live birth, and secondly, given a certain level of willingness to pay, on the woman's age and the diagnostic category. In current guidelines, the chances of a natural conception should always be taken into account before deciding whether to start IVF treatment and at which time.
Supported by Netherlands Organisation for Health Research and Development (ZonMW, grant 945-12-013). ZonMW had no role in designing the study, data collection, analysis and interpretation of data or writing of the report. Competing interests: none.
Introduction
A few countries have guidelines for providing IVF (NVOG, 2010; Fields et al., 2013). The guidelines recommend at which duration of infertility IVF should be started for given combinations of reason for infertility (i.e. diagnostic category) and female age. The cost-effectiveness (CE) of these guidelines, i.e. the extra costs per live birth of starting IVF treatment immediately at a certain duration of infertility, compared with postponing IVF for 1 year, has never been assessed.
The indications for IVF have been widened considerably since its introduction in 1978. Whereas, in earlier days, bilateral tubal occlusion was seen as the only reason to perform IVF, IVF is currently used for virtually any infertility diagnostic category. Yet, evidence of CE from a randomized controlled trial is available only for the tubal indication group (Soliman et al., 1993). For other diagnostic categories such as unexplained, mild male or cervical infertility the evidence base for an increased effectiveness of IVF compared with the effectiveness of expectant management or IUI with or without stimulation is considered to be weak or lacking (Hughes et al., 2004; Pandian et al., 2012).
For tubal pathology, endometriosis and for severe male infertility, the choice of treatment is limited to two options: either trying for a natural conception or starting IVF. There are few alternative treatment options for the other diagnostic categories: for unexplained, mild male or cervical infertility, IUI with or without mild ovarian hyperstimulation (MOH) is the only treatment option prior to IVF. The usefulness of IUI/MOH compared with expectant management is however being debated and further, it is not self-evident that a couple should start IVF directly after failed IUI/MOH; a waiting time could be indicated to profit from a remaining pregnancy chance before IVF treatment is commenced, given the high cost and burden of IVF (Pashayan et al., 2006; Steures et al., 2008; van den Boogaard et al., 2014). Furthermore, studies have shown that a pregnancy after IVF results in more multiple pregnancies and even singleton pregnancies are more prone to preterm birth, low and very low birth weight, small for gestational age and perinatal mortality compared with spontaneously conceived pregnancies (Okun and Sierra, 2014).
Therefore, an evidence-based comparison of expectant management versus IVF is needed for all diagnostic categories. Within current practice, a randomized comparison would not be feasible because it would be very difficult to recruit couples for a study that might make them delay their IVF treatment for 1 year. However, in the Netherlands there were waiting lists for IVF when the increasing demand for IVF exceeded the supply by the few clinics that were licensed to perform IVF treatments. Therefore, we were able to use the waiting period before the actual start of IVF to estimate the natural pregnancy chances of couples that are going to start IVF. Some couples received prior treatment such as IUI/MOH whereas others had no treatment prior to the waiting period for IVF.
Pregnancy chances with IVF depend on female age and duration of infertility but not on the infertility diagnostic category (Templeton et al., 1996; Lintsen et al., 2007). Natural pregnancy chances also depend on female age and duration of infertility, but in this case differ substantially between diagnostic categories. Because the same factors are predictive for both natural pregnancy and pregnancy after IVF, we might infer that the relative efficacy of IVF over expectant management would depend only slightly or not at all on patient characteristics. In a modelling exercise, Mol et al. (2000) showed that the CE strongly depends on the female age. However, this remains to be assessed on prospective data and for other predictive factors.
Therefore, the aim of the current study is to determine the cost-effectiveness of immediate IVF compared with postponing IVF for 1 year in couples with primary infertility, according to the prognostic factors female age, duration of infertility and diagnostic category.
Materials and Methods
Subjects
Between 1 January 2002 and 31 December 2003, a national cohort study was conducted in the Netherlands so that all patients in IVF clinics on a waiting list were prospectively registered by their gynaecologist at the moment of indication for IVF or ICSI. In 2004, the registered data were cross-checked with the IVF treatment registries of the clinics in order to see whether the patients had actually started IVF or not. Patients that could not be identified in the IVF registries were tracked manually by searching the patient medical records in the IVF clinics: detailed patient data were collected, and the reason for not starting IVF was registered, including the occurrence and timing of a natural pregnancy. We only included data from couples with primary infertility because for secondary infertility we could not distinguish between couples who had undergone IVF for the first pregnancy, for whom the decision for IVF is no longer questionable, and couples who had a treatment-independent first pregnancy. From the data collected, prediction models were developed for the chance of treatment-independent pregnancy, as observed during the period on the waiting list (Eijkemans et al., 2008) and for the chance to become pregnant with IVF/ICSI (Lintsen et al., 2007). The costs of IVF/ICSI were determined on a representative sample of patients undergoing treatment in five participating clinics (Eijkemans et al., 2008). The current study integrates all these findings.
Ethical approval
Ethical approval was obtained from the institutional review boards of the leading participating centre, and a local check on feasibility from all other participating centres, according to regulations in the Netherlands.
Definitions
Throughout this paper, we will use ‘infertility’ to indicate that a couple has been trying to conceive without success for a period of at least 1 year. The duration of infertility was defined as the period between the start of the couples’ pregnancy attempts and the moments at which the decision was made to start IVF or wait for another 12 months. Primary infertility is defined as no prior pregnancy in this partnership. Age refers to the age of the female partner at the decision moment to start or postpone IVF. The diagnostic categories considered are unexplained infertility, male infertility, endometriosis, hormonal and immunological/cervical infertility. The male category does not differentiate between a mild male factor and a severe factor requiring ICSI, because these subcategories were not registered on the waiting list. We excluded the tubal infertility group because the waiting list data did not discriminate between couples with absolute two-sided tubal pathology, who have no chance of conceiving without treatment, and couples with relative one-sided tubal pathology, who do have a chance of conceiving without treatment.
Cost-effectiveness analysis
The aim of this study was to assess the CE of immediate IVF compared with postponing IVF for 1 year, for subgroups of patients. The methodology followed is similar to the one used in a previous study in anovulatory patients (Eijkemans et al., 2005): comparisons between treatment scenarios were made for subgroups of couples with primary infertility defined by the prognostic factors female age, duration of infertility and diagnostic category. Two treatment scenarios were compared: (I) wait 1 year, then 1 year of IVF and (II) immediate IVF during 1 year, then 1 year no treatment. The time horizon of the analysis was therefore 2 years, and is the same for both scenarios. We do not have immediate observations of outcomes for both scenarios, because no randomized data are available. As a second best option, the relevant chances of the periods with and without treatment in both scenarios may be obtained from our prediction models on IVF chances (Lintsen et al., 2007) and on chances on the waiting list (Eijkemans et al., 2008). These models predict the chances of an ongoing pregnancy.
The effectiveness measure of the study was a live birth. Our data (from the registry and/or medical records) contained ongoing pregnancy and not live birth. To convert ongoing pregnancy rates to live birth rates, we used the published data of Arce et al. (2005). In our study, ongoing pregnancy is defined as foetal heart activity on ultrasound after at least eight weeks gestation. Therefore, most ultrasounds were conducted between 8 and 10 weeks of gestation. Arce defined ongoing pregnancy as foetal heart activity on ultrasound at 12 weeks and states that 92% result in a live birth (95% confidence interval: 88–96%). Furthermore, they state that a viable pregnancy confirmed by ultrasounds at 6 weeks gestation results in a live birth in 84% (Arce et al., 2005). Because the risk of miscarriage is higher in early pregnancies we decided to use the conversion of ongoing pregnancy to live birth rate as stated by Arce (92%). Both a singleton and a twin live birth were counted as one success.
The prediction models for natural pregnancy (‘treatment-independent’ model) (Eijkemans et al., 2008) and for pregnancy following IVF (IVF model) (Lintsen et al., 2007) were converted to live birth and subsequently used to compare the live birth chances of the two treatment strategies for various patient profiles (Table I).
Chances of pregnancy leading to live birth of the two strategies, for four selected example patient profiles.
| Diagnostic category | Patient profiles with primary subfertility of 3 years | |||
|---|---|---|---|---|
| Unexplained | Endometriosis | |||
| Age | 30 | 38 | 30 | 38 |
| Treatment-independent chance in Year 1 | 12.7% | 8.9% | 3.7% | 2.6% |
| Treatment-independent chance in Year 2 | 11.1% | 7.9% | 3.2% | 2.3% |
| IVF chance in Year 1 | 49.5% | 32.3% | 42.3% | 26.8% |
| IVF chance in Year 2 | 48.4% | 27.3% | 41.3% | 22.6% |
| Chance with Scenario I, postponing IVF 1 year* | 55.0% | 33.8% | 43.5% | 24.6% |
| Chance with Scenario II, direct IVF* | 55.1% | 37.6% | 44.2% | 28.5% |
| Chance difference II − I (Delta P) | 0.1% | 3.8% | 0.7% | 3.9% |
*Pregnancy chances leading to live birth per scenario are calculated from the relevant year-specific chances applied to those couples that did not become pregnant in the previous year. For example, pregnancy chance with Scenario II, direct IVF = 49.5 + (100 − 49.5) × 0.111 = 55.1.
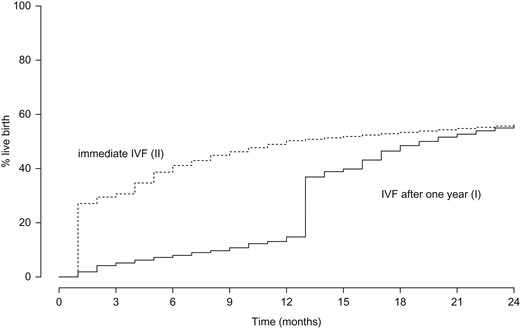
Cumulative chances of ongoing pregnancy leading to live birth, against time with 2 different scenarios for IVF.
Comparisons were made for patient profiles determined by the factors in the prediction models. Reference case analyses were performed using four ‘example’ patient profiles: both unexplained infertility and endometriosis at female ages 30 and 38 years, always with primary infertility of 3 years duration.
The health economic perspective was that of society. We therefore included direct and indirect medical and non-medical costs. The costs of trying to become pregnant without treatment was assumed to be zero. The direct medical costs of IVF/ICSI were determined from the per-cycle cost estimates from Bouwmans et al. (2008b). To this, we added an estimate of €596 per cycle as direct non-medical costs due to absence from work (Bouwmans et al., 2008a). The resulting total cost per cycle was applied to the data from all patients starting IVF/ICSI treatment used in the study from Lintsen et al. (2007) and for each patient, the costs over a 1-year period of treatment were aggregated. On these data, a prediction model for the costs of IVF over a 1-year period was developed using the same four factors as used in the prediction models for pregnancy chances, using linear regression analysis. The resulting model equations are available from the authors on request.
In case of an ongoing pregnancy leading to live birth, the costs of pregnancy, subsequent delivery and neonatal care were added to the costs of treatment. We used the estimates from Lukassen et al. (2004) for IVF conceived pregnancies: €2549 for a singleton and €13 469 for a twin pregnancy. In a sensitivity analysis, we used cost estimates for delivery and neonatal care following IVF and naturally conceived pregnancies from Chambers et al. (2007). The age-standardized estimates for singletons were €4624 and €4098 (difference: €526) with IVF and naturally conceptions, respectively. For twin pregnancies, the estimates were €14 114 and €13 350 (difference: €764), respectively. The cost-differences between IVF and treatment-independent pregnancies found by Chambers et al. (2007) were also applied in the standard analysis with costs of IVF pregnancies from Lukassen et al. (2004). We further assumed that 6.6% of IVF pregnancies were twins, as registered for the Netherlands in 2012, and 1% of treatment-independent pregnancies (NVOG, 2013; Chambers et al., 2007).
All costs were updated to the price level of 2014, using the national price index for the Netherlands from the Dutch Bureau of Statistics.
The CE comparison was made between Scenarios (II) (immediate IVF) and (I) (first wait for 1 year). The difference in live birth rate (effectiveness) between the scenarios was calculated as well as the difference in costs. The CE ratio, the cost difference divided by the effectiveness difference, indicates the extra costs per extra live birth of (II) versus (I). In order to translate the CE ratio to a policy recommendation, for each age the duration of infertility was determined at which a pre-specified threshold for the CE ratios is attained. Following standard methodology in economic appraisals, costs and effects were discounted to present values. A discount rate of 3.5% was used for both costs and effects, as recommended by NICE (2013).
The statistical uncertainty in the results was assessed by a bootstrapping method with 5000 replications. We used samples from the original waiting list cohort data, including the subsequent IVF treatment data, and re-estimated the prediction models for treatment-independent pregnancy chances and for pregnancy chances and costs of IVF on each sample. The resulting model predictions for the four base-case patient profiles were used to assess the difference in costs and effects of the two scenarios. From these resampled differences in costs and effects, a CE acceptability curve was derived that shows how, for the four patient profiles, the proportion of samples in which immediate IVF is cost-effective depends on the threshold value for the CE ratio.
An overview of the input parameters for the base-case analyses and the sensitivity analyses can be found in Supplementary Table SI.
Results
Characteristics of the study inclusion have been published before (Eijkemans et al., 2008). Briefly, there were 6221 patients rightfully included on the waiting list. From 259 patients, we could not find any data in the IVF clinics. Of 5962 patients, the follow-up could be established, and they formed the basis of analysis. The estimated proportion of treatment-independent ongoing pregnancies after 12 months was 9% (Eijkemans et al., 2008). Further, 4928 couples started IVF, resulting in an ongoing pregnancy rate of 45% within 12 months (Lintsen et al., 2007).
Live birth rates compared between the two scenarios
Table II shows, for the four reference case patient profiles, the treatment-independent live birth rates in the first and second year, the IVF live birth rates in the first and second year and the comparison between the two scenarios. The chances of a treatment-independent live birth differ between diagnostic categories and are lower for older age. IVF chances also decline with age, but they show less dependence on diagnostic category. All chances are lower in the second year than in the first year, but the differences vary over patient profiles. The chances with the direct IVF Scenario (II) are slightly higher than with the postpone IVF Scenario (I) and the difference depends more strongly on age than on the diagnostic category. The difference varies from 0.001 for unexplained infertility at 30 years to 0.039 for endometriosis at 38 years.
Costs of IVF treatment and costs of delivery and neonatal period of the two strategies, for four selected patient profiles (Euros).
| Diagnostic category | Patient profiles with primary subfertility of 3 years | |||
|---|---|---|---|---|
| Unexplained | Endometriosis | |||
| Age | 30 | 38 | 30 | 38 |
| Costs of IVF treatment in Year 1 | 4036 | 5067 | 4273 | 5304 |
| Costs of IVF treatment in Year 2 | 4062 | 5173 | 4299 | 5410 |
| Costs of Scenario I, postponing IVF 1 year | ||||
| IVF treatment | 3545 | 4711 | 4139 | 5271 |
| Delivery and neonatal period | 3247 | 1984 | 2648 | 1489 |
| Total | 6792 | 6695 | 6787 | 6759 |
| Costs of Scenario II, direct IVF | ||||
| IVF treatment | 4036 | 5067 | 4273 | 5304 |
| Delivery and neonatal period | 3343 | 2264 | 2712 | 1743 |
| Total | 7379 | 7331 | 6985 | 7047 |
| Total cost difference II – I (Δ-Costs) | 586 | 635 | 198 | 287 |
| Cost-effectiveness (CE) ratio | ||||
| (Δ-Costs/Δ-Effectiveness*) | 5 44 500 | 16 800 | 30 300 | 7300 |
| Discounting (C and E) with 3.5% per year | 56 500 | 16 600 | 19 400 | 8700 |
| Sensitivity analyses | ||||
| Discounting C with 4%, E with 1.5% per year | 1 20 800 | 18 700 | 33 000 | 10 200 |
| Discounting (3.5%), alternative costs** | 58 300 | 18 800 | 21 600 | 11 000 |
| Discounting (3.5%), Twins count for 2*** | 50 200 | 15 800 | 18 300 | 8500 |
*Δ-Effectiveness = Chance difference between Scenarios II and I, from Table I.**Costs for delivery and neonatal care from (Chambers et al. 2007).***Twin live births count as two successes in the CE ratio.
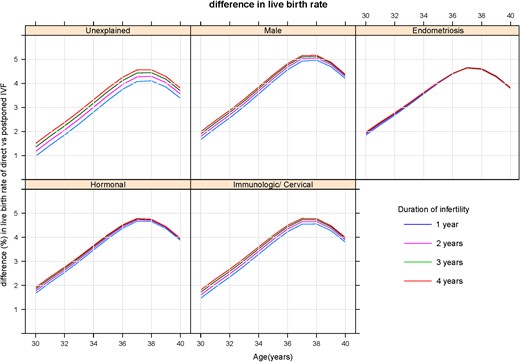
Difference in live birth chances between ‘Immediate IVF’ and ‘Delayed IVF for 1 year’, in relation to female age. Separate panels for diagnostic categories and separate curves for duration of infertility.
Costs and cost-effectiveness
Table II shows the costs and the CE comparison for the four reference case patient profiles. With older age, IVF becomes more costly, because more treatment cycles are needed to compensate for the decreased chances per cycle, and because the cost of medication per cycle increases (Bouwmans et al., 2008b). For each patient profile, the costs of IVF as well as the costs of delivery and neonatal period are higher in Scenario II, direct IVF, than in Scenario I, postponing IVF. Therefore, in total, direct IVF is more costly than postponing IVF. The undiscounted CE ratio, obtained by dividing the cost difference by the live birth rate difference, is very high for unexplained infertility at age 30: one extra live birth gained by direct IVF as compared with postponing IVF costs €544 500. The ratio is lowest for endometriosis at age 38: €7300 per live birth. When twins were regarded as two successes, CE ratios became lower, as expected, but the changes were minor. Discounting has a profound impact, making the very high ratio considerably lower. Using the costs for delivery and neonatal care from Chambers et al. (2007) had little impact on the CE ratios.
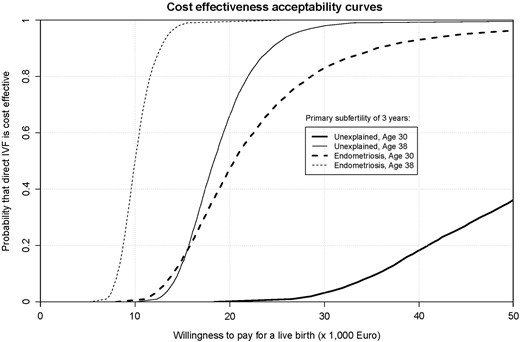
Results of a bootstrapping procedure with 5000 replications from the original cohort data (n = 5962): cost-effectiveness acceptability curves, representing the chance that immediate IVF is cost-effective against Society's willingness to pay for a live birth.
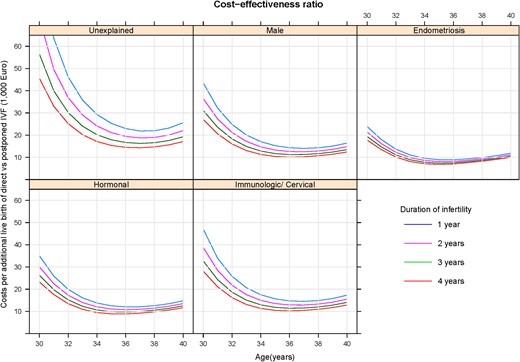
The CE ratio between ‘Immediate IVF’ and ‘Delayed IVF for 1 year’, in relation to female age. Separate panels for diagnostic categories and separate curves for duration of infertility. CE, cost-effectiveness.
Discussion
We conducted a CE analysis of starting IVF in couples with primary infertility versus postponing IVF for 1 year, stratifying on diagnostic category, age and duration of infertility. Observations from a large prospective study on IVF pregnancy chances and costs in the Netherlands, including estimates of treatment-independent pregnancy chances while on the waiting list for IVF, formed the empirical basis of the study. Results showed that the CE of IVF is most plausible for endometriosis, irrespective of the duration of infertility or age. For unexplained infertility, IVF may be postponed for women under 32 until the duration of infertility reaches >3 years, mainly because treatment-independent chances are still considerable while IVF chances after 1 year will hardly have decreased.
The loss in chance of a live birth due to postponing IVF for 1 year is always <6% and mainly depends on age (Fig. 2 and Table II). The couples that would otherwise have a live birth with IVF in the first year will either have a live birth from a natural pregnancy during the first year or from a pregnancy after IVF in the following year. The main effect of direct IVF compared with postponing IVF is therefore that some natural pregnancies are replaced by IVF pregnancies, against considerable extra costs. In a simulation study, Habbema et al. (2009) found a similar result.
From the present results, we can evaluate the current guideline for IVF in the Netherlands (NVOG, 2010). According to this guideline, the time when to start IVF or ICSI treatment depends on the cause of infertility, the duration of infertility and woman's age. When the problems are caused by pathology of the tubal function, such as tubal blockage or severe endometriosis, IVF should be offered directly. For severe male infertility (total motile count <3 million), there is also a direct indication for IVF or ICSI. In case of ovulation disorders (mainly caused by polycystic ovary syndrome, PCOS), at least 12 cycles of ovulation induction should precede IVF. For unexplained infertility, the treatment depends on the prognosis of a natural conception within a year based on the prognostic model of Hunault, which is based on female age, type of infertility, duration of infertility and motility of sperm (Hunault et al., 2004), if this is good, i.e. 30% or higher, an expectant management has to be advised for at least 6–12 months. If the chance of a spontaneous conception within 1 year is lower than 30%, or if the expectant management did not lead to a conception, IUI with MOH for three to nine cycles should precede IVF. Minimal endometriosis, one-sided tubal pathology, a cervical factor (cervical hostility or immunological infertility) and mild male infertility (total motile sperm count between 3 and 10 million) are treated as unexplained infertility. In all couples with an ovulation disorder or with unexplained infertility, IVF can be offered immediately if women are 38 years or older. The absolute (Dutch legal) age limit for IVF is 45 years of age, but the guideline advises not to treat women over 42 years of age, because of poor treatment outcome.
For the diagnostic category endometriosis, starting IVF directly according to the Dutch guideline coincides with a relatively low cost-effectiveness ratio for all durations of infertility (from 1 to 4 years, the ratio is below €10 000 per live birth). For couples with unexplained infertility, the duration of the infertility has a great impact on the cost-effectiveness. This coincides with the current Dutch guideline because it recommends that for couples with unexplained infertility the advise to start treatment or not depends on the chance of natural conception within 1 year. This chance becomes increasingly lower with a longer duration of infertility. For example, in couples with a female age of 32 and good semen motility the chance of natural conception only drops below 30% with a duration of at least 3 years, which is reason to start treatment. This coincides with a CE ratio of €29 310 per live birth. For couples with a duration of infertility of 1 and 2 years, the chance of natural conception is higher than 30% and the guideline advises to follow an expectant management of 6–12 months. If this advice is not followed and treatment is started than the CE ratio would be as high as €48 000 per live birth. For male infertility, one should be careful to conclude CE from our results. There was no differentiation on the waiting list between couples with mild male infertility, who will be treated with IVF, and couples with severe male infertility, who require ICSI. The cost-effectiveness ratio for the severe male group will therefore be lower than our results for the male category show. For the mild male group, the CE ratio is likely to be somewhere between the results that we found and the results for unexplained infertility.
The costs per extra live birth were above €10 000 for most combinations of diagnostic category, age and duration. Depending on the threshold level of the CE ratio per live birth, direct IVF becomes cost-effective, but this depends on the female age: the cost-effectiveness ratio decreases with age, reaching a minimum around age 35–37, after which it increases again. There is no consensus on the level of costs per extra live birth that is acceptable. This is in contrast with the standard in health economics, with the Quality Adjusted Life Years (QALY) as effectiveness measure. There, a threshold between €20 000 and €30 000 per QALY is generally considered as the limit of acceptability (NICE 2008, 2013). Up till now, no studies have been published that translated a pregnancy leading to birth of a child into a gain in QALY for the parents. Neither the individuals’ willingness to pay, which heavily depends on the persons income, nor the societal economic perspective of the child that is born (Neumann and Johannesson, 1994; Connolly et al., 2009) should play a role here. Consensus is lacking on what the right perspective should be (ESHRE Capri Workshop Group, 2015). We have restricted ourselves to the classical societal perspective used in other medical problems.
Limitations of our study are the following:
We applied estimates of chances with IVF, excluding frozen embryos, for which we had no data. However, it is plausible that the same factors influencing IVF pregnancy chances will affect the chances with frozen embryos. Concerning the calculation of costs, we added the costs due to absence from work to the direct medical costs of an IVF cycle (Bouwmans et al., 2008a). However, these costs only comprised the treatment period, and not the pregnancy period. Here, we implicitly assumed that the indirect non-medical costs of pregnancy and delivery are the same in the two scenarios. It may be questioned whether these costs are the same for singleton and twin pregnancies, but Polinder et al.(2008), in a randomized trial, did not find a significant difference for these costs. Next, our cost calculations include a ‘punishment’ in the costs of pregnancy and delivery for twins, which mainly result from transferring two embryos after IVF. Yet on the effect side, twins were counted as one success, just like singletons. Counting a twin as two successes would give an advantage to the direct IVF scenario. However, twins have more morbidity than singletons, and there is a growing tendency to abandon double embryo transfer. Currently in the Netherlands, dual embryo transfer is performed only after two fresh IVF treatments with single embryo transfer that did not lead to an ongoing pregnancy or for couples with a female age of at least 38 years from the first IVF treatment. This has not affected the pregnancy rates because this resulted in more pregnancies from frozen embryo transfers (McLernon et al., 2010), it has however resulted in less twin pregnancies. Because we did not include the results and costs for frozen embryo transfers in our data we do not know the exact result this new policy has on the CE. There are more costs from frozen embryo transfers but the pregnancies resulting from it also prevent couples from starting more fresh IVF cycle(s).
Another limitation is that when calculating the costs we did not consider the differences in the intrauterine foetal death rate between pregnancies after ART and spontaneous pregnancies. We based our cost estimates for delivery and neonatal care following IVF and natural conceived pregnancies on the study of Chamber et al. (2007). Unfortunately, the foetal deaths were excluded from that study.
Finally, the key aspect of our approach is in comparing two strategies: ‘immediate’ IVF versus ‘delayed’ IVF. A more simple comparison would be to compare 12-month chances with IVF with 12-month chances of expectant management. However, that comparison would be rather naive since it ignores that after 12 months couples with expectant management would start IVF anyway after that year. Nevertheless, our approach, using prediction models over a 12-month time horizon, is rather simplistic compared with more sophisticated approaches to CE analyses, such as Markov models with monthly chances. Although the latter may give more insight into what happens during the 12-month periods, the results after 2 year will be the same. Since we had to multiple subgroups, the emphasis in our analysis is on the overall results per sub group rather than details within subgroups.
Our calculations of treatment-independent pregnancy chances were based on data from a waiting list for IVF (Eijkemans et al., 2008) that comprised exposure time up to 2 years. We assumed that the treatment-independent chances after unsuccessful IVF are the same as for couples who never had IVF. A Danish 5-year cohort study in 818 couples starting ART found that 156 (19%) had delivered from a natural pregnancy, mostly after start of treatment (134 couples) (Pinborg et al., 2011). Likewise, Cahill et al. (2005), in a 3-year follow-up study, found that 18% of couples conceived naturally after unsuccessful IVF. These data seem consistent with, and in support of, our assumption on the pregnancy chances after IVF.
Just as was found previously by Mol et al. (2000), our results were highly sensitive to the application of a discount rate, particularly at ages around 30. IVF pregnancy chances do not, or only slightly diminish at that age, which means that there is no loss in pregnancy chances when postponing IVF for 1 year, but that there is a saving in costs of unnecessary IVF treatments. Therefore, CE ratio of immediate IVF is very high. When discounting future live births and costs, we imply that the preference for a child now would be higher than that of a child next year, leading to a larger difference between the scenarios in chances of pregnancy leading to live birth and consequently lower CE ratio. In support of applying discounting to future live births, a willingness-to-pay study using the direct choice experiment method found evidence of this time preference (Ryan, 1996). Further, it is likely that couples aged over 35 will feel a time pressure, especially when they consider having more than one child.
We conclude that the duration at which IVF becomes cost-effective depends, firstly on the level of society's willingness to pay for one extra live birth, and secondly, given a certain level of willingness to pay, on the female age and the diagnostic category. Couples with unexplained infertility and a female partner aged 31 or younger must have been waiting 3 years before IVF can be considered.
Supplementary data
Supplementary data are available at Human Reproduction online.
Acknowledgements
We would like to thank the participating clinics and all attending secretaries, fertility nurses and physicians for providing access to the patients’ medical files: Y.M. van Kasteren MD PhD (Medisch Centrum Alkmaar), P.F.M. van der Heijden MD PhD (Twenteborg Ziekenhuis, Almelo), A.W.J. Omtzigt MD PhD (Flevo Ziekenhuis Almere), M.J. Crooij MD PhD (Rijnland ziekenhuis, Alphen a/d Rijn), Fertility specialists (Meander Medisch Centrum, Amersfoort) C.B. Lambalk MD PhD and R Schats MD PhD (Academisch Ziekenhuis Vrije Universiteit, Amsterdam), F. van der Veen MD PhD (Academisch Medisch Centrum, Amsterdam), L.S. Oey MD (Onze Lieve Vrouwe Ziekenhuis, Amsterdam), L.J. van Dam MD PhD (Gelre Ziekenhuis, Apeldoorn), A.P.E. Schmoutziguer MD PhD and E. Blokzijl MD (Alysis Zorggroep, Arnhem), R.E. Bernardus MD PhD (Ziekenhuis Gooi-Noord, Blaricum), C.J.C.M. Hamilton MD PhD (Jeroen Bosch Ziekenhuis, Den Bosch), P.J.Q. van der Linden MD PhD (Deventer Ziekenhuis), P.Y. Dörr MD PhD (Medisch Centrum Haaglanden, Den Haag), P.A. van Dop MD PhD (Catharina Ziekenhuis, Eindhoven). H.W.B. Michgelsen MD (Medisch Spectrum Twente, Enschede), J.G. Santema MD PhD, and T. Spinder MD PhD (Medisch Centrum, Leeuwarden), N. Naaktgeboren PhD and F.M. Helmerhorst MD PhD (Leiden Universitair Medisch Centrum), J.L.H. Evers MD PhD and J.A. Land MD PhD (Academisch Ziekenhuis Maastricht), G.J. Pricker MD and G.M. Vermeulen MD PhD (Diaconessenhuis, Meppel), J.A.M. Kremer MD PhD (Universitair Medisch Centrum Nijmegen), R.S.G.M. Bots MD PhD (St. Elisabeth Ziekenhuis - Tilburg), A.H.M. Simons MD (Academisch Ziekenhuis Groningen), N.S. Macklon MD PhD (Erasmus Medisch Centrum, Rotterdam), A. Verhoeff MD PhD (Medisch Centrum Rijnmond Zuid, Rotterdam), M. van Haaften MD PhD (Diakonessenhuis, Utrecht), E.R. te Velde MD PhD and P. van Zonneveld MD PhD (Universitair Medisch Centrum Utrecht), H.J.L.A. Ruis MD PhD (Ziekenhuis Bernhoven, Veghel), M.A.H.M. Wiegerinck MD PhD (Maximá Medisch Centrum, Veldhoven), M.D.A. Lambers MD PhD and H.J.M. Roelofs MD (Albert Schweitzer Ziekenhuis, Zwijndrecht), R.A. Leerentveld MD PhD (Isala klinieken, Zwolle), C.T.B.J. Waegemaekers MD PhD (Rode Kruis Ziekenhuis, Den Haag).
Authors’ roles
M.J.C.E., A.M.E.L., C.C.H., C.A.M.B., L.H., D.D.M.B. and J.D.F.H. were involved in conception and design of the study. M.J.C.E. and A.M.E.L. led data collection, M.J.C.E. performed data analysis and interpretation, and wrote this manuscript. F.A.M.K. and A.M.E.L. contributed substantially to data-interpretation and manuscript revisions. C.C.H., C.A.M.B., L.H. and D.D.M.B. contributed to data interpretation and provided critical revision. All authors read and approved the final manuscript.
Funding
This study was supported by grants from the Netherlands Organisation for Health Research and Development (ZonMw grant 945-12-013). ZonMW had no role in designing the study, data collection, analysis and interpretation of data or writing of the report.
Conflict of interest
The authors declare that they have no competing interests.
