


Abstract
Do live birth rates (LBRs) differ between fresh embryo transfer (fresh ET) cycles and their subsequent paired frozen ET (FET) cycles, when comparing cycles based on the total FSH dose used during the fresh cycle?
When compared to the paired frozen embryo transfer cycles, the LBR in the fresh cycle of the highest total FSH dose group (>2500 IU) was reduced by 38%.
There may be a negative association with high gonadotropin doses and LBR after fresh ET. It is unknown whether a similar effect is seen in FET cycles, which are done with increasing frequency.
In this retrospective observational paired study, we studied IVF cycles between 10 January 2005 and 19 September 2015, for all patients who underwent a fresh, autologous IVF cycle that resulted in at least one fresh ET and at least one FET.
The study included 862 women, treated in our academic medical centre, who underwent 935 fresh ET and 1274 FET cycles. Cycles were allocated into three groups based on the total gonadotropin dose they received during their fresh IVF cycle: Group 1 (≤1800 IU FSH), Group 2 (1801–2500 IU), Group 3 (>2500 IU). The primary outcome was LBR after fresh ET and its subsequent paired FET(s), as well as LBR among fresh ETs and FETs as independent samples, based on the total FSH dose used. Implantation rates obtained from fresh and FET cycles were also compared.
The unadjusted fresh LBR was similar between Groups 1 and 2 (46.0% [95% CI: 40.4–51.6] versus 43.8% [38.3–49.4], respectively) but significantly lower in Group 3 (34.4% [29.5–39.8]). The unadjusted frozen transfer LBR was similar among all groups (51.4% [46.7–56.1] versus 46.3% [41.3–51.4] versus 47.5% [42.5–52.4], respectively). When logistic regression analysis with generalized estimating equations was used to control for confounders, the adjusted LBR was found to be similar between the groups both for fresh (odds ratio [OR] = 0.97 [95% CI: 0.61–1.56] Group 2 versus Group 1, OR = 0.69 [0.39–1.21] Group 3 versus Group 1) and FET cycles (OR = 0.87 [0.58–1.31] Group 2 versus Group 1, OR = 0.95 [0.58–1.55] Group 3 versus Group 1). However, for Group 3, the adjusted fresh LBR was 38% lower than its subsequent frozen transfer LBR (OR = 0.62 [0.41–0.93]); this was a statistically significant difference, which was not observed in Group 1 (OR = 0.85 [0.56–1.27]) or Group 2 (OR = 0.95 [0.64–1.41]).
This study is a retrospective cohort, with all of the associated inherent biases.
Fresh LBR is negatively impacted by a high dose of total FSH used, as compared to the LBR in subsequent paired FET cycles. Frozen transfer LBR seems unaffected by the total FSH dose used in the fresh cycle, suggesting that the endometrium may be adversely affected, probably indirectly, by high dose gonadotropin use in the fresh IVF cycle only.
No funding source was used for the completion of this project. There are no conflicts of interest.
Introduction
In order to attain high cumulative pregnancy rates, most infertility clinics performing IVF use gonadotropins in supraphysiologic doses that allow for the retrieval of multiple mature oocytes. It is generally accepted that with higher total doses of gonadotropins, there is a higher yield of mature oocytes obtained at ultrasound-guided oocyte retrieval (Hoomans et al., 2002; Sterrenburg et al., 2011), particularly in younger women (Yong et al., 2003) or in those with good ovarian reserve (Harrison et al., 2001; Eppsteiner et al., 2014). However, this relationship is inconsistent, with several studies not observing this effect (Out et al., 2000; Tan et al., 2005), particularly if the dose is increased after initial follicular recruitment is complete (van Hooff et al., 1993) or if ovarian reserve is poor (Klinkert et al., 2005). Indeed, many studies showing higher numbers of oocytes at retrieval with higher gonadotropin doses have not demonstrated any differences in clinical outcomes such as clinical pregnancy rate in fresh IVF cycles (Harrison et al., 2001; Hoomans et al., 2002; Sterrenburg et al., 2011).
One large, recently published retrospective analysis of over 600 000 IVF cycles demonstrated a negative association with increasing gonadotropin dose and live birth rate (LBR) after fresh embryo transfer (fresh ET); the effect was persistent with increasing age, and in even the best-prognosis patients (<35 years old, BMI < 30 kg/m2, no ovulatory dysfunction) (Baker et al., 2015). This study provides the best information, to date, suggesting an effect of gonadotropin dose on pregnancy outcome, and prompted us to question whether this effect is primarily an adverse effect on oocyte development and maturation or a negative effect on endometrial receptivity. To further investigate this, one would need to compare clinical outcomes of pregnancy and/or live birth in frozen embryo transfer (FET) cycles (where the lining had not been exposed to supraphysiologic doses of gonadotropins) with that from fresh ET cycles, using sibling embryos that were obtained from the same cohort of oocytes, in a paired study design. As the SART CORS and NASS database systems only recently allowed pairing outcomes of fresh and frozen cycles from the same cohort for 2014 and onward, we sought to determine, in our own centre's experience, whether gonadotropin dose in the fresh ET cycle could be associated with FET outcome in subsequent cycles. If gonadotropin dose negatively affected both fresh ET and FET outcome, this would suggest lingering effects of high dose gonadotropins on oocyte/embryo competence and quality, whereas a lack of an association of gonadotropin dose with FET outcomes could suggest primarily negative indirect effects of high dose gonadotropins on the endometrium in a fresh cycle.
In this study, we hypothesized that high total gonadotropin dose used in the fresh cycle would have a negative impact on LBR in both fresh ET and FET cycles using sibling embryos obtained from the same ultrasound-guided oocyte retrieval and transferred to the same uterus. Using our centre's data, we included fresh IVF cycles that were followed by at least one FET, stratified by total FSH dose used during the cycle and compared LBR from the fresh ET and successive FET cycles.
Materials and Methods
Our study population was comprised of all autologous IVF cycles between 10 January 2005 and 19 September 2015, for patients who underwent a fresh IVF cycle which resulted in at least one fresh ET and one successive frozen embryo transfer. Donor oocyte cycles, gestational carrier cycles and cycles with no fresh ET (also known as ‘freeze-all’) were excluded, as were cycles where preimplantation genetic testing was utilized.
Ovarian stimulation for fresh IVF cycles was achieved by the most commonly utilized protocols, including long luteal gonadotropin releasing hormone (GnRH) agonist, microdose agonist flare, or GnRH antagonist with or without estrogen or oral contraceptive priming, based on patient characteristics and clinician preference. All patients received both recombinant FSH as well as urinary menotropins, with the daily dose determined by baseline antral follicle count, serum estradiol levels, and follicular growth in successive transvaginal sonograms. Ovulation was triggered in all patients when there were at least two follicles with ≥18 mm diameter on transvaginal ultrasound, via either hCG (standard) or leuprolide injection (used only on high-responder patients following antagonist protocols). Ultrasound-guided oocyte retrieval was performed 36 h after trigger injection.
Cycles were categorized based on the total FSH dose received in the fresh cycle. Since we always use a combination of recombinant FSH and HMG for ovarian stimulation, this dose was calculated by multiplying the number of vials of HMG administered by 75 mIU, and adding this value to the total dose of recombinant FSH administered. We categorized our data by dividing the total FSH dose into tertiles, primarily to have similar number of cycles in each group to compare: Group 1: ≤1800 units, Group 2: 1801–2500 units, and Group 3: >2500 units. Additionally the data were categorized by total gonadotropin dose, calculated by multiplying the number of vials of HMG administered by 150 mIU (FSH and LH), and adding this value to the total dose of recombinant FSH administered. Demographic and cycle characteristics were assessed, including patient age, BMI, antral follicle count (AFC), infertility diagnosis, smoking status, length of stimulation, number of oocytes retrieved, day of transfer, number of embryos transferred and number of embryos cryopreserved.
Implantation rate was calculated by dividing the number of gestational sacs observed on transvaginal ultrasound following ET by the number of embryos transferred per study group.
The vast majority of FET cycles (>99%) were completed using an incremental dose of oral estradiol (4–6 mg daily for 17–35 days) followed by transvaginal ultrasonography to confirm the absence of folliculogenesis and the presence of an endometrial thickness measuring at least 6 mm. Intramuscular progesterone in oil was then started at 50–75 mg daily, and FET was performed on the sixth day of progesterone use. A small fraction (<1%) of FETs were done during natural cycles or with the addition of vaginal estradiol in order to obtain an endometrial thickness ≥6 mm in patients with a history of poor endometrial development.
Statistical analyses
Using data sampling characteristics from our study population that was comprised of 1274 frozen cycles from 862 patients, the detectable effect size for comparing LBRs among gonadotropin dose groups at the 0.05 significance level with 0.80 power was calculated prior to the statistical analysis. With a 51% expected LBR for Group 1, 1.5 cycles per patient, intra-cluster correlation of 0.09, and variance inflation factor due to covariates of 1.26, a 0.40 reduction in odds of live birth for Group 3 relative to Group 1 would be detected (Hsieh et al., 1998; Machin, 2009).
Logistic regression, fitted using the generalized estimating equations (GEE) method, was performed to test for the association between live birth and gonadotropin dose. The GEE method was used to account for correlation of outcomes from multiple cycles from the same patient. In addition, the association was also examined while adjusting for confounding variables, which included age, BMI, AFC, infertility diagnosis, smoking status, duration of ovarian stimulation, number of oocytes retrieved, number of embryos transferred and day of embryo transfer (3 days post insemination versus 5 days post insemination). The effect of gonadotropin dose was expressed as odds ratio (OR) with a 95% CI. These statistical analyses were performed using SAS (version 9.4).
Ethical approval
The study of this patient population and clinical outcomes was approved by the University of Iowa Institutional Review Board (IRB #201303841).
Results
We obtained data for 862 women who underwent 935 fresh ET and 1274 FET cycles over the 10-year study period. A total of 70 women underwent two or three fresh cycles with consecutive FETs over the study period.
Participant demographic characteristics are presented in Table I. Women in the higher gonadotropin dose groups were older, had a higher mean BMI, and had lower antral follicle counts. Women with lower doses of gonadotropins had a shorter stimulation length, lower daily dose of gonadotropins, more mature oocytes retrieved, fewer embryos transferred and more embryos cryopreserved.
Demographic characteristics of study population.
| Variable | FSH | P | ||
|---|---|---|---|---|
| Group 1 (≤1800 units) | Group 2 (1801–2500 units) | Group 3 (> 2500 units) | ||
| (n = 304 cycles, 293 subjects) | (n = 305 cycles, 295 subjects) | (n = 326 cycles, 303 subjects) | ||
| Fresh Cycle Characteristics (n = 935) | ||||
| Age, Mean (SD) | 30.0 (3.8) | 32.3 (3.9) | 33.6 (4.2) | <0.0001 |
| BMI | ||||
| Mean (SD) | 25.0 (5.1) | 26.8 (6.0) | 28.8 (7.5) | <0.0001 |
| Median [IQR] | 23.6 [21.5–27.6] | 25.5 [22.5–29.7] | 27.4 [22.7–33.0] | |
| Range | 17.0–48.0 | 17.6–51.4 | 17.6–54.6 | |
| Female diagnosis | ||||
| AMA | 14 (4.8%) | 28 (9.5%) | 69 (22.8%) | <0.0001 |
| Endometriosis | 33 (11.3%) | 41 (13.9%) | 49 (16.2%) | 0.221 |
| Anovulatory | 94 (32.1%) | 65 (22.0%) | 69 (22.8%) | 0.008 |
| Ever-smoker | 62 (23.5%) | 62 (23.4%) | 54 (19.9%) | 0.527 |
| Antral Follicle count | <0.0001 | |||
| Median [IQR] | 29 [22–39] | 25 [18–33] | 19 [13–27] | |
| Range | 6–60 | 4–78 | 0–51 | |
| Stimulation duration (days) | <0.0001 | |||
| Median [IQR] | 9 [8–9] | 9 [9–10] | 11 [10–12] | |
| Range | 6–12 | 7–12 | 7–18 | |
| Daily FSH dose (units) | ||||
| Median [IQR] | 172.5 [150–200] | 234.4 [225–250] | 300 [263–338] | <0.0001 |
| Range | 105–246 | 169–309 | 200–475 | |
| Retrieved Metaphase two Oocytes | <0.0001 | |||
| Median [IQR] | 9 [6–12] | 8 [5–9] | 7 [5–9] | |
| Range | 1–26 | 0–26 | 0–22 | |
| Day of transfer | 0.004 | |||
| 3 | 35 (11.5%) | 41 (13.4%) | 68 (20.9%) | |
| 5 | 269 (88.5%) | 264 (86.6%) | 258 (79.1%) | |
| Number transferred | <0.0001 | |||
| 1 | 218 (71.7%) | 197 (64.6%) | 168 (51.5%) | |
| 2 | 85 (28.0%) | 105 (34.4%) | 144 (44.2%) | |
| 3–4 | 1 (0.3%) | 3 (1.0%) | 14 (4.3%) | |
| Number cryopreserved | <0.0001 | |||
| Median [IQR] | 5 [2–9] | 4 [2–8] | 3 [2–6] | |
| Range | 1–27 | 1–32 | 1–23 | |
| Frozen cycle characteristics (n = 1274) | ||||
| Number transferred | 0.163 | |||
| 1 | 245 (54.8%) | 234 (55.1%) | 194 (48.3%) | |
| 2 | 198 (44.3%) | 186 (43.8%) | 194 (48.3%) | |
| 3–4 | 4 (0.9%) | 5 (1.2%) | 14 (3.5%) | |
*Among cycles, 29 subjects were in more than a single gonadotropin group as they completed more than one fresh cycle during the study period.
AMA, advanced maternal age.
The distribution of total FSH dose was skewed to the right, with greater variation of dosing at the higher end of the spectrum as compared to the lower end, ranging from 844 to 6375 units. Ovarian stimulation protocols used are shown in Table II. Microdose agonist flare and GnRH antagonist protocols were favoured over long luteal GnRH agonist protocol in patients who received higher FSH doses.
Medication protocols used to achieve ovarian stimulation in fresh IVF cycles.
| Protocols | Group 1 (≤1800 units) | Group 2 (1801–2500 units) | Group 3 (>2500 units) |
|---|---|---|---|
| GnRH antagonist | 27 | 29 | 53 |
| Luteal GnRH agonist | 158 | 234 | 165 |
| Microdose flare | 19 | 42 | 108 |
| Protocols | Group 1 (≤1800 units) | Group 2 (1801–2500 units) | Group 3 (>2500 units) |
|---|---|---|---|
| GnRH antagonist | 27 | 29 | 53 |
| Luteal GnRH agonist | 158 | 234 | 165 |
| Microdose flare | 19 | 42 | 108 |
P < 0.001.
The overall implantation rate obtained from fresh ET was 42.9% as compared to 45.5% obtained from FET cycles (P = 0.14). Group specific implantation rates are listed in Table III. Fresh cycle implantation rates were significantly different between groups (P < 0.001), whereas implantation rates obtained from FET cycles were similar between groups (P = 0.70). The daily FSH dose range in each group is shown in Fig. 1.
Probability of live birth by total FSH dose.
| Total FSH dose | Implantation rate (%)a | Live birth rate (95% CI)b | Adjusted OR (95% CI) |
|---|---|---|---|
| Fresh ET cycles | |||
| Group 1 (≤1800 units) | 50.9 | 46.0% (40.4–51.6) | 1.00 (referent) |
| Group 2 (1801–2500 units) | 43.7 | 43.8% (38.3–49.4) | 0.97 (0.61–1.56) |
| Group 3 (>2500 units) | 35.9 | 34.4% (29.5–39.8) | 0.69 (0.39–1.21) |
| FET cycles | |||
| Group 1 (≤1800 units) | 45.5 | 51.4% (46.7–56.1) | 1.00 (referent) |
| Group 2 (1801–2500 units) | 44.3 | 46.3% (41.3–51.4) | 0.87 (0.58–1.31) |
| Group 3 (>2500 units) | 46.7 | 47.5% (42.5–52.4) | 0.95 (0.58–1.55) |
aNumber of gestational sacs documented on transvaginal ultrasound divided by the number of embryos transferred.
bCI, confidence intervals.
cOR, odds ratio, n = 1808 cycles.
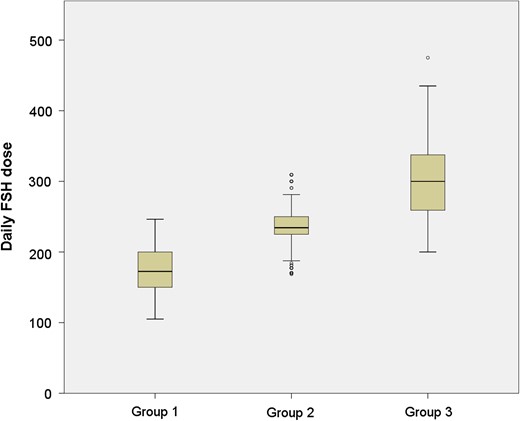
Boxplot of daily FSH dose among study groups. The distribution of daily FSH dose among the study groups (Group 1: total FSH dose ≤1800 units, Group 2: 1801–2500 units, Group 3: >2500 units) is shown.
Unadjusted rates of live birth are outlined in Table III and Fig. 2. For fresh cycles, the LBRs were comparable between Groups 1 and 2 (46.0% [95% CI: 40.4–51.6] versus 43.8% [38.3–49.4]) but decreased at a total FSH dose of >2500 (34.4% [95% CI: 29.5–39.8]). FET LBRs remained relatively constant over the FSH dose categories (51.4% [95% CI: 46.7–56.1] versus 46.3% [95% CI: 41.3–51.4] versus 47.5% [95% CI: 42.5–52.4]).
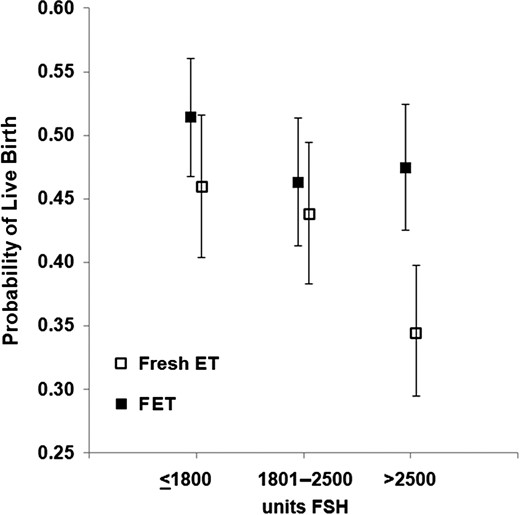
Unadjusted live birth rate (LBR) for fresh and frozen embryo transfers. LBRs in fresh embryo transfer (ET) cycles decreased after a total FSH dose of >2500 units, whereas in frozen ET (FET) cycles, LBRs remained relatively constant.
Logistic regression with GEE was performed to control for the confounding variables of age, BMI, AFC, infertility diagnosis, smoking status, duration of ovarian stimulation, number of oocytes retrieved, number of embryos transferred and day of embryo transfer (3 days post insemination versus 5 days post insemination). The total number of cycles included in this analysis was 1808 (fresh and frozen combined) due to the missing data in some fields. The adjusted LBR was calculated, using the group that received the lowest FSH dose as the reference group. Once the data were adjusted for confounding variables, we no longer noted a statistically significant difference in LBR in fresh cycles between higher gonadotropin dose groups as compared to the lowest one (Table III). FET LBRs remained comparable between study groups after the logistic regression analysis. However, when comparing LBR in fresh versus frozen cycles in a paired fashion, we found that the adjusted LBR was 38% lower (OR = 0.62, 95% CI: 0.41–0.93) after fresh ET in Group 3, where the total FSH received was >2500 units. In contrast, the adjusted LBR was similar between fresh and subsequent paired FET cycles in Groups 1 and 2 (OR = 0.85, 95% CI: 0.56–1.27 and OR = 0.95, 95% CI: 0.64–1.41, respectively).
We performed the same analysis using total gonadotropin dose (recombinant FSH plus urinary FSH plus urinary LH) administered to our patients. The doses were again divided into tertiles and the results for LBR (unadjusted and adjusted for the same factors) were found comparable to that obtained exclusively using total FSH dose (Supplementary Tables SI and SII). There was a 35% decrease in LBR for fresh ET cycles as compared to the paired FET cycles in which the total gonadotropin dose was at least 3000 units.
Discussion
Our unadjusted analysis suggests that, in our population, high total FSH dose (>2500 units) during ovarian stimulation for IVF is associated with lower LBR in fresh ET cycles, consistent with the previously published data by Baker et al. However, when the confounders including age, BMI, infertility diagnosis, smoking status, number of embryos transferred and the day of the ET were controlled for, this association disappeared. While our results are different from the work published by Baker et al., the different designs of the two studies likely explain why. In their main analysis, Baker et al. analyzed the predictors of LBR in their study population by logistic regression with total gonadotropin dose and number of oocytes retrieved being the potential predictors; however, any potential confounders (including number of embryos transferred) were not clearly outlined. As high gonadotropin dose is commonly a surrogate for diminished ovarian reserve (which is itself associated with decreased LBRs (Levi et al., 2001)), we felt this diagnosis was important to keep in our logistic regression modelling. It is also possible that a much larger study than ours is required to see a significant impact of total FSH dose on fresh ET outcomes (over 600 000 fresh autologous cycles from 9 years of SART data were reviewed in the Baker study). They also ran a subgroup analysis in good-prognosis patients (age < 35, BMI < 30 kg/m2, no diagnosis of diminished ovarian reserve, endometriosis and ovulatory disorder) using number of days of gonadotropin stimulation and average daily gonadotropin dose as potential confounders. They reported that the LBR decreased significantly as the total gonadotropin dose increased both in their primary and subgroup analyses, regardless of the number of oocytes retrieved. Good-prognosis patients, who received an average daily dose of >300 units of FSH had lower LBR across all ages and numbers of oocytes retrieved in the subgroup analysis. Additionally, we included a GEE model in our study, which we believe is imperative to account for correlation of outcomes from multiple cycles from the same patient, which was not reported to be done by Baker et al.
There were significant differences among several demographic and other characteristics between our study groups. Patients who used higher total FSH dose were older, had higher BMI, and lower AFC. Additionally they required longer ovarian stimulation (and higher daily FSH dose) with fewer mature oocytes retrieved, with a higher proportion of Day 3 ET than Day 5 ET, a lower single ET rate, and fewer embryos cryopreserved. These findings support the well-known concept that high dose gonadotropins are typically used for poor responder patients. Therefore, the lower LBR obtained after fresh ET from the high total gonadotropin group may just be an indication of reproductive senescence. The significant difference between LBR after fresh ET among the three study groups disappeared when these confounders were controlled for by the logistic regression analysis. However, the highest total gonadotropin dose group continued to have 38% lower LBR as compared to its paired subsequent FET cycle, which suggests an independent adverse effect likely to be due solely to the high total gonadotropin dose used. Additionally, the LBR obtained from the FET cycles of Group 3 were comparable to those of other groups, despite their reproductive senescence and other poor prognostic indicators.
When LBRs from FET cycles are independently compared among themselves, there does not appear to be any difference based on the total FSH dose used in the fresh cycle. However, when LBRs from fresh ET cycles were compared to their subsequent frozen cycles in a paired fashion, a 38% reduction became apparent when the total FSH dose exceeded 2500 units. We believe that the presence of this significant difference in LBR between paired fresh and FET cycles, and the absence of a difference between independent FET cycles, suggest that high gonadotropins may have a predominantly negative effect on the endometrium, likely in an indirect fashion, more so than on oocyte development and quality.
If high total gonadotropin dose has a negative impact on the oocyte/embryo quality, the LBR from FET cycles that required high gonadotropin doses would chronically remain low, as compared to the LBR from FET cycles that required lower gonadotropin doses. Since LBRs remained comparable among FET cycles with varying gonadotropin doses (and significantly higher than the LBR obtained from its preceding fresh ET), the negative impact of high gonadotropin dose has to be limited to the fresh ET cycle itself, most likely on the other major determinant of implantation, the endometrium. Additionally, embryos of the highest quality are typically chosen for transfer in fresh cycles in most ART centres performing fresh ETs, including our own. Therefore, a subsequent FET from the same cohort of embryos involves either a similar or lower quality embryo as compared to the fresh ET. Obtaining a higher LBR from such ‘equal-or-lesser-quality’ embryos in FET cycles, in which the endometrium is not exposed to high gonadotropin doses, supports the notion that the endometrium, rather than the oocyte/embryo, is adversely affected by high gonadotropin doses.
There is a paucity of in vivo data on the negative effect of FSH directly on the endometrium, although in vitro, high doses of recombinant follitropin alpha has been shown to inhibit human endometrial cell proliferation (Chang et al., 2011). Therefore, the impact of FSH on the endometrium is likely to be an indirect one, namely through the elevated levels of estrogen and progesterone that accompany ovarian stimulation cycles and disrupt normal endometrial architecture and maturity (Bourgain and Devroey, 2003). The high serum estradiol levels associated with a more aggressive stimulation have previously been associated with lower LBRs in fresh cycles (Mitwally et al., 2006; Joo et al., 2010) and parallels the same peak and fall as the association between oocyte quantity and LBR (Sunkara et al., 2011). It is well described that individual follicle contributions of progesterone, as a result of a robust ovarian stimulation cycle, can result in a premature progesterone rise (Yding Andersen et al., 2011), despite the use of GnRH agonists/antagonists in an IVF cycle. Use of FSH specifically has also been shown to result in a higher peak progesterone level at the ovulation trigger than similar doses of urinary menotropins (Andersen et al., 2006). Serum progesterone levels can be correlated with daily FSH dose in IVF cycles (Bosch et al., 2010), and IVF cycles with elevated progesterone levels are associated with higher FSH doses, even when the estradiol level, follicular number and oocyte quantity were equivalent (Bosch et al., 2003). This latter data may better account for the premature progesterone rise phenomenon in women with diminished ovarian reserve who do not have supernumerary follicles contributing progesterone, but do typically have high total FSH doses (Younis, 2011). Elevated progesterone levels in ovarian stimulation can change the structure and function of the follicular phase endometrium at the levels of both gene expression level and histology (Labarta et al., 2011; Zapantis et al., 2013; Haouzi et al., 2014), and a premature progesterone rise accompanying a fresh IVF cycle and transfer has been negatively associated with implantation rate (Bosch et al., 2003), ongoing pregnancy rate (Bosch et al., 2010), and LBR (Huang et al., 2012; Lahoud et al., 2012; Ochsenkuhn et al., 2012; Hill et al., 2015), whereas it has not been associated with adverse outcomes in FET cycles (Kofinas et al., 2016). We hypothesize that the longer stimulation duration and high gonadotropin use in Group 3 may cause the fresh cycle endometrium to be out of phase and result in lower implantation and LBRs after these fresh ETs. Unfortunately, we do not routinely measure estrogen and progesterone level on the day of hCG trigger, which may be one way of confirming this association in a future study.
Higher total doses of gonadotropins may yield higher numbers of retrieved and mature oocytes in select patient groups, but may also be associated with negative factors, such as medication cost, development of ovarian hyperstimulation syndrome, and adverse effects on the developing oocytes and/or endometrium due to the supraphysiologic levels of estradiol. We actually did not observe a higher ovarian response in our study with high dose FSH use, as indicated by the oocyte yield in Table I. Our centre is a relatively conservative one in the use of gonadotropins for IVF as compared to some other centres in the United States. In our study, Group 3 contains patients that used highest gonadotropin doses for IVF, but even the doses used for these patients may look moderate when compared to the average use of these medications in some other centres in our nation. Therefore, our results may not be sufficient to document the impact of FSH use at total doses of >5000 units, although our data do contain a few of these cycles. Nevertheless, our observation of diminished implantation and LBRs in fresh IVF cycles with the use of FSH in the range of doses administered by our centre remains valid, and one may speculate that the negative impact may become even more pronounced when higher doses are used.
To our knowledge, this is the first study to compare the LBRs from fresh ET and subsequent FET cycles in a paired fashion. Our study is unique in that we could compare the LBRs for paired fresh ET and FET cycles of sibling embryos resulting from the same stimulation protocol, and on the same patient, something that the current national databases are not yet supported to do. Additionally, the size of our study and its inclusion of a general linear model in the statistical analysis give strength to the findings, and help avoid possible correlations between outcomes due to a group of patients undergoing repetitive ETs.
Our study's limitations include its retrospective nature, though one that is necessary in a preliminary analysis designed to prompt additional questions for future studies, potentially with the use of the national databases in the future. The nature of fertility treatment is often not ethically or practically amenable to randomization of gonadotropin dose, and thus an observational study like ours is the most reasonable option for initial testing. Another common concern in studies such as this is that several couples undergoing repetitive fresh and frozen cycles were included in the analysis, possibly creating an unknown correlation between outcomes. One way to avoid this concern is to use GEE to estimate the parameters of a generalized linear model. Since our study population included 70 women who underwent two or three fresh ETs followed by subsequent FETs, we employed this layer of statistical analysis to avoid this potential methodologic error.
In conclusion, we present data, from our own centre, which suggest that patients who receive high total FSH doses during ovarian stimulation have lower LBRs after fresh ET as compared to the LBR from their own subsequent FET. We conclude that this is likely due to adverse effects on the endometrium, rather than on oocyte quality, and propose that additional cohort studies examine these effects in large, diverse populations, and certainly when national databases with linked fresh ET and FET outcomes become available. If such adverse effects with high gonadotropin dose are confirmed, deferring fresh ETs to a subsequent FET cycle may be a first line option in patients who have received a high dose of gonadotropins during their ovarian stimulation for IVF. For all other patients, fresh ET remains a viable option at this time.
Supplementary data
Supplementary data are available at Human Reproduction online.
Authors’ roles
E.M.M., A.E.S., B.J.V. and E.H.D. participated in the study's concept and design, with M.B.Z. adding statistical design elements. E.M.M., A.E.S., M.B.Z. and E.H.D. executed the data analysis. E.M.M. and E.H.D. drafted the article and all authors contributed to and agreed on the final article.
Funding
No funding source was used for the completion of this project.
Conflict of interest
None to declare.
