


Abstract
Are in-utero or peripubertal exposures to phthalates, parabens and other phenols found in personal care products associated with timing of pubertal onset in boys and girls?
We found some associations of altered pubertal timing in girls, but little evidence in boys.
Certain chemicals in personal care and consumer products, including low molecular weight phthalates, parabens and phenols, or their precursors, are associated with altered pubertal timing in animal studies.
Data were from the Center for the Health Assessment of Mothers and Children of Salinas (CHAMACOS) longitudinal cohort study which followed 338 children in the Salinas Valley, California, from before birth to adolescence.
Pregnant women were enrolled in 1999–2000. Mothers were mostly Latina, living below the federal poverty threshold and without a high school diploma. We measured concentrations of three phthalate metabolites (monoethyl phthalate [MEP], mono-n-butyl phthalate and mono-isobutyl phthalate), methyl and propyl paraben and four other phenols (triclosan, benzophenone-3 and 2,4- and 2,5-dichlorophenol) in urine collected from mothers during pregnancy and from children at age 9. Pubertal timing was assessed among 179 girls and 159 boys every 9 months between ages 9 and 13 using clinical Tanner staging. Accelerated failure time models were used to obtain mean shifts of pubertal timing associated with concentrations of prenatal and peripubertal biomarkers.
In girls, we observed earlier onset of pubic hair development with prenatal urinary MEP concentrations and earlier menarche with prenatal triclosan and 2,4-dichlorophenol concentrations. Regarding peripubertal biomarkers, we observed: earlier breast development, pubic hair development and menarche with methyl paraben; earlier menarche with propyl paraben; and later pubic hair development with 2,5-dichlorophenol. In boys, we observed no associations with prenatal urinary biomarker concentrations and only one association with peripubertal concentrations: earlier genital development with propyl paraben.
These chemicals are quickly metabolized and one to two urinary measurements per developmental point may not accurately reflect usual exposure. Associations of peripubertal measurements with parabens may reflect reverse causality: children going through puberty early may be more likely to use personal care products. The study population was limited to Latino children of low socioeconomic status living in a farmworker community and may not be widely generalizable.
This study contributes to a growing literature that suggests that exposure to certain endocrine disrupting chemicals may impact timing of puberty in children.
This study was funded by the National Institute of Environmental Health Sciences and the US Environmental Protection Agency. The authors declare no conflicts of interest.
N/A.
Introduction
Over recent decades, girls and possibly boys have experienced pubertal onset at progressively younger ages (Euling et al., 2008). Earlier age at puberty is associated with increased risk of mental health problems and risk-taking behaviors (Flannery et al., 1993; Graber et al., 2004) as well as increased risk of breast and ovarian cancer in girls (Kelsey et al., 1993; Riman et al., 1998) and testicular cancer in boys (Forman et al., 1994). Although many factors have been promulgated to explain this phenomenon, one possible explanation is exposure to endocrine disrupting compounds in the environment (Buck Louis et al., 2008).
Several chemicals that are commonly used in cosmetics, personal care products and other scented household items have been shown to exhibit endocrine disrupting properties (Witorsch and Thomas, 2010). These chemicals include certain low molecular weight phthalates, such as diethyl phthalate (DEP), which is found in scented products such as perfumes, deodorants, soaps and shampoo, and di-n-butyl phthalate (DnBP) and di-isobutyl phthalate (DiBP), which can be used in nail polish and cosmetics (Dodson et al., 2012). In animal studies, developmental exposure to DnBP and DiBP induces anti-androgenic effects including feminized traits, abnormal reproductive development and later puberty in male rats, although the effects are less strong in females (Mylchreest et al., 2000; Saillenfait et al., 2008).
Parabens, including methyl and propyl paraben, are commonly used as preservatives in cosmetics (Guo and Kannan, 2013) and demonstrate weak estrogenic properties (Boberg et al., 2010), which induce changes in pubertal timing in female rats (Vo et al., 2010). Environmental phenols used in personal care products include triclosan, an antibacterial agent that can be used in hand soap and some toothpaste (Dann and Hontela, 2011), and benzophenone-3, a sunscreen agent that is also added to cosmetics such as lipsticks, hairsprays, shampoos and skin lotions to increase the products’ durability (Han et al., 2016). In animal studies, triclosan has been found to have estrogenic potency (Stoker et al., 2010) which can disrupt LH, FSH and testosterone secretion (Kumar et al., 2008), and can alter pubertal timing in female rats (Rodriguez and Sanchez, 2010; Stoker et al., 2010). Research on benzophenone-3 is more limited, but it has exhibited weak estrogenic properties in vitro and in animal studies (Schlumpf et al., 2001). Other environmental phenols include 2,4-dichlorophenol, a photo-degradation product of triclosan (Canosa et al., 2005), which is also an intermediate in the manufacturing of the herbicide 2,4-dichlorophenoxyacetic acid, and 2,5-dichlorophenol, a metabolite of 1,4-dichlorobenzene, which is used in moth balls and room and toilet deodorizers (Ye et al., 2014).
Exposure to these phthalates, parabens, and phenols is widespread. In the United States, >96% of women participating in the nationally representative National Health and Nutrition Examination Survey (NHANES) had detectable concentrations of DEP, DnBP or DiBP metabolites in their urine (Zota et al., 2014). Methyl and propyl parabens were found in >90% of individuals (Calafat et al., 2010), triclosan in 75% (Calafat et al., 2008b), benzophenone-3 in 97% (Calafat et al., 2008a), and 2,4-dichlorophenol and 2,5-dichlorophenol in >80% (Ye et al., 2014) of women.
To date, very few human studies have examined associations of these phthalates, parabens and phenols with timing of puberty. The prenatal and peripubertal periods are critical windows in reproductive development that may be particularly sensitive to endocrine disruption. Only one study, the ELEMENT Study in Mexico City, has examined prenatal exposures in relation to pubertal timing in girls (Watkins et al., 2017b) and boys (Watkins et al., 2017a). A small number of studies have examined peripubertal exposures to these compounds, mainly in girls, but the results have been inconsistent (Mouritsen et al., 2010, Buttke et al., 2012; Frederiksen et al., 2012; Wolff et al., 2014, 2015; Binder et al., 2018).
In the present study, we examined urinary biomarker concentrations of several phthalates, parabens and other chemicals used in personal care and consumer products in relation to age at pubertal onset, as assessed by clinical Tanner staging in girls and boys. We examined biomarkers from mothers during pregnancy and from their children at age 9 years.
Materials and Methods
Study population
Study participants were mothers and children enrolled in the Center for the Health Assessment of Mothers and Children of Salinas (CHAMACOS), a longitudinal birth cohort examining the effects of in-utero and early life environmental exposures on children’s health and development in a predominantly Latino, US farmworking community. Pregnant women were recruited in 1999–2000 from community clinics serving California’s Salinas Valley. Eligibility criteria included being at least 18 years of age, <20 weeks gestation, English- or Spanish-speaking, and qualifying for low income health insurance (Medicaid). Of 537 children in the study at birth, 339 were followed through pubertal assessments, conducted between 9 and 13 years of age. We excluded one child who was missing biomarker data, for a final sample of 338 children (159 boys and 179 girls).
Informed consent was obtained from mothers and assent was obtained from children. All study activities were approved by the Institutional Review Board (IRB) of the University of California, Berkeley, with the Centers for Disease Control and Prevention (CDC) IRB deferring to UC Berkeley.
Data collection
Mothers were interviewed in English or Spanish at two time points during pregnancy (mean: 14.0 and 26.9 weeks’ gestation) and when their children were 9 years old. Information collected during pregnancy included maternal age, marital status, race/ethnicity, country of birth, years in the USA, educational attainment, household income and the number of people in the household. Pre-pregnancy BMI was calculated using self-reported pre-pregnancy weight and measured height. Household income was also assessed when children were 9 years old.
Clinical Tanner staging (Tanner, 1986) was used to assess timing of puberty. We examined the children every 9 months between 9 and 13 years of age (i.e. at age 9 (n = 312), 9¾ (n = 268), 10½ (n = 300), 11¼ (n = 275), 12 (n = 301) and 12¾ (n = 264)). Trained research assistants used palpation to assess breast development and visual inspection to evaluate pubic hair development in girls. Girls were asked if they had begun menstruating and the month and year of their first menses was recorded at the first post-menarcheal visit. Boys’ stages of genital and pubic hair development were assessed visually and testicular volume was measured in comparison to orchidometer beads. Stage of development for breast (B), genital (G) and pubic hair (PH) development was classified between 1 and 5, with 1 signifying prepubarchal and 5 signifying adult development. Pubertal onset was defined as age when reaching stage B2 (i.e. thelarche) for girls or G2 (i.e. gonadarche) for boys. We also examined age at PH2 (i.e. pubarche) in both girls and boys. A boy was only considered to be in stage G2 if he had both testicular volume >3 cm3 and Tanner genital characteristics consistent with stage 2. Research assistants were trained and supervised by two pediatric endocrinologists (R.L. and L.G.). In on-going training sessions, the research assistants’ categorization of whether a child was in stage 2+ versus stage 1 agreed with that of the pediatric endocrinologists 90 and 92% of the time for girls’ breast and pubic hair stage, respectively, and 92 and 100% of the time for boys’ genital and pubic hair stage.
At each visit, research assistants calculated BMI by weighing and measuring the children without shoes. Children were classified as underweight, normal, overweight or obese at each visit based on CDC percentile guidelines (Whitlock et al., 2005).
Measurement of urinary biomarkers
Spot urine samples were collected from mothers at the time of the two pregnancy interviews (prenatal samples) and from the children at the 9-year-old visit (peripubertal samples). Urine samples were aliquoted, frozen and stored at −80°C until shipment on dry ice to the CDC in Atlanta, GA for analysis. Paraben and phenol concentrations were measured in both prenatal and peripubertal urine samples; phthalate metabolites were only quantified in prenatal samples due to budgetary constraints.
Urinary phthalate metabolites were quantified using online solid phase extraction coupled with isotope dilution high performance liquid chromatography–electrospray ionization-tandem mass spectrometry, as described previously (Silva, 2007). The present analysis focused on metabolites of three low molecular weight phthalates known to be used in personal care products: monoethyl phthalate [MEP, a metabolite of DEP]; mono-n-butyl phthalate [MnBP, a metabolite of DnBP]; and mono-isobutyl phthalate [MiBP, a metabolite of (DiBP)]. Associations of high molecular weight phthalates with puberty in this population have been described elsewhere (Berger et al., 2018). Limits of detection (LODs) were 0.6 ng/mL for MEP, 0.4 ng/mL for MBP and 0.2 ng/mL for MiBP. When concentrations were below the LOD, we used values generated by the instrument when available (2% of values for MiBP, 0.5% for MnBP, 0% for MEP); if no signal was detected, we substituted a random value <LOD based on a log-normal probability distribution whose parameters were determined by maximum likelihood estimation (3.6% of values for MiBP, 0.3% for MnBP, 0.2% for MEP) (Lubin et al., 2004).
Urinary concentrations of three parabens (methyl-, propyl- and butyl paraben) and four phenols (triclosan, benzophenone-3, and 2,4- and 2,5-dichlorophenol) were quantified using online solid phase extraction-high performance liquid chromatography-isotope dilution tandem mass spectrometry (Ye et al., 2005, 2006). The LOD was 1.0 ng/mL for methyl paraben, 0.2 ng/mL for propyl- and butyl paraben, 2.3 ng/mL for triclosan, 0.4 ng/mL for benzophenone-3, and 0.2 ng/mL for 2,4- and 2,5-dichlorophenol. Because the analysis was originally conducted for quantification of bisphenol A only, rather than personal care product chemicals, a number of samples had biomarkers with concentrations above the highest calibration, including prenatal samples for 128 mothers (n = 39 for methyl paraben, n = 41 for propyl paraben, n = 18 for triclosan, n = 66 for benzophenone-3, n = 34 for 2,4-dichlorophenol, n = 111 for 2,5-dichlorophenol) and peripubertal samples for 17 children (n = 3 for methyl paraben, n = 0 for propyl paraben, n = 3 for triclosan, n = 8 for benzophenone-3, n = 1 for 2,4-dichlorophenol, n = 3 for 2,5-dichlorophenol). For concentrations above the highest standard, we substituted with the highest calibrator used (100 ng/mL for 2,4-dichlorophenol; 1000 ng/mL for all other phenols and parabens). Concentrations below the LOD were substituted with the instrument-read value (14.7% of values for triclosan, 1.8% for propyl paraben, 1.4% for 2,4-dichlorophenol, <0.5 for all other phenols) or a random value <LOD (13.6% of values for triclosan, 1.3% for 2,4- and 2,5-dichlorophenol, <0.5 for all other phenols) in the same manner as for phthalate metabolites.
Urinary creatinine concentrations were determined using a commercially available diagnostic enzyme method (Vitros CREA slides; Ortho Clinical Diagnostics, Raritan, NJ). Urinary biomarker concentrations were divided by creatinine concentrations to correct for urinary dilution. Urine specific gravity was also measured for the prenatal, but not peripubertal, samples using a hand-held refractometer (National Instrument Company Inc., Baltimore, MD). Urinary biomarkers were corrected for specific gravity using the equation: analyte concentration * [(1.024 – 1)/(SGsample – 1)], where 1.024 is the reference urinary SG for pregnant women (Mahalingaiah et al., 2008). Although the main analyses used creatinine-corrected biomarker concentrations, we also examined specific-gravity-corrected prenatal concentrations in sensitivity analyses.
Data analysis
We examined prenatal and peripubertal biomarker concentrations as continuous (log 2-transformed) and categorical (quartiles) measures of exposure. For prenatal exposure, we used the average of the creatinine-corrected concentrations in the two pregnancy urine samples. For peripubertal exposure, we used the single creatinine-corrected concentration quantified in children’s urine at 9 years of age.
We conducted parametric accelerated failure time (AFT) models assuming a 2-parameter Weibull distribution to determine the association of urinary biomarker concentrations with timing of pubertal onset using the Stata intcens program, which allowed for interval-censoring (i.e. pubertal onset occurring at an unknown time between two study visits). We converted time ratios into mean shift (in months) at pubertal onset by multiplying by median age at onset. Median ages at thelarche, pubarche and gonadarche for the study population were calculated using an unadjusted AFT model.
Separate models were developed for prenatal and peripubertal concentrations. Prenatal and peripubertal concentrations were included in the same model in sensitivity analyses. Covariates were selected a priori using directed acyclic graphs (see Supplementary Fig. S1) and included maternal education, maternal years in the USA, family income and maternal pre-pregnancy BMI as categorical variables, categorized as shown in Table I. Obesity is a risk factor for early puberty, particularly in girls (Jasik and Lustig, 2008), and may be on the causal pathway between early life exposure and timing of puberty. Thus, child BMI at age 9 was not included as a covariate in main models but was included in sensitivity analyses (categorized as underweight/normal weight versus overweight/obese). We further examined child overweight/obesity as a possible mediator using the Paramed package in Stata (VanderWeele and Vansteelandt, 2009; Emsley and Liu, 2013) with binary chemical exposure variables and binary overweight/obese status as the mediator in the association with age at puberty.
Characteristics of study population, CHAMACOS cohort, Salinas, CA (N = 338 children).
| Characteristics | N | % |
|---|---|---|
| Child’s sex | ||
| Female | 179 | 53.0 |
| Male | 159 | 47.0 |
| Mother’s race/Ethnicity | ||
| Latina | 333 | 98.5 |
| Non-Hispanic White | 2 | 0.6 |
| Other | 3 | 0.9 |
| Mother’s educational attainment | ||
| ≤Sixth grade | 150 | 44.4 |
| 7–12th grade | 117 | 34.6 |
| High school graduate | 71 | 21.0 |
| Mother’s duration of residence in the US at time of pregnancy (years) | ||
| ≤1 | 72 | 21.3 |
| 2–5 | 89 | 26.3 |
| 6–10 | 86 | 25.4 |
| 11+ | 56 | 16.6 |
| Entire life | 35 | 10.4 |
| Mother’s age at delivery (years) | ||
| 18–24 | 137 | 40.5 |
| 25–29 | 113 | 33.4 |
| 30–34 | 55 | 16.3 |
| 35–45 | 33 | 9.8 |
| Mother’s age at menarche | ||
| <12 years old | 67 | 19.8 |
| 12–13 years old | 165 | 48.8 |
| >13 years old | 106 | 31.4 |
| Maternal pre-pregnancy BMI | ||
| Underweight | 2 | 0.6 |
| Normal weight | 115 | 34.0 |
| Overweight | 131 | 38.8 |
| Obese | 90 | 26.6 |
| Family Income at age 9 | ||
| ≤100% federal poverty level | 231 | 68.8 |
| >100% federal poverty level | 105 | 31.3 |
| Child’s overweight status at age 9 | ||
| Underweight | 1 | 0.3 |
| Normal weight | 147 | 44.3 |
| Overweight | 57 | 17.2 |
| Obese | 127 | 38.3 |
Results
The study population was almost exclusively Latino, with 73% of mothers having lived in the USA for fewer than 11 years at the time of their pregnancies (Table I). Most mothers (79%) had not completed high school, and 69% of children at age 9 were living below the federal poverty threshold. At age 9, 55% of children were overweight or obese and 65% of mothers had been overweight or obese prior to the pregnancy.
Timing of pubertal onset in this cohort was similar to Latino children participating in NHANES (Sun et al., 2002). In girls, the median age at thelarche (B2) was 9.2 years, at pubarche (PH2), 10.3 years and at menarche, 11.7 years. In boys, the median age at gonadarche (G2) was 10.8 years and at pubarche (PH2), 12.2 years. At age 9, the start of pubertal observation period, 39% and 20% of girls had already reached B2 and PH2, respectively, and 11% and 1% of boys had reached G2 and PH2.
All biomarkers were detected in >90% of samples except triclosan, which was detected in 73% of prenatal and 69% of peripubertal samples (Table II), and butyl paraben, which was detected in <40% of samples and therefore was not included in the analyses. Creatinine-corrected biomarker concentrations are shown in Table II. Most levels were similar to those of Mexican-American women in NHANES, although our cohort had slightly higher concentrations of MEP, methyl paraben and 2,4-dichlorophenol (CDC, 2018). The intraclass correlation between the two pregnancy samples was lowest for the phthalates (MEP = 0.39, MBP = 0.19, MiBP = 0.26) but showed moderate correlation for the parabens (methyl paraben = 0.46, propyl paraben = 0.41) and phenols (triclosan = 0.46, benzophenone-3 = 0.56, 2,4-dichlorophenol = 0.46, 2,5-dichlorophenol = 0.55).
Distribution of phthalate, paraben and phenol biomarker concentrations (ng/g creatinine) in prenatal and peripubertal urine samples.
| LOD (ng/L) | Detection Frequency | Geometric mean | Percentiles | ||||
|---|---|---|---|---|---|---|---|
| Biomarker | 25th% | 50th% | 75th% | 90th% | |||
| Prenatala | |||||||
| MEP | 0.6 | 99.8% | 203.3 | 85.7 | 208.6 | 435.0 | 866.1 |
| MBP | 0.4 | 99.2% | 24.1 | 13.4 | 22.4 | 42.6 | 71.0 |
| MiBP | 0.2 | 94.4% | 3.0 | 1.7 | 2.8 | 5.4 | 8.7 |
| Triclosan | 2.3 | 73.2% | 19.9 | <LOD | 16.7 | 112.1 | 313.4 |
| Benzophenone-3 | 0.4 | 99.5% | 23.5 | 4.5 | 15.4 | 136.9 | 590.9 |
| Methyl paraben | 1 | 99.9% | 136.4 | 63.9 | 149.3 | 345.1 | 544.2 |
| Propyl paraben | 0.2 | 96.8% | 34.5 | 9.6 | 40.8 | 151.9 | 403.8 |
| 2,4-dichlorophenol | 0.2 | 100.0% | 5.1 | 2.0 | 3.5 | 12.8 | 38.0 |
| 2,5-dichlorophenol | 0.2 | 100.0% | 64.6 | 14.3 | 50.6 | 378.6 | 763.7 |
| Peripubertalb | |||||||
| MEP | NAc | – | – | – | – | – | |
| MBP | NAc | – | – | – | – | – | |
| MiBP | NAc | – | – | – | – | – | |
| Triclosan | 2.3 | 68.7% | 8.0 | <LOD | 6.0 | 22.4 | 184.1 |
| Benzophenone-3 | 0.4 | 99.7% | 17.2 | 5.8 | 13.6 | 36.5 | 148.0 |
| Methyl paraben | 1 | 99.7% | 44.9 | 17.1 | 38.6 | 115.0 | 324.2 |
| Propyl paraben | 0.2 | 97.1% | 4.9 | 1.1 | 2.8 | 21.3 | 107.4 |
| 2,4-dichlorophenol | 0.2 | 94.8% | 1.0 | 0.5 | 0.9 | 1.9 | 3.6 |
| 2,5-dichlorophenol | 0.2 | 95.5% | 2.2 | 0.8 | 1.6 | 4.0 | 17.2 |
aAverage of concentrations in two maternal urine samples collected in pregnancy.
bOne child urine sample collected at 9 years of age.
cMEP, MBP and MiBP were not measured in child urine samples.
LOD = limit of detection.
Table III shows the associations of prenatal and peripubertal biomarker concentrations with timing of pubertal milestones in girls. With prenatal urinary biomarkers, we observed an association of earlier pubertal milestones with higher concentrations of MEP, triclosan and 2,4-dichlorophenol. Specifically, each doubling of prenatal MEP concentration was associated with a shift in timing of pubarche by −1.3 months (95% CI: −2.5, −0.1) and each doubling of concentrations of prenatal triclosan and 2,4-dichlorophenol (a degradation product of triclosan) was associated with a shift in menarche of −0.7 months (95% CI: −1.2, −0.2) and −0.8 months (95% CI: −1.6, −0.0), respectively.
Adjusteda mean shift (95% confidence intervals) in age at pubertal milestones in girls associated with a 2-fold increase in prenatal and childhood urinary biomarker concentrations.
| Biomarker | Thelarche (B2+) | Pubarche (PH2+) | Menarche |
|---|---|---|---|
| Mean shift (months) | Mean shift (months) | Mean shift (months) | |
| Prenatal concentrationsb (N = 172–177) | |||
| MEP | −1.1 (−2.2, 0.1) | −1.3 (−2.5, −0.1)* | −0.3 (−1.3, 0.6) |
| MBP | −0.5 (−2.4, 1.4) | 0.5 (−1.3, 2.4) | −0.7 (−2.1, 0.7) |
| MiBP | −0.2 (−1.8, 1.5) | −0.3 (−2.0, 1.4) | −0.4 (−1.6, 0.9) |
| Triclosan | −0.1 (−0.8, 0.6) | 0.0 (−0.7, 0.8) | −0.7 (−1.2, −0.2)** |
| Benzophenone-3 | −0.1 (−0.7, 0.6) | 0.3 (−0.4, 1.0) | −0.3 (−0.8, 0.2) |
| Methyl paraben | 0.1 (−1.0, 1.2) | 0.4 (−0.8, 1.6) | −0.7 (−1.6, 0.2) |
| Propyl paraben | 0.1 (−0.6, 0.8) | 0.4 (−0.4, 1.2) | −0.2 (−0.8, 0.4) |
| 2,4-dichlorophenol | −0.9 (−1.9, 0.2) | −0.2 (−1.3, 0.9) | −0.8 (−1.6, 0.0)* |
| 2,5-dichlorophenol | −0.5 (−1.2, 0.3) | −0.1 (−0.9, 0.7) | −0.5 (−1.0, 0.1) |
| Peripubertal concentrationsc (N = 155–157) | |||
| Triclosan | 0.0 (−0.8, 0.8) | 0.7 (−0.1, 1.5) | 0.1 (−0.5, 0.8) |
| Benzophenone-3 | −0.3 (−1.3, 0.7) | −0.5 (−1.4, 0.4) | −0.6 (−1.4, 0.2) |
| Methyl paraben | −1.1 (−2.1, 0.0)* | −1.5 (−2.5, −0.4)** | −0.9 (−1.6, −0.1)* |
| Propyl paraben | −0.5 (−1.2, 0.3) | −0.8 (−1.6, −0.1)* | −0.4 (−1.0, 0.1) |
| 2,4-dichlorophenol | 0.4 (−1.3, 2.0) | 0.6 (−1.0, 2.2) | −0.4 (−1.6, 0.7) |
| 2,5-dichlorophenol | 0.2 (−0.7, 1.1) | 1.0 (0.1, 1.9)* | 0.5 (−0.3, 1.3) |
aAdjusted for maternal education, years in US, maternal pre-pregnancy BMI and family poverty (during pregnancy or at 9 Y, respectively).
bAverage of creatinine-corrected concentrations in two urine samples collected during pregnancy.
cCreatinine-corrected concentrations in one urine sample collected at 9 years of age.
*P < 0.05; **P < 0.01.
With peripubertal exposure in girls, we observed associations of earlier thelarche (mean shift = −1.1 months, 95% CI: −2.1, −0.0), pubarche (mean shift = −1.5 months, 95% CI: −2.5, −0.4), and menarche (mean shift = −0.9, 95% CI: −1.6, −0.1) with each doubling of urinary concentrations of methyl paraben and earlier pubarche (mean shift = −0.8, 95% CI: −1.6, −0.1) with each doubling of propyl paraben concentrations at age 9. We also observed later onset of pubarche with peripubertal concentrations of 2,5-dichlorophenol (mean shift = 1.0 month, 95% CI: 0.1, 1.9).
The associations of urinary biomarkers with pubertal timing in boys are presented in Table IV. No prenatal biomarkers were associated with pubertal timing in boys. With peripubertal concentrations, we observed an association of earlier gonadarche with each doubling of propyl paraben (mean shift = −1.0 months, 95% CI: −1.8, −0.1).
Adjusteda mean shift (95% confidence intervals) in age at pubertal milestones in boys associated with a 2-fold increase in prenatal and childhood urinary biomarker concentrations.
| Gonadarche (G2+) | Pubarche (PH2+) | |
|---|---|---|
| Biomarker | Mean shift (months) | Mean shift (months) |
| Prenatal concentrationsb (N = 155–158) | ||
| MEP | −1.1 (−2.7, 0.6) | −0.5 (−1.8, 0.7) |
| MBP | 1.2 (−0.9, 3.4) | −0.4 (−2.2, 1.3) |
| MiBP | −1.4 (−3.1, 0.4) | −0.4 (−1.9, 1.2) |
| Triclosan | −0.6 (−1.5, 0.3) | −0.4 (−1.1, 0.3) |
| Benzophenone-3 | 0.5 (−0.4, 1.5) | 0.3 (−0.5, 1.1) |
| Methyl paraben | 0.0 (−1.7, 1.7) | −0.4 (−1.7, 1.0) |
| Propyl paraben | −0.3 (−1.3, 0.6) | 0.0 (−0.8, 0.7) |
| 2,4-dichlorophenol | −1.0 (−2.5, 0.5) | −0.9 (−2.1, 0.3) |
| 2,5-dichlorophenol | −0.4 (−1.4, 0.7) | −0.1 (−0.9, 0.7) |
| Peripubertal concentrationsc (N = 139–140) | ||
| Triclosan | −0.6 (−1.5, 0.3) | 0.1 (−0.6, 0.9) |
| Benzophenone-3 | −0.7 (−1.8, 0.4) | −0.3 (−1.2, 0.7) |
| Methyl paraben | −0.2 (−1.6, 1.2) | 0.8 (−0.5, 2.1) |
| Propyl paraben | −1.0 (−1.8, −0.1)* | −0.2 (−1.0, 0.6) |
| 2,4-dichlorophenol | −1.0 (−2.6, 0.7) | 0.3 (−1.2, 1.8) |
| 2,5-dichlorophenol | 0.7 (−0.6, 2.0) | 0.4 (−0.7, 1.5) |
aAdjusted for maternal education, years in US, maternal pre-pregnancy BMI, and family poverty (during pregnancy or at 9 Y, respectively).
bAverage of creatinine-corrected concentrations in two urine samples collected during pregnancy.
cCreatinine-corrected concentrations in one urine sample collected at 9 years of age.
*P < 0.05; **P < 0.01.
When we examined urinary biomarker concentrations as categorical variables by quartiles (Supplementary Table S1), results were similar to the continuous results shown in Table III. Figure 1 shows that the associations in girls between prenatal MEP and triclosan with earlier pubarche and menarche, respectively, were also present when MEP and triclosan concentrations were treated as categorical variables. Associations with peripubertal methyl paraben, propyl paraben and 2,5-dichlorophenol in girls also persisted in categorical analyses (Fig. 1), although these findings had reduced power.
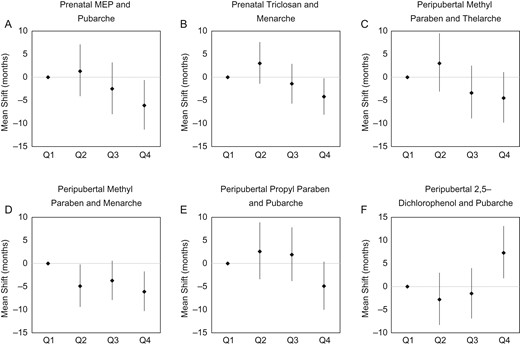
Association of quartiles of exposure with timing of puberty in girls.
In sensitivity analyses, the results were very similar when urinary dilution was corrected using specific gravity rather than creatinine (not shown), and when prenatal and peripubertal biomarker concentrations were included in the same model (not shown). Mediation analysis found no evidence of natural indirect effects for any of the exposures and outcomes (Supplementary Tables S2 and S3), suggesting that childhood obesity did not mediate the observed associations.
Discussion
We found evidence that prenatal and peripubertal exposure to certain phthalates, parabens and phenols present in personal care and consumer products was associated with pubertal timing in girls, but less so in boys. Specifically, prenatal urinary concentrations of triclosan and 2,4-dichlorophenol were associated with earlier menarche and prenatal concentrations of MEP were associated with earlier pubarche in girls. Peripubertal concentrations of methyl paraben were associated with earlier thelarche, pubarche and menarche in girls, while propyl paraben was associated with earlier pubarche in girls and gonadarche in boys. We also observed an association of peripubertal 2,5-dichlorophenol with later pubarche in girls.
Only one other study has examined the association of prenatal exposure to low molecular weight phthalates with timing of puberty in children. The ELEMENT Study, a longitudinal birth cohort in Mexico City, found prenatal concentrations of MEP to be associated with earlier menarche in girls (Watkins et al., 2014, 2017a,b). While we found prenatal MEP concentrations to be associated with earlier pubarche, these findings are not necessarily consistent, since menarche is regulated by the hypothalamic–pituitary–gonadal axis while pubarche is governed by adrenal mechanisms. Like us, the ELEMENT Study found no associations with prenatal MBP and MiBP concentrations in girls, and no associations of any of the low molecular weight phthalates with pubertal timing in boys (Watkins et al., 2017a,b). To our knowledge, no other studies have examined prenatal exposure to parabens and phenols in relation to pubertal timing.
More studies have examined peripubertal exposure, particularly in girls. The Chilean Growth and Obesity Cohort Study (COGS) found peripubertal MEP concentrations to be associated with earlier menarche in overweight/obese girls (Binder et al., 2018). Peripubertal triclosan concentrations were associated with earlier menarche in the COGS Study (Binder et al., 2018) and with earlier breast development in US girls in the BCERP Study (Wolff et al., 2015). However, other studies of peripubertal exposure have found no association of MEP with any markers of puberty (Frederiksen et al., 2012; Mouritsen et al., 2013; Wolff et al., 2014, 2017) but have found associations between MnBP with later pubarche (Frederiksen et al., 2012; Wolff et al., 2014). The only other studies to examine childhood paraben concentrations in relation to female puberty (Buttke et al., 2012; Wolff et al., 2015, 2017) have not found associations with earlier puberty. Our association between 2,5-dichlorophenol concentrations and later menarche contrasts with two studies that have examined this association; in the BCERP study, urinary concentrations of 2,5-dichlorophenol in girls at ages 6–8 were associated with earlier menarche, pubarche, and thelarche (Wolff et al., 2015, 2017) and in NHANES, 2,5-dichlorophenol concentrations at ages 12–16 were associated with earlier menarche (Buttke et al., 2012). The BCERP Study also observed an association of urinary benzophenone-3 concentrations with later thelarche (Wolff et al., 2015), which was not seen in the present study. Thus, although there are suggestions of some common patterns, overall, the results of our study and the previous studies are not generally consistent.
There are several differences between our study and previous research, most notably in the timing of exposure assessment. Only one other study examined prenatal exposure and the studies examining peripubertal exposure did so at 6–16 years of age. Many studies measured Tanner staging only at one time point, examining biomarker concentrations at the same time. However, our urinary analysis methods and urinary biomarkers were generally consistent with previous studies, and concentrations of phthalate, paraben and phenol biomarkers across studies were broadly within the range of levels in NHANES.
In animal models, exposures during both the prenatal (Bateman and Patisaul, 2008) and peripubertal (Rasier et al., 2006) periods have been associated with altered timing of puberty, sometimes with different effects with different timings of exposure. None of the findings observed with prenatal concentrations in our study were also observed with peripubertal exposure. This complicates our comparison with other studies, most of which have examined only peripubertal exposure. Some of our prenatal findings (e.g. earlier puberty with MEP and triclosan) were somewhat supported by peripubertal findings in other studies, but not by peripubertal findings in our own study. We observed associations with prenatal concentrations of MEP, triclosan and 2,4-dichlorophenol, which may reflect that the in-utero period is the critical window of exposure to disrupt pubertal timing in girls. However, our findings with peripubertal exposure to methyl and propyl parabens could reflect reverse causality if, for example, girls and boys who entered puberty early were more likely to use personal care products containing these preservatives compared to children entering puberty later.
There are some limitations to this study. We lacked exact values for the highest concentrations of several phenols and instead imputed them at the highest standard. However, our findings using this method were similar to results when examining concentrations by quartile, suggesting that it was not a major issue. Additionally, urinary phthalates, parabens and phenol biomarkers typically only reflect exposure in the past 24–48 h, and one or two urinary measurements may not be sufficient to characterize usual exposure over the prenatal and peripubertal periods. Although personal care product-use habits tend to be fairly consistent, as shown by the moderate correlations between the paraben and phenol concentrations during pregnancy, multiple spot urine samples per time window would have been preferable. Finally, there is potential for confounding by other environmental exposures, such as pesticides, given that this population lives in an agricultural community. Future studies should examine multiple concurrent exposures as it is possible that some of these chemicals may act through related mechanisms.
This study is methodologically strong, with a longitudinal design, measurements of exposure biomarkers during two critical windows of development, and clinical Tanner staging conducted every 9 months. However, the study population was limited to Latino children of low socioeconomic status living in a farmworker community and may not be widely generalizable. This study contributes to a growing literature that suggests that exposure to certain endocrine disrupting chemicals may impact timing of puberty in children.
Authors’ roles
K.G.H., K.K. and B.E. designed the study. K.G.H., K.K., K.P., R.H.L. and L.C.G. executed the study. M.C. and X.Y. analyzed the urine samples for biomarkers. K.P.B. analyzed the data. K.G.H. and K.P.B. wrote the article. All authors were involved in critical discussion.
Funding
The results reported herein correspond to the specific aims of Grant (R21 ES024909) to K.G.H. from the National Institute of Environmental Health Sciences (NIEHS). Grants (P01 ES009605, R01 ES017054, RC2 ES018792, R01 ES021369 and R24 ES028529) from NIEHS and Grants (R82670901, RD83171001 and RD83451301) from the US Environmental Protection Agency (USEPA).
Conflict of interest
The authors have no conflicts of interest to declare.
Disclaimer
The findings and conclusions in this report are those of the authors and do not necessarily represent the official position of the Centers for Disease Control and Prevention. Use of trade names is for identification only and does not imply endorsement by the CDC, the Public Health Service or the US Department of Health and Human Services.
