


Abstract
There is a need to increase our knowledge regarding the influence of combined oral contraceptive (COC) use on individual weight change in the long term. The first aim of this study was to assess the long-term influence of COC's on body weight, and the second aim was to describe body weight increase during the fertile period.
Postal questionnaires regarding weight/height, contraception, reproductive health, smoking and exercise were sent to random samples of 19-year-old women born in 1962 (n= 656) and 1972 (n = 780) resident in the city of Gothenburg, Sweden in 1981 and 1991. The responders were followed longitudinally, and the same women were contacted again every fifth year from 1986–2006 and from 1996–2006, respectively.
There was no significant difference in weight increase in the women grouped according to use or non-use of COC or duration of COC use. The two cohorts of women were grouped together in a longitudinal analysis and the following factors age, COC use, children, smoking and exercise were included in the model. The only predictor for weight increase was age (P < 0.001), resulting in a gain of 0.45 kg/year. There was no correlation between weight change and COC use or duration of COC use, number of children or exercise. Smokers decreased (P < 0.001) their weight by 1.64 kg per 15 years. Between 19 and 44 years of age, the 62-cohort had successively increased (P < 0.0001) their body weight/BMI by 10.6 kg/3.7. Women from the 72-cohort had a higher (P < 0.05) weight/BMI compared with women of the same age from the 62-cohort.
COC use was not found to be a predictor for weight increase in the long term. Body weight/BMI increased by 10.6 kg/3.7 between 19 and 44 years of age in a random sample of Swedish women born in 1962. Women from the 72-cohort had a greater body weight/BMI compared with the 62-cohort.
Introduction
Weight gain or a fear of weight increase are important factors that may affect contraceptive acceptability among women of fertile age (Oddens, 1999; Lindh et al., 2009). Young women are often occupied with body image and potential weight gain may limit use of combined oral contraceptives (COCs). In a British survey, 73% of women of all ages believed that weight gain is a disadvantage of the pill (Oddens et al., 1994) and according to another survey (Wysocki, 2000), >50% of US women believed that COCs cause weight gain and 20% claimed that weight gain was a reason for discontinuation or failure to initiate use. Weight gain was also the most frequent reason for COC discontinuation in a national study of adult women in the USA (Rosenberg and Waugh, 1998). Fear of weight gain during COC may increase poor compliance, early discontinuation among users or prevent women from starting with the pill when contraception is needed (Rosenberg et al., 1995). This may subsequently increase the risks of unintended pregnancies that are already high in many European countries as well as in the USA (Government Statistical Service, 2004; Jones et al., 2008; Abortion Statistics Sweden, 2009).
Some clinicians also believe that an association exists between the use of COCs and weight gain. In a Canadian study, information regarding the possibility of weight increase during pill use was given by 68% of doctors and 52% of the women themselves thought their weight would increase on the pill (Gaudet, 2004). After consultation and counselling, 14% more women believed the pill would increase their body weight.
However, a relationship between the use of COCs and weight gain has not been established. In most trials of COCs, weight change is not a primary outcome and studies have been of short duration. Analysis of the literature reports either minimal weight increase or little evidence for a causal relationship (Gupta, 2000; Milsom et al., 2006; Berenson and Rahman, 2009; Beksinska et al., 2010). In a Cochrane review (Gallo et al., 2008), three placebo-controlled trials and trials comparing different combination contraceptives and weight gain were evaluated. The evidence was insufficient to conclude an effect of combined contraceptives on weight, but no major effect on weight was evident. The same Cochrane review pointed out that few placebo-controlled studies have been conducted and most COC studies have been of short duration, 6 months or shorter, and a longer observation period may be required to demonstrate evidence of weight gain.
There is also a scarcity of information regarding the normal pattern of weight increase in women of fertile age. Thus, there is a need for more prospective longitudinal studies to assess the normal pattern of weight increase during the fertile period and assess possible factors influencing weight change. In such a study, it would also be possible to assess the long-term influence of oral contraception on body weight changes.
In 1981, a prospective longitudinal study was initiated regarding contraceptive use, pregnancies and reproductive health in a random sample of 19-year-old women (Andersch and Milsom, 1982). The same women have now been reassessed at 5 yearly intervals up to the age of 44 years. In 1991, a new cohort of women (born in 1972) residing in Gothenburg was invited to participate in a similar study and has also been followed at 5 yearly intervals up to the age of 34 years (Larsson et al., 1996). The primary aim of this study was to assess the long-term influence of COCs on body weight using data accumulated from these two cohorts of women. A secondary objective was to describe body weight increase during the fertile period.
Materials and Methods
Study population
In 1981, a prospective longitudinal population study of women resident in the city of Gothenburg, Sweden was initiated (Andersch and Milsom, 1982). The women included were born in 1962 and were 19 years of age, and this age was chosen to be able to deal with women of legal age, enabling information to be collected via the individuals themselves without the necessity of consent from their parents. There were 2621 women aged 19 years living in the city of Gothenburg in 1981, and a random sample of every fourth woman was obtained (n = 656) from the population register. The women from the birth cohort of 1962 are referred to in the text as the ‘62-cohort’. A new group of 19-year-old women (born in 1972) resident in Gothenburg was invited to participate in 1991 (Larsson et al., 1996). A one in three sample of the 2342 women aged 19 years, resident in the city of Gothenburg at the time of the study, was obtained at random from the population register (n = 780). The 19-year-old women from the birth cohort of 1972 are referred to as ‘72-cohort’. The study was approved by the Ethics Committee, Faculty of Medicine, University of Gothenburg, and the National Data Inspection Board approved the study design.
The women were contacted by letter and requested to complete and return an enclosed questionnaire. If no reply was received, reminders were sent out after 2 and 4 weeks. Women who returned the questionnaire in 1981 at the age of 19 years of age were contacted again every fifth year (1986, 1991, 1996, 2001 and 2006) and the women from the birth cohort of 1972 who returned the questionnaire in 1991 were subjected to the same procedure and were contacted again every fifth year (1996, 2001 and 2006).
The questionnaire
The same questionnaire has been used throughout this longitudinal study that was started in 1981 and consisted of ∼40 questions about contraception, menstrual pattern, the occurrence and severity of dysmenorrhoea, reproductive history and factors such as height, weight and smoking. The questionnaire has undergone only minor changes during the course of this longitudinal study as we considered it of importance that the same questions were asked at each assessment point. The only changes made have been related to the addition of new questions about contraceptive methods previously not available, e.g. implants and the levonorgestrel-releasing intrauterine system (LNG-IUS) etc. No visual prompts were used, and the women were simply asked which contraceptive method they were using at the time of the assessment. If they were, for instance, currently using a COC, they were asked to write the name of the COC. Exercise was assessed by the following question: Do you exercise? (One of the following alternatives was chosen: several times a week/once a week/once per month/never). Smoking was assessed by the following questions: Do you smoke Yes/No, if they answered Yes, they were asked how many cigarettes they smoked per day. Face-validity and reliability of the questionnaire were evaluated in a sub-sample of 30 women. Face-validity was assessed at an interview with the woman where the answers given in the questionnaire were checked verbally and by measurement e.g. weight measurement, height measurement, the name of the COC used etc. The agreement ranged between 92 and 100%, which we considered to be satisfactory. Reliability was tested by answering the questionnaire twice within a 3-week interval, and the agreement of the answers to 5-specific questions was tested (agreement ranged between 90 and 100%). Ten questions in the inquiry were selected, and the women were interviewed to see if they understood the meaning of the questions. The level of understanding ranged from 89 to 100%, which we also considered satisfactory.
BMI
BMI was categorized according to the WHO guidelines (World Health Organization, 1998) as underweight (<18.5), normal range (18.5–24.9) and overweight (≥25). Pre-obese (25.0–29.9), obese class 1 (30.0–34.9), obese class 2 (35–39.9) and obese class 3 (≥40).
Characteristics of the samples and analysis of the non-responders
The questionnaire was completed and returned in 1981 by 594 of the 656 19-year-old women born in 1962 (response rate 91%) and in 1991 by 641 of the 780 19-year-old women born in 1972 (response rate 82%). The population register contains information regarding civil status, nationality, home address linked to the individual's personal identification number. The socio-economic status (SES) of the district, where the woman was resident at 19 years of age, was classified according to a 3-point socio-economic index (low, medium and high SES) based on the mean level of education, income and profession/social group for all the inhabitants resident in each district (Statistics Sweden, 2001). The responders in 1981 (62-cohort) were considered representative, as there were no significant differences between responders and non-responders regarding marital status (single 94/92%), nationality (Swedish citizen 96/91%) or the SES of the area where the women were resident (Low 41/26%; Middle 38/41%; High 22/32%). The corresponding figures for the 72-cohort in 1991 were as follows: marital status (Single 95/92%), nationality (Swedish citizen 92/88%) or the SES of the area where the women were resident (Low 41/38%; Middle 34/41%; High 25/21%).
The questionnaire was completed and returned on all six occasions (1981, 1986, 1991, 1996, 2001 and 2006) by 286 of the women born in 1962 which constitutes 44% of the original sample of 656 women, and on all four occasions (1991, 1996, 2001 and 2006) by 375 (48%) from the original sample of 780 women born in 1972. We also performed a comparison of women who responded on all occasions and who were included in this longitudinal study and the women who had not participated on each and every occasion. There were no significant differences regarding smoking (responders 38%/non-responders 46% ), pregnancies (18/12%), live births (5/6%), contraceptive use (74/68%), body weight (58 kg/58 kg) and SES (Low 41/40%; Middle 35/40%; High 23/20%) between the responders from the 62-cohort who replied on all six occasions (n = 286) and the non-responders who had answered the questionnaire at some time during the period 1981–2006 (n = 308). There were, however, some significant differences in the corresponding figures for the 72-cohort smoking (responders 34%/non-responders 39%, NS), pregnancies (14/25%, P < 0.05), live births (2/6%, NS), contraceptive use (70/67%, NS), body weight (59/60%, NS) and SES (Low 37/45%, P < 0.05; Middle 33/35%, NS; High 29/20%, P < 0.01).
Data analysis and statistical methods
Data description of groups includes n, mean, standard deviation and 95% confidence limits. Group differences were tested with an ordinary two sample t-test, which throughout was confirmed with the Wilcoxon rank-sum test. Individual changes within groups between follow-up occasions were tested with a matched paired t-test and also confirmed with a corresponding Wilcoxon signed-rank test. Weight was analysed using a longitudinal linear model with repeats of values on four occasions, at 19, 24, 29 and 34 years of age together with the factors of age, COC use, children, smokers and exercise. Analyses were done using SAS 9.1 software (SAS Institute Inc., Cary, NC, USA).
Results
A flow chart describing inclusion and continued participation is shown in Fig. 1, and a comparison of basic characteristics in the two cohorts of women is shown in Tables I and II. The proportion of smokers in the 62-cohort decreased from 39% at the age of 19 to 21% at the age of 44 (P < 0.0001). Smoking was most commonly reported (41%) at the age of 24 years old in the 62-cohort. In the 72-cohort, smoking was reported by 33% at 19 years of age decreasing to 15% at the age of 34 years (P < 0.0001). Exercise increased in the 62-cohort from 69 to 88% during this 25-year period and from 84 to 87% in the 72-cohort.
Comparison of cohort characteristics (height, weight and BMI) at each assessment point.
| 19 years | 24 years | 29 years | 34 years | 39 years | 44 years | |||
|---|---|---|---|---|---|---|---|---|
| 62-cohort (n = 286) | ||||||||
| Height, cm (mean) | 167.2 | 167.5 | 167.5 | 167.5 | 167.6 | 167.5 | ||
| 95 % CI | 166.5–167.8 | 166.9–168.1 | 166.8–168.1 | 166.9–168.2 | 166.9–168.2 | 166.8–168.2 | ||
| Weight, kg (mean) | 58.5 | 60.0 | 62.5 | 65.1 | 68.2 | 69.1 | ||
| 95% CI | 57.6–59.3 | 58.9–61.0 | 61.4–63.6 | 63.7–66.5 | 66.7–69.7 | 67.5–70.6 | ||
| BMI, mean | 20.9 | 21.3 | 22.3 | 23.2 | 24.3 | 24.6 | ||
| 95% CI | 20.6–21.2 | 21.0–21.6 | 21.9–22.6 | 22.7–23.6 | 23.8–24.8 | 24.1–25.1 | ||
| BMI distribution, n (%) | ||||||||
| <18.5 | 33 (12) | 23 (8) | 15 (5) | 9 (3) | 5 (2) | 3 (1) | ||
| 18.5–24.9 | 240 (84) | 241 (86) | 226 (80) | 215 (76) | 184 (65) | 179 (63) | ||
| 25.0–29.9 | 11 (4) | 15 (5) | 34 (12) | 44 (16) | 74 (26) | 73 (26) | ||
| 30.0–34.9 | 2 | 1 | 4 (1) | 11 (4) | 14 (5) | 17 (6) | ||
| 35.0–39 | 0 | 0 | 2 (1) | 2 (1) | 5 (2) | 7 (2) | ||
| ≥40.0 | 0 | 1 | 0 | 2 (1) | 3 (1) | 3 (1) | ||
| Within subject difference in BMI, mean (95% CI) | 0.4 (0.2–0.6) | 0.8 (0.6–1.1) | 1.0 (0.7–1.2) | 1.0 (0.8–1.3) | 0.3 (0.1–0.6) | |||
| 72-cohort (n = 375) | ||||||||
| Height, cm (mean) | 167.1 | 167.2 | 167.3 | 167.3 | ||||
| 95 % CI | 166.5–167.7 | 166.6–167.8 | 166.7–167.9 | 166.7–167.9 | ||||
| Weight, kg (mean) | 59.4 | 62.6 | 65.9 | 67.1 | ||||
| 95% CI | 58.6–60.3 | 61.5–63.6 | 64.7–67.0 | 65.8–68.3 | ||||
| BMI, mean | 21.2 | 22.4 | 23.5 | 24.0 | ||||
| 95% CI | 21.0–21.5 | 22.0–22.7 | 23.1–23.9 | 23.5–24.4 | ||||
| BMI distribution, n (%) | ||||||||
| < 18.5 | 30 (8) | 17 (5) | 10 (3) | 7 (2) | ||||
| 18.5–24.9 | 305 (85) | 298 (81) | 252 (69) | 240 (65) | ||||
| 25.0–29.9 | 24 (7) | 43 (12) | 83 (23) | 87 (24) | ||||
| 30.0–34.9 | 0 | 5 (1) | 17 (5) | 28 (8) | ||||
| 35.0–39.9 | 1 | 6 (2) | 4 (1) | 2 (1) | ||||
| 40.0 | 0 | 0 | 1 | 3 (1) | ||||
| Within subject difference in BMI, mean (95% CI) | 1.1 (0.9–1.4) | 1.2 (0.9–1.4) | 0.4 (0.2–0.7) | |||||
Comparison of cohort characteristics (menarcheal age, pregnancies, children and smoking) at each assessment point.
| 19 years | 24 years | 29 years | 34 years | 39 years | 44 years | |
|---|---|---|---|---|---|---|
| 62-cohort (n = 286) | ||||||
| Menarcheal age (year) [mean (95% CI)], 13.0 (12.9–13.2) | ||||||
| Pregnancies (mean) | 0.2 | 0.8 | 1.8 | 2.6 | 3.0 | 3.1 |
| (95% CI) | 0.1–0.3 | 0.6–0.9 | 1.6–1.9 | 2.4–2.8 | 2.7–3.1 | 2.9–3.2 |
| Children (mean) | 0.1 | 0.4 | 1.1 | 1.8 | 2.1 | 2.1 |
| (95% CI) | 0.0–0.1 | 0.3–0.4 | 1.0–1.2 | 1.7–2.0 | 2.0–2.2 | 2.0–2.3 |
| Smoker [n (%)] | 110 (39) | 115 (41) | 93 (33) | 83 (29) | 75 (26) | 59 (21) |
| Within subject difference in smoking, mean (95% CI) | 0.02 (−0.03 to 0.07) | −0.09 (−0.14 to –0.03) | −0.03 (−0.07 to 0.02) | −0.03 (−0.07 to 0.01) | −0.05 (−0.08 to –0.02) | |
| 72-cohort (n = 375) | ||||||
| Menarcheal age (year) [mean (95% CI)], 12.9 (12.7–13.0) | ||||||
| Pregnancies (mean) | 0.2 | 0.6 | 1.3 | 2.0 | ||
| (95% CI) | 0.1–0.3 | 0.5–0.7 | 1.2–1.4 | 1.8–2.1 | ||
| Children (mean) | 0.02 | 0.2 | 0.8 | 1.4 | ||
| (95% CI) | 0–0.03 | 0.2–0.3 | 0.7–0.9 | 1.3–1.5 | ||
| Smoker [n (%)] | 124 (33) | 108 (29) | 74 (20) | 56 (15) | ||
| Within subject difference in smoking, mean (95% CI) | −0.04 (−0.08 to 0.01) | −0.09 (−0.13 to –0.04) | −0.05 (−0.09 to –0.01) | |||
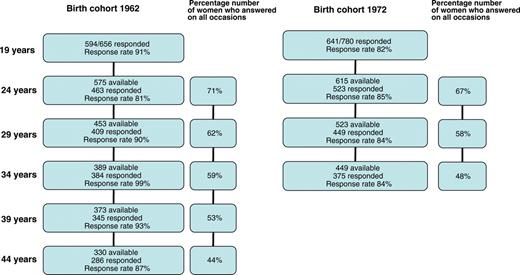
Flow chart illustrating the inclusion of the women and their continued participation in this longitudinal study.
Weight development among the two cohorts
Weight development among the two cohorts of women is described in Table I. At 19 years of age, the mean weight of the women in the 62-cohort was 58.5 kg [95% confidence interval (CI): 57.6–59.3] and had increased to 69.1 kg (95% CI: 67.5–70.6) at 44 years of age (P < 0.0001), an increase of 10.6 kg (95% CI: 9.4–11.8). BMI increased (P < 0.0001) during the same period from 20.9 (95% CI: 20.6–21.2) to 24.6 (95% CI: 24.1–25.1). The corresponding figures for the 72-cohort at 19 years of age were 59.4 kg (95% CI: 58.6–60.3) and 21.2 (95% CI: 21.0–21.5) increasing (P < 0.0001) to 67.1kg (95% CI: 65.8–68.3) and 24.0 (95% CI: 23.5–24.4) at 34 years of age. When performing a cross-sectional comparison between the two cohorts for a period of 15 years from 19 to 34 years of age, the women in the 72-cohort had a higher weight (P < 0.05) than the 62-cohort.
Information about BMI distribution at the different assessment points for both cohorts is included in Table I. According to the WHO BMI classification, a few women in the 62- and 72-cohorts at 19 years of age were underweight, 33 (12%) and 30 (8%), respectively, some women were overweight 11 (4%) and 24 (7%), respectively, and two were obese class 1 in the 62 cohort and one woman was obese class 2 in the 72 cohort, but the majority were within the normal BMI range (84 and 85%, respectively).
The use of combined oral contraception and body weight
The two cohorts were combined to investigate possible factors influencing body weight. There were 614 women in the two cohorts ≤ 34 years of age who completed questions about the current use of COC, number of COC months, number of children, weight/height, smoking and exercise, and these women were included in the analysis when comparing COC use and weight development. COC usage was the most common method of contraception among the women ≤ 29 years of age and had been used at some time by 92.5% of the women. Forty-six women (7.5%) reported they had never used COCs at 34 years of age. At 34 years of age, the mean number of months of COC use was 89.3 (95% CI: 84.5–94.1).
The women who had never used COCs were compared with women who had used COCs with regard to the use of other types of hormonal contraception as this may also possibly influence weight increase. Other types of hormonal contraception used by the women who had never used COCs up to 34 years of age was as follows : 3% had used progestogen-only pills, 8% had used a LNG-IUS, injectable contraception (Depo-Provera®) 0% and implants 0%). It should be noted that 25% of these women had used a copper-intrauterine device (IUD). This can be compared with the 568 women who had used COCs (5% had used progestogen-only pills, 26% had used a LNG-IUS, injectable contraception (Depo-Provera) 1% and implants 1%). In this group of women, 36% had used a copper IUD. Thus, the use of other hormonal methods was not greater among women who had not used COCs.
The women were also questioned at each assessment point if they had discontinued COC use and if so why. In this study, weight gain or fear of weight gain was not the most common cause for COC discontinuation in either of the two cohorts at any of the assessment points. The percentage of women discontinuing COC due to weight gain in the 62-cohort were as follows: 19 years 18%; 24 years 16%; 29 years 14%; 34 years 12%; 39 years 10%; 44 years 13%. The corresponding figures for the 72-cohort were as follows: 19 years 17%; 24 years 14%; 29 years 13%; 34 years 10%.
There was no significant difference in weight increase/BMI increase between women who had used COCs (n = 568) 7.18 kg/2.50 at some time and women who had never used COCs (n = 46) 6.72 kg/2.36. To find whether COC use is associated with weight gain, we performed a longitudinal analysis and the factors of age, COC use, children, smoking and exercise were included in the model to find predictors for weight change. The only predictor for weight increase was age (P < 0.001) resulting in a gain of 0.45 kg/year. There was no significant correlation between weight gain and duration of COC use (0.072 kg/year), number of children (0.13kg/child) or exercise (−0.18 kg) for the 15-year period. Smokers decreased (P < 0.001) their weight by 1.64 kg for the whole 15-year period. A comparison of the estimated weight changes and observed weight changes over 15-year period was performed and showed a good fit (R2 = 0.85, P < 0.0001) in this longitudinal analysis model. We also performed the longitudinal analysis with ‘cohort’ included in the analysis as the two cohorts differed in life experiences, which may have influenced the results of this longitudinal analysis. With the results of this analysis, it was possible to assess the interaction between the factor cohort and the other possible predictors. There was no effect of cohort and the identified predictors were unchanged, i.e. there was no influence of COC use, number of children or exercise, whereas age and smoking were significant predictors of weight change.
The women were also grouped according to the duration of COC use (no use ever, ≤ 4, >4–8, >8–12 and >12 years of COC use) to identify any possible relationship between duration of COC use and weight increase, BMI increase, number of children, smoking and exercise. There were no significant differences between any of the groups except for the mean number of children which was significantly lower (P < 0.001) in the group who used COC >12 years compared with the >4–8 years group and compared (P < 0.05) to the group with ≤ 4 years of COC use (Table III). Fig. 2. depicts the results of linear regression analysis between weight change from 19 to 34 years and the duration of COC use in women from both the 62- and 72-cohorts.
Weight increase, BMI increase, number of children, smoking and exercise in the two cohorts of women combined, grouped according to duration of COC use.
| N = 568 | COC use ≤4 years (n = 190) | COC use >4–8 years (n = 148) | COC use >8–12 years (n = 143) | COC use >12 years (n = 87) | Level of significance |
|---|---|---|---|---|---|
| Weight increase, mean (95% CI) | 7.2 (6.0–8.4) | 7.4 (6.1–8.6) | 7.0 (5.7–8.3) | 7.2 (5.6–8.8) | NS |
| BMI increase, mean (95% CI) | 2.5 (2.1–2.9) | 2.6 (2.2–3.1) | 2.4 (1.9–2.9) | 2.5 (2.0–3.1) | NS |
| Children, mean (95% CI) | 1.7 (1.5–1.8) | 1.8 (1.7–2.0) | 1.6 (1.4–1.8) | 1.2 (1.0–1.4) | Significant |
| Smoke at one of the assessment points, % (95% CI) | 52 (45–59) | 43 (35–51) | 46 (38–54) | 47 (36–58) | NS |
| Smoke at all assessment points, % (95% CI) | 13 (8–18) | 8 (4–13) | 12 (7–17) | 16 (8–24) | NS |
| Regular exercise at all assessment points, % (95% CI) | 43 (36–50) | 53 (45–62) | 55 (46–63) | 51 (40–61) | NS |
Significance of difference: number of children was significantly lower (P < 0.001) in the >12 years compared with the >4–8 years and in the >12 years compared with the ≤4 years (P < 0.05).
COC, combined oral contraception; Smoke all/ Exercise all, all four occasions; Smoke one/Exercise one, answered at least one occasion.
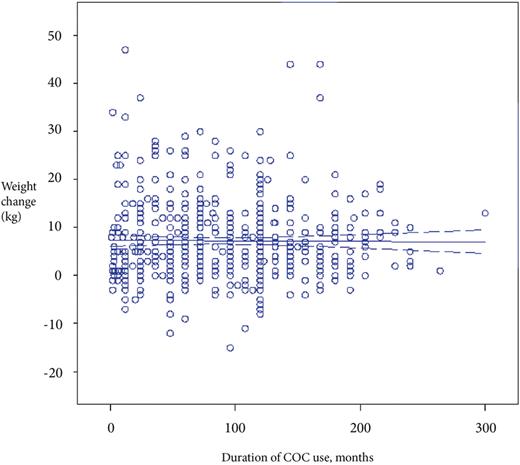
Results of linear regression analysis of duration of COC use (months) and weight change (Weight gain = 7.24–0.0007*duration of COC use, r = 0, NS) in the two cohorts combined (n = 614).
Discussion
In this longitudinal study, COC use was found not to be a predictor for weight increase and there was no significant difference in weight or BMI increase between COC users and non-users. Nor was weight increase correlated to the duration of COC use. In the longitudinal analysis of factors influencing weight change, the only factors predictive of weight change were age and smoking. Age was a major predictor for weight increase and smokers decreased their weight. The women from the 62-cohort reported a weight increase in excess of 10 kg during the 25-year period from 19 to 44 years of age. There was also a trend over time regarding body weight when comparing 19-year-old women from the 62- and 72-cohorts, by which women from the 72-cohort had a higher weight/BMI compared with the 62-cohort at the age of 34 years.
A Cochrane review (Gallo et al., 2008) concluded that evidence was insufficient to conclude an effect of combined contraceptives on weight, but no major effect on weight was evident. However, the same Cochrane review pointed out that few placebo-controlled studies have been conducted and in most trials of COCs weight change was not a primary outcome, studies have been of short duration and a longer observation period may be required to demonstrate evidence of weight gain. The studies included in the Cochrane review were mainly randomized controlled trials of short duration comparing different forms of combined contraceptives, and only a few studies of placebo-controlled trials were included.
In a comparison of two placebo-controlled trials, no major influence of COCs was recorded (Coney et al., 2001). The authors noted that most studies have chosen either 2.0 or 2.3 kg as the cut-off point to designate a weight increase during the observation period, and they sought consensus as to what constitutes excessive weight gain. The same authors also pointed out the importance of placebo studies to assess weight gain over time. One recently conducted trial (Berenson and Rahman, 2009) compared changes in body weight and body composition in women aged 16–24 or 25–33 years during 3 years of COC, depot medroxyprogesterone acetate or non-hormonal methods (NH). This study showed that COC users did not gain more weight than NH users, but they did increase their total lean body mass. A prospective study (Beksinska et al., 2010) with a 4–5-year follow-up of adolescents (aged 15–19 years) regarding different contraceptive methods showed that injectable contraceptive users gained 6.2 kg, while the COC group and non-users gained 2.3 kg and 2.8 kg, respectively. However, neither of these two studies had COC use and weight change as a primary outcome, and the numbers of those who discontinued were quite high, probably due to the long time follow-up. It has also been suggested that weight change in young women is more likely to be seen as natural growth rather than a result of COC use (Rekers, 1988).
There are several studies in the literature describing women's weight change in the long-term perspective (Sheehan et al., 2003; Nooyens et al., 2008), and most of these studies describe the prevalence of overweight and obesity, which is strongly related to age (Flegal, 2000). Information regarding the normal pattern of weight increase and factors influencing weight increase in the general population of women of fertile age is important to be able to subsequently assess the influence of extrinsic factors on weight development. In the present study, the women were selected at random from the total population of women resident in the city of Gothenburg in 1981 and in 1991, and the same women were followed longitudinally during the fertile period. The use of contraception, pregnancies and factors such as smoking, body weight and height were followed in the same women at 5-year intervals from 19 to 44 years of age in the 62-cohort and from 19 to 34 years of age in the 72-cohort. The long-term follow-up of the same women was made possible by the use of the individual's personal identification number, which has been in use in Sweden since 1947.
There was a higher mean body weight in the women from the 72-cohort compared with the 62-cohort. It should also be noted that the reported higher body weight and BMI at 19 years of age in the 72-cohort compared with the 62-cohort continued to increase in a later cohort from 1982, an observation also reported elsewhere (Lindh et al., 2009). The Doetinchem cohort study (Nooyens et al., 2008), with an 11-year follow-up, used longitudinal data and also demonstrated that more recently born cohorts had a higher BMI at a given age than cohorts who were born earlier. The highest increase in weight and BMI during this follow-up period was observed in the age group of 20–29 years of age (weight gain 6.7 kg; BMI gain 2.2). Another large longitudinal study that collected subjects from the first National Health and Nutrition Examination Survey (NHANES I) done for 20 years also confirmed that weight gain was highest among young adults (Sheehan et al., 2003).
Many studies have reported a successive increase in the prevalence of obesity over time in the USA, in Great Britain and in other European countries (e.g. Silventoinen et al., 2004; Rennie and Jebb, 2005;,Ogden et al., 2006). However, the women in our study mainly had a BMI of 18.5 to < 25.0, corresponding to a normal BMI (World Health Organization, 1998). Only a small number of the women in our study reported overweight or obesity. In this respect, it should be noted that the results regarding body weight/BMI reported in this study corresponds well to the self-reported weight in the Swedish examination of conditions of life study (ULF-study; Weight and height in the population, 2008). It is possible that the prevalence of overweight and obesity is lower in Sweden. Another Swedish study speculated that a high level of physical activity together with a decrease in the selection of food containing fat and sucrose may have contributed to the stability of the BMI in Swedish women compared with many other parts of the world (Lissner et al., 2008). However, another possible explanation may be that fewer women with a high body weight in our study answered and returned the questionnaire when first contacted in 1982 and 1992, respectively, due to a lack of interest in answering questions about body weight, contraception and reproductive health. It is well known that women who are overweight have more difficulties in obtaining a suitable contraceptive, and body weight/BMI are important factors when considering an appropriate method of contraception. It is also important to note that another possible limitation of our study is that weight data were self-reported by the women themselves on all occasions during the study period and it may, for this reason, be underestimated. However, the women reported their current weight every fifth year and it is unlikely that they would recall what they reported during the previous assessment 5 years earlier. In this respect, it was therefore possible to reassess the reported weight, and in general reasonable agreement was found. This study also lacks information about nutrition and alcohol consumption, which may influence body weight.
Many factors have been implicated as a cause of weight gain such as food intake and, in particular, type of food, consumption of sweetened or alcoholic beverages, smoking, physical activity, pregnancy and childbirth stress, to name a few (Gunderson and Abrams, 1999; Cournot et al., 2001). This study questions whether or not COCs influence weight gain in the long term. The results of the study do not indicate a long-term influence of COCs on weight gain. However, as this is an important issue regarding oral contraceptive compliance, further studies confirming this issue would be useful. It is of importance when giving contraceptive counselling to inform women that weight changes are a natural development from a life-time perspective. Many women at present discontinue COC use concerned about weight gain which they attribute to COC use; but this study has not been able to confirm this assumption.
Authors' roles
Study design: I.L., A.A.E., I.M., execution: I.L., I.M., analysis: I.L., I.M., manuscript drafting: I.L., A.A.E., I.M., critical discussion: I.L., A.A.E., I.M.
Funding
The study was supported by grants from The Göteborg Medical Society, Hjalmar Svenssons Fund and a National LUA/ALF grant no 11315.
Acknowledgements
We thank Ms Marianne Sahlén and Ms Anja Andersson for help with data registration and Björn Areskoug MSc for expertise in statistical programming.
