


Abstract
A dynamic balance between pro- and anti-inflammatory factors contributes to regulating human female reproduction. Chronic low-grade inflammation has been detected in several female reproductive conditions, from anovulation to embryo implantation failure. C-reactive protein (CRP) is a reliable marker of inflammation that is extensively used in clinical practice. Recent studies quantified CRP in the serum of infertile women undergoing ART and suggested its potential for the prediction of ART reproductive outcomes.
The first objective of this systematic review of the available literature was to evaluate the association between pre-implantation circulating CRP concentration and pregnancy rates in women undergoing ART. The second objective was to describe serum CRP concentration changes after early embryo implantation. The changes in circulating CRP throughout the ART cycle, clinical implications of CRP quantification for the management of women undergoing ART, and future therapeutic options will also be discussed.
The MEDLINE database was systematically searched from inception to March 2019 using the following key words: (C-reactive protein) AND (assisted reproductive techniques OR ovulation induction OR insemination OR in vitro fertilization). Only articles in English were considered. Studies were selected based on title and abstract. The full text of potentially relevant articles was retrieved and assessed for inclusion by two reviewers (S.B. and S.H.). The protocol was registered in the International prospective register of systematic reviews (PROSPERO; registration number: CRD148687).
In total, 10 studies were included in this systematic review. Most of these studies reported lower circulating CRP values before the window of implantation and higher circulating CRP values during the peri-implantation period in women with successful ART outcome (biochemical or clinical pregnancy) compared to women without a successful outcome. Several lifestyle factors and/or drugs that reduce the concentration of circulating CRP significantly improve ART outcomes. Subgroup analyses according to female BMI and baseline circulating CRP concentration are highly recommended in future analyses.
These findings highlight a possible detrimental impact of preconception high circulating CRP concentration on ART outcomes. However, the biochemical or clinical pregnancy rate endpoints used in the studies examined here are insufficient (there were no data on live birth outcome), and the impact of major variables that can influence CRP and/or ART, for example maternal age, BMI, number of transferred embryos, and use of anti-inflammatory drugs, were not considered in the analyses. CRP quantification may be a potential marker of ART outcome, but its predictive value still needs to be investigated in large prospective studies. In future, the quantification of circulating CRP before starting ART could help to identify patients with a poor ART prognosis, leading to ART cycle cancellation or to preconception treatment to minimize the medical risks and costs.
Introduction
Inflammatory molecules (e.g. cytokines, growth factors and hormones) and immune cells (e.g. macrophages, neutrophils and lymphocytes) play a critical role in ovarian folliculogenesis, ovulation and embryo implantation (reviewed in Vinatier et al., 1995, Gaytan, Morales, Bellido, Sanchez-Criado, & Gaytan, 2006, van Mourik, Macklon, & Heijnen, 2009, Mor, Cardenas, Abrahams, & Guller, 2011, Granot, Gnainsky, & Dekel, 2012, Dekel, Gnainsky, Granot, Racicot, & Mor, 2014, Boots & Jungheim, 2015). Hence, aberrant inflammation can affect female fertility. The use of non-steroidal anti-inflammatory drugs consistently inhibits ovulation in mammals, including humans (reviewed in Gaytan et al., 2006). In addition, the number (Chen et al., 2007) and quality (Lee et al., 2000) of oocytes were reduced in women with increased levels of serum resistin and intrafollicular tumor necrosis factor (TNF)-α (two pro-inflammatory factors) during IVF. In agreement, transcriptomic analysis of granulosa cells revealed that an imbalance between pro-inflammatory and anti-inflammatory mediators was associated with IVF failure (Fortin et al., 2019). Successful embryo implantation also requires proper local and systemic inflammatory responses (reviewed in Mor et al., 2011, Dekel et al., 2014). Endometrial decidualization is initially characterized by an acute-phase inflammatory response followed by a strong anti-inflammatory response (Salker et al., 2012), thus balancing receptivity and selectivity of the human endometrium towards the growing embryo (Macklon & Brosens, 2014). In IVF, increased expression of pro-inflammatory proteins has been observed in endometrial fluid samples collected immediately before embryo transfer in women who did not achieve pregnancy (Azkargorta et al., 2018), suggesting that elevated local inflammation is detrimental for embryo implantation. Indeed, increased endometrial inflammation adversely affects embryo implantation, an effect that underlies the concept of contraceptive intrauterine devices (Ortiz and Croxatto 2007). Moreover, increased inflammation has detrimental effects on the embryo-maternal crosstalk, resulting in impaired trophoblast–endometrial interactions (Weiss, Goldsmith, Taylor, Bellet, & Taylor, 2009), poor reproductive outcomes (Vannuccini et al., 2016), early pregnancy loss and pathological implantation sites (Salker et al., 2012).
As the dynamic balance of pro- and anti-inflammatory factors is necessary for successful pregnancy, chronic low-grade production of inflammatory factors might have deleterious effects on female fertility (Lee et al., 2000; Chen et al., 2007; Weiss et al., 2009; Vannuccini et al., 2016). Chronic low-grade inflammation is a common condition that affects 20 to 40% of women of reproductive age (Sjaarda et al., 2018). It is also associated with several reproductive pathologies, such as polycystic ovary syndrome (PCOS) (Kelly et al., 2001; Agacayak et al., 2015; Kahyaoglu et al., 2017), endometriosis (Ahn et al., 2015; Monsanto et al., 2016; Wu et al. 2017) and ovarian hyperstimulation syndrome (OHSS) (Orvieto, 2004; Nastri, Ferriani, Rocha, & Martins, 2010; Nastri, Teixeira, Moroni, Leitao, & Martins, 2015).
Chronic low-grade inflammation and C-reactive protein
C-reactive protein (CRP) participates in the non-specific immune response (Pepys & Hirschfield, 2003; Thiele et al., 2015) and is a reliable marker of inflammation that is widely used in clinical practice (Pepys & Hirschfield, 2003; Ansar & Ghosh, 2013; Thiele et al., 2015; Bray et al., 2016). CRP is synthesized primarily by hepatocytes in response to a variety of inflammatory cytokines (Pepys & Hirschfield, 2003), but extra-hepatic CRP expression also has been detected (e.g. in alveolar macrophages, epithelial cells of the human respiratory tract, arterial smooth muscle-like cells and macrophages and renal cortical tubular epithelial cells) (Dong & Wright, 1996; Gould & Weiser, 2001; Yasojima, Schwab, McGeer, & McGeer, 2001; Jabs et al., 2003). CRP has a role in the innate immune system (Du Clos, 2000; Pepys & Hirschfield, 2003; Thiele et al., 2015). Similar to immunoglobulins, it activates complement, binds to Fc receptors and acts as an opsonin against various pathogens (Du Clos, 2000). CRP interaction with Fc receptors leads to the production of pro-inflammatory cytokines that enhance the inflammatory response. Unlike immunoglobulins (which recognize specific antigenic epitopes), CRP recognizes altered self and some foreign molecules based on pattern recognition (Du Clos, 2000). Thus, CRP acts as a surveillance molecule, providing an early defense and leading to pro-inflammatory signaling and activation of the humoral, adaptive immune response (Du Clos, 2000).
In healthy subjects, the average circulating CRP concentration is lower than 2 mg/L (Pepys & Hirschfield, 2003; Ansar & Ghosh, 2013). Acute infection and tissue damage cause a major increase in circulating CRP (up to 1000 times) within several hours (Pepys & Hirschfield, 2003; Marnell, Mold, & Du Clos, 2005; Ansar & Ghosh, 2013; Thiele et al., 2015). CRP levels >10 mg/L are considered a sign of ongoing acute inflammation (Biasucci et al., 2004). Circulating CRP concentrations between 2 and 10 mg/L are considered to reflect chronic low-grade inflammation (Pepys & Hirschfield, 2003; Ansar & Ghosh, 2013) that might be caused by different factors (Kushner, Rzewnicki, & Samols, 2006), such as overweight/obesity (Ford, 1999; Visser, Bouter, McQuillan, Wener, & Harris, 1999; Yudkin, Stehouwer, Emeis, & Coppack, 1999; Festa et al., 2001; Rexrode, Pradhan, Manson, Buring, & Ridker, 2003; Thorand et al., 2006; Saltiel & Olefsky, 2017), psychological stress (Coussons-Read, Okun, & Nettles, 2007), unhealthy dietary patterns (Kushner et al., 2006) and genetic polymorphisms (Kluft & de Maat, 2003).
Circulating C-reactive protein level detection and variations in women undergoing ART.
| Reference | ART type | n | CRP quantification | Outcome |
|---|---|---|---|---|
| Prabhu et al., 2009 | IUI | 42 | Before and after insemination | No variation in late follicular phase (CC) |
| Tasdemir et al., 2015 | IUI | 42 | After insemination | No variation in luteal phase (CC) |
| Kahyaoglu et al., 2017 | IUI | 60 | Before insemination | Detection in patients with PCOS (CC) |
| Sahin et al., 2018 | IUI | 63 | Before and after insemination | Detection in infertile patients (CC or FSH) |
| Almagor et al., 2004 | IVF | 72 | Before and after ovarian puncture | Significantly ↑ in late luteal phase (during WOI) (COH protocol?) |
| Sacks et al., 2004 | IVF | 135 | Before and after ovarian puncture | ↑ in late luteal phase (during WOI) (agonist and antagonist) |
| Orvieto et al., 2004 | IVF | 16 | Before ovarian puncture | Significantly ↑ throughout COH (agonist) |
| Orvieto et al., 2005 | IVF | 15 | Before ovarian puncture | Significantly ↑ in late follicular phase (agonist) |
| Wunder et al., 2005 | IVF | 162 | Before ovarian puncture | Significantly ↑ in late follicular phase (agonist) |
| Levin et al., 2005 | IVF | 40 | After ovarian puncture | Detection in patients undergoing IVF (COH protocol?) |
| Levin et al., 2007 | IVF | 28 | Before and after ovarian puncture | Detection in patients undergoing IVF (agonist) |
| Orvieto et al., 2006 | IVF | 24 | Before ovarian puncture | Significantly ↑ in late follicular phase (antagonist) |
| Orvieto et al., 2007 | IVF | 27 | Before ovarian puncture | ↑ across follicular phase (agonist > antagonist) |
| Robinson et al., 2008 | IVF | 114 | Before ovarian puncture | Detection in patients undergoing IVF (agonist) |
| Arefi et al., 2010 | IVF | 70 | Before ovarian puncture | Significantly ↑ in follicular and luteal phase |
| Seckin et al., 2012 | IVF | 69 | Before and after ovarian puncture | Significantly ↑ in late luteal phase (during WOI) (agonist) |
| Liu et al., 2014 | IVF | 70 | Before and after ovarian puncture | Significantly ↑ in luteal phase (during WOI) (agonist and antagonist) |
| Yildizfer et al., 2015 | IVF | 26 | Before and after ovarian puncture | Detection in patients undergoing IVF (COH protocol?) |
| Korhonen et al., 2016 | IVF | 27 | Before and after ovarian puncture | Significantly ↑ across follicular phase, peak after ovarian puncture and ↑ in late luteal phase (agonist) |
| Buyuk et al., 2017 | IVF | 39 | Before ovarian puncture | Detection in patients undergoing IVF (agonist and antagonist) |
| El-shawarby et al., 2005 | FET | 85 | Before and after ovarian puncture | Detection in patients undergoing IVF (agonist) |
Numeric values are available in Supplementary Table SI.
CRP: C-reactive protein; FET: frozen embryo transfer; CC: clomiphene citrate; WOI: window of implantation; COH: controlled ovarian hyperstimulation; OP: ovarian puncture.
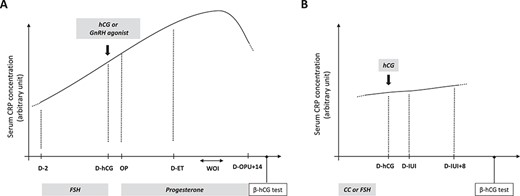
Proposed model of circulating C-reactive protein concentration dynamics in women undergoing ART. In IVF (A), circulating C-reactive protein (CRP) values rise from the early follicular phase to the window of implantation. In IUI (B), circulating CRP concentration remains similar from the start of controlled ovarian hyperstimulation (COH) to the luteal phase. D: day; WOI: window of implantation; OP: ovarian puncture; ET: embryo transfer; CC: clomiphene citrate.
Circulating CRP in women of reproductive age
Age does not seem to influence serum CRP concentration in women of reproductive age (Wener, Daum, & McQuillan, 2000; Wood et al., 2000; McConnell et al., 2002; Ford et al., 2003; Woodward, Rumley, Lowe, & Tunstall-Pedoe, 2003; Orvieto et al., 2004; Robinson, Pemberton, Laing, & Nardo, 2008). On the other hand, serum CRP concentration is strongly and positively correlated with BMI (Ford, 1999; Visser et al., 1999; Yudkin et al., 1999; Festa et al., 2001; Rexrode et al., 2003; Thorand et al., 2006), including in infertile women undergoing IVF (Wunder et al., 2005; Levin et al., 2007; Robinson et al., 2008; Yildizfer et al., 2015; Buyuk et al., 2017) and in pregnant women (Ertas et al., 2010). Smoking does not seem to have any impact on circulating CRP in women (Koenig et al., 1999; Frohlich, Sund, Lowel, & Imhof, 2003; Robinson et al., 2008). The available findings on CRP concentration changes during the menstrual cycle are conflicting and no robust conclusions can be reached (Jilma et al., 1997; Blum et al., 2005; Puder et al., 2006; Wunder et al., 2006; Capobianco et al., 2010; Gaskins et al., 2012; Lorenz, Worthman, & Vitzthum, 2015). Interestingly, serum CRP levels may differ in ovulatory and anovulatory cycles, suggesting that ovulation (rather than hormone variations) could be more relevant to understanding CRP changes during natural cycles (Capobianco et al., 2010; Lorenz et al., 2015). Sexual activity (Lorenz et al., 2015) and menstrual cycle symptoms (Puder et al., 2006) have been positively associated with increased serum CRP concentrations in women of reproductive age. Moreover, elevated CRP values have been reported in women with PCOS (Kelly et al., 2001; Escobar-Morreale et al., 2011; Agacayak et al., 2015; Kahyaoglu et al., 2017), OHSS (Orvieto, 2004; Sacks, Seyani, Lavery, & Trew, 2004; Levin et al., 2005; Korhonen, Savolainen-Peltonen, Mikkola, Tiitinen, & Unkila-Kallio, 2016) and endometriosis (Kianpour et al., 2012). Moreover, elevated circulating CRP levels have been negatively associated with natural conception, with a significant reduction in spontaneous pregnancy and live birth rates in women with high preconception CRP levels (≥1.95 mg/L) (Sjaarda et al., 2017).
Circulating CRP in infertile women
Infertility is defined as the inability to conceive after 1 year of sexual relationships without contraception. It concerns ~10–15% of individuals of reproductive age (Practice Committee of the American Society for Reproductive, 2006). ART is widely used to overcome human infertility. Interestingly, controlled ovarian hyperstimulation (COH) and ovarian puncture induce a temporary inflammatory state, as indicated by the increase in circulating inflammatory cytokines (Orvieto et al., 2003; Orvieto, et al., 2006; Persson et al., 2012). Consistently, several studies have reported that circulating CRP concentration increases in women undergoing ART (Table I, Fig. 1, and Supplementary Table SI). Specifically, in IVF, serum CRP concentration significantly increases from the start of COH to the day of ovarian puncture (Fig. 1A) (Orvieto et al., 2004; Orvieto, Fisch, Yulzari-Roll, & La Marca, 2005; Wunder et al., 2005; Orvieto, Zagatsky, Yulzari-Roll, La Marca, & Fisch, 2006; Orvieto et al., 2007; Arefi, Babashamsi, Panahi, Asgharpour Saruiy, & Zeraati, 2010; Liu et al., 2014). The administration of hCG instead of a GnRH agonist for the final follicular maturation in IVF cycles seems to be associated with higher CRP concentrations (Orvieto et al., 2006), suggesting a higher degree of systemic inflammation. Consistently, antagonist cycles are considered to induce less systemic inflammation (Orvieto, 2004; Orvieto et al., 2006; Orvieto et al., 2007). After ovarian puncture, CRP values seem to increase until the window of implantation (WOI) (Almagor, Hazav, & Yaffe, 2004; Arefi et al., 2010; Seckin et al., 2012; Liu et al., 2014; Korhonen et al., 2016) and may fall at the end of the ART cycle in the absence of pregnancy (Almagor et al., 2004; Korhonen et al., 2016). On the other hand, in women undergoing IUI, limited data suggest comparable circulating CRP values from the moment of COH to the luteal phase (Fig. 1B) (Prabhu et al., 2009; Tasdemir et al., 2015; Kahyaoglu et al., 2017; Sahin et al., 2018). The use of clomiphene citrate (Prabhu et al., 2009; Tasdemir et al., 2015; Kahyaoglu et al., 2017; Sahin et al., 2018) instead of FSH and/or the use of lower doses of gonadotrophins during COH may contribute to the limited variations of CRP values during IUI cycles.
Altogether, the detrimental role of chronic low-grade inflammation in female fertility and the higher serum CRP concentration in reproductive disorders suggest that circulating CRP could influence ART outcomes. Therefore, CRP quantification before or during ART may provide a surrogate marker of ART success. The aim of this review was to present the evidence published to date on serum CRP quantification and pregnancy rates in women undergoing ART. The first objective of this review was to determine whether circulating CRP quantification before embryo implantation can predict pregnancy rates in women undergoing ART. The second objective was to describe serum CRP concentration changes after early embryo implantation. Finally, the future clinical implications of CRP quantification for the management of women undergoing ART and the usefulness and limitations of therapeutic approaches targeting CRP concentration in the context of ART will be discussed.
Methods
The systematic review was conducted according to the Preferred Reporting Items for Systematic Reviews and Meta-analysis (PRISMA) guidelines (Liberati et al., 2009).
Registration
The protocol was registered in the International prospective register of systematic reviews (PROSPERO); the registration number is CRD42020148687.
Search
A systematic literature review was performed to identify studies that compared circulating CRP concentration and pregnancy rates in women undergoing ART using the MEDLINE database from inception to March 2019. The search terms were (C-reactive protein) AND (assisted reproductive techniques OR ovulation induction OR insemination OR in vitro fertilization). An additional study identified from the references of the selected full-text articles was also included.
Study selection
Articles were restricted to English language only. Two reviewers (S.B. and S.H.) independently searched and reviewed the retrieved articles to exclude studies deemed irrelevant by both observers. Studies were first screened for eligibility based on their titles and abstracts. The full texts of potentially relevant articles were retrieved and included if they reported quantification of circulating CRP in women during ART cycles, defined as IUI or IVF +/− ICSI. Exclusion criteria were transfer of frozen embryos and mean basal circulating CRP concentration higher than 10 mg/L (indicating an acute ongoing inflammatory state). Any disagreement or uncertainty was solved by discussion with a third reviewer (G.B.). The final decision was taken by the senior investigator (S.H.).
Data extraction
The following data were extracted to characterize the included studies: study authors, publication year, ART type, sample size, CRP quantification method and timing, serum CRP concentration and ART outcomes. The following data were extracted to characterize the ART cycles: women’s age, women’s BMI, number of mature follicles in IUI and number of transferred embryos in IVF. For the first objective, only data corresponding to circulating CRP quantified before the connection between the invading blastocyst and the maternal vessels (i.e. before Day 9 post-ovulation trigger (Lohstroh et al., 2005)) were considered. For the second objective, data corresponding to circulating CRP quantified after the presumed embryo implantation (i.e. after Day 9 post-ovulation trigger) were collected and analyzed. All CRP values between women who achieved pregnancy and women who did not that were reported to be significantly different in the included studies were denoted as a ‘significant decrease’ or a ‘significant increase’ in this manuscript. When non-significant results were reported, a difference in CRP values ≥20% between these groups was denoted as a ‘decrease’ or an ‘increase’ in this manuscript. Conversely, if the non-significant difference was lower than 20% between groups, it was defined as ‘similar concentrations’ in this manuscript. The threshold of 20% was based on the intraindividual variation of circulating CRP levels in women who were tested for different consecutive days (Qi et al., 2016), suggesting that a difference of CRP values below 20% between women who achieved pregnancy and women who did not is biologically irrelevant. Data were extracted independently by two authors (S.B. and M.A.). Any disagreement or uncertainty was solved by discussion.
Quality assessment
The methodological quality of each study was assessed by two reviewers (S.B. and M.A.) using a modified Newcastle–Ottawa scale (NOS) (Supplementary Table SII). Each study was rated according to six items categorized in three domains: selection, comparability of groups and ascertainment of outcome (maximum scores: 4, 2 and 4, respectively). Scores were represented with stars to provide a visual assessment of each item. Studies that met all the quality requirements obtained 10 points/stars.
Results
Study selection
The initial search of studies on CRP concentration and ART outcomes identified 69 potentially relevant articles (Fig. 2). After screening the titles, 44 abstracts were reviewed and 35 full-text articles were assessed for eligibility for the primary objective. After exclusion of articles outside the objective, 14 studies on circulating CRP in women undergoing ART were selected for detailed review (Supplementary Table SIII). Among these 14 studies, four were excluded because circulating CRP was quantified in women undergoing frozen embryo transfer (n = 1) (El-Shawarby, Sacks, Seyani, Lavery, & Trew, 2005) or because the mean basal CRP concentration in women undergoing ART was higher than 10 mg/L (n = 3) (Levin et al., 2007; Liu et al., 2014; Kahyaoglu et al., 2017). Finally, this systematic review included a total of 10 studies that evaluated the association between CRP levels and ART reproductive outcomes in women undergoing IUI cycles (n = 2) and in women undergoing IVF cycles (n = 8). For the first objective, 10 studies reported CRP quantification before the WOI and ART reproductive outcomes. For the second objective, four studies evaluated the association between CRP quantification during the peri-implantation period and ART reproductive outcomes.
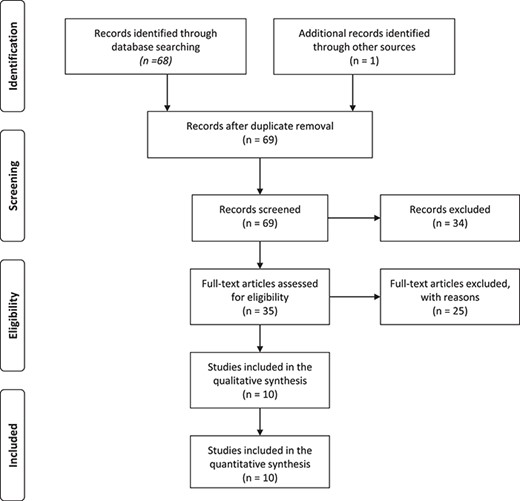
Flow chart of the included studies and search strategy.
Quality assessment and study characteristics
The quality of the included studies was assessed with the modified NOS (Table II). The mean total score was 5.6 (range: 3–8). The selection criteria were fully stated only in one study (Seckin et al., 2012). The comparability between women who did not (non-pregnant) and who did achieve (pregnant) pregnancy was limited because confounding factors, such as female age, female BMI, number of mature follicles (in IUI) and number of transferred embryos (in IVF), were fully controlled only in 20.0% (2/10) of studies (Supplementary Table SIV) (Seckin et al., 2012; Yildizfer et al., 2015). Five studies evaluated biochemical pregnancy (Wunder et al., 2005; Seckin et al., 2012; Tasdemir et al., 2015; Yildizfer et al., 2015; Sahin et al., 2018), and four studies assessed clinical pregnancy (Almagor et al., 2004; Sacks et al., 2004; Robinson et al., 2008; Buyuk et al., 2017). No information was available on the definition of pregnancy in one study (Arefi et al., 2010). The predictive accuracy of CRP quantification was reported in 20.0% (2/10) of studies (Almagor et al., 2004; Buyuk et al., 2017). The comparison of circulating CRP concentrations between non-pregnant and pregnant women was described with P values in 90.0% (9/10) of studies (Almagor et al., 2004; Sacks et al., 2004; Wunder et al., 2005; Robinson et al., 2008; Arefi et al., 2010; Seckin et al., 2012; Tasdemir et al., 2015; Buyuk et al., 2017; Sahin et al., 2018). Circulating CRP was quantified with high sensitivity CRP (hsCRP) assays, which can detect minor changes in low CRP concentrations, in 66.7% (7/10) of studies (Tables II and III) (Sacks et al., 2004; Wunder et al., 2005; Robinson et al., 2008; Seckin et al., 2012; Tasdemir et al., 2015; Yildizfer et al., 2015; Buyuk et al., 2017). One study used hsCRP only for CRP quantification during the peri-implantation period (but not before the WOI) (Sacks et al., 2004). Serum CRP was quantified using an ELISA in 60.0% (6/10) of studies (Wunder et al., 2005; Robinson et al., 2008; Arefi et al., 2010; Yildizfer et al., 2015; Buyuk et al., 2017), immunoturbidimetry in 30.0% (3/10) of studies (Almagor et al., 2004; Sacks et al., 2004; Seckin et al., 2012) and immunonephelometry in 10.0% (1/10) of studies (Sahin et al., 2018). No limit of detection was mentioned in 50.0% (5/10) of studies (Almagor et al., 2004; Arefi et al., 2010; Yildizfer et al., 2015; Buyuk et al., 2017; Sahin et al., 2018). The intra-assay and inter-assay coefficients of variation ranged from 1.34% (Seckin et al., 2012) to 10.65% (Wunder et al., 2005) among studies. CRP concentration was expressed in mg/L in 70.0% (7/10) of studies (Almagor et al., 2004; Sacks et al., 2004; Robinson et al., 2008; Arefi et al., 2010; Seckin et al., 2012; Yildizfer et al., 2015; Sahin et al., 2018), as recommended (Myers et al., 2004).
Modified Newcastle–Ottawa scale used for the quality assessment of the included studies.
| References | Selection | Comparability | Assessment of the outcome | Statistical test | NOS score | ||
|---|---|---|---|---|---|---|---|
| Description of the cohort | Sample size | CRP quantification assay | |||||
| Sahin et al., 2018 | * | - | * | * | * | * | 5 |
| Tasdemir et al., 2015 | * | - | ** | * | * | * | 6 |
| Almagor et al., 2004 | - | - | - | - | ** | ** | 4 |
| Sacks et al., 2004 | * | - | −/# | * | ** | * | 5 |
| Wunder et al., 2005 | * | - | ** | * | * | * | 6 |
| Robinson et al., 2008 | * | - | ** | - | ** | * | 6 |
| Arefi et al., 2010 | * | * | - | - | - | * | 3 |
| Seckin et al., 2012 | * | * | ** | ** | * | * | 8 |
| Yildizfer et al., 2015 | * | - | ** | ** | * | - | 6 |
| Buyuk et al., 2017 | * | - | ** | - | ** | ** | 7 |
#hs-CRP only for the secondary objective. See also Supplementary Table SII.
Methods of CRP quantification in the included studies.
| ART type | Reference | hsCRP | Matrix | Method of quantification | Analyzer/kit | Reference range | LoD | CV% | Expression of CRP concentration |
|---|---|---|---|---|---|---|---|---|---|
| IUI | Sahin et al., 2018 | No? | Serum | Immunonephelometry | IMAGE 800 (Beckman Coulter Inc., Brea, CA, USA) | / | / | / | mg/L |
| Tasdemir et al., 2015 | Yes | Serum | ELISA | BioCheck, Inc., Foster City, USA | / | 0.1 mg/L | Intra-assay: 7.5% Inter-assay: 4.1% | ng/mL | |
| IVF | Almagor et al., 2004 | No | Serum | Immunoturbidimetry | Integra-700 chemistry (Roche Diagnostics, Switzerland) | <5 mg/L | / | / | mg/L |
| Sacks et al., 2004 | No/yes* | Serum | Immunoturbidimetry | Olympus Diagnostics, County Clare, Ireland | / | 2 mg/L/? | / | mg/L | |
| Wunder et al., 2005 | Yes | Serum | ELISA | In-house rabbit polyclonal anti-human CRP antibody (Sigma C3527) | / | 0.0003 mg/L | Intra-assay: 5.54% Inter-assay: 10.65% | μg/mL | |
| Robinson et al., 2008 | Yes | Serum | ELISA | / | / | 0.1 mg/L | Intra-assay: 5.9% between 6.1% | mg/L | |
| Arefi et al., 2010 | No | Serum | ELISA | in-house (no kit specified) | / | / | / | mg/L | |
| Seckin et al., 2012 | Yes | Serum | Immunoturbidimetry | Roche Diagnostics GmbH, Mannheim, Germany | / | 0.03 mg/L | Intra-assay: 1.34% between 5.7% | mg/L | |
| Yildizfer et al., 2015 | Yes | Serum | ELISA | DRG Int Inc., USA | / | / | Intra-assay: 7.2% between 9.8% | mg/L | |
| Buyuk et al., 2017 | Yes? | Serum | ELISA | R&D Systems, Inc. | / | / | Intra-assay: 4 to 10% between 7 and 10% | ng/mL |
hsCRP: high-sensitivity CRP; LoD: limit of detection; CV: coefficient of variation.
*hs-CRP only for the secondary objective.
Serum CRP quantification before embryo implantation and ART outcomes
The association between CRP levels before the WOI and ART outcomes was assessed in women undergoing IUI cycles (n = 2 studies) and IVF cycles (n = 8 studies).
CRP and IUI outcomes
Two studies reported serum CRP concentration after clomiphene citrate or FSH treatment in women undergoing IUI as well as the biochemical pregnancy rates (Tasdemir et al., 2015; Sahin et al., 2018) (Table IV). Tasdemir et al. (2015) compared CRP concentrations after IUI (at Day 2 and Day 8) and found no significant difference in circulating CRP between women who did (n = 8) and who did not (n = 34) achieve biochemical pregnancy.
Association between serum CRP concentration (mg/L or ratio) and ART outcome.
| Reference | ART type | Total (n) | Pregnant group (n) | Non-pregnant group (n) | CRP quantification | CRP concentration and outcome | CRP concentration (non-pregnant versus pregnant group) (mg/L or ratio) |
|---|---|---|---|---|---|---|---|
| Tasdemir et al., 2015 | IUI | 42 | 8 | 34 | After insemination (IUI + 2) | ↑ in non-pregnant women (ns) | 1.02 ± 0.91 versus 0.70 ± 0.53 |
| After insemination (IUI + 8) | ≈ in non-pregnant women (ns) | 0.99 ± 0.67 versus 1.03 ± 1.46 | |||||
| Sahin et al., 2018 | IUI | 63 | 28 | 35 | During COH (D-hCG) | Significantly ↑ in non-pregnant women (***) | 2.2 ± 2.3 versus 0.7 ± 0.5 |
| After insemination (hCG + 8) | Significantly ↑ in non-pregnant women (***) | 3.3 ± 3.5 versus 0.6 ± 0.4 | |||||
| Almagor et al., 2004 | IVF | 72 | 22 | 50 | After COH (D-OPU) | ↓ in non-pregnant women (ns) | 5.2 ± 7.6 versus 9.4 ± 11.9 |
| After COH (D-OPU + 2) | ≈ in non-pregnant and pregnant women (ns) | 6.9 ± 7.4 versus 6.9 ± 6.5 | |||||
| After COH (D-OPU + 2/D-OPU ratio) | Significantly ↑ in non-pregnant women (**) | 2.5 ± 2.7 versus 1.2 ± 1.0; cut-off <1.85 (sensitivity 86%, specificity 44%) | |||||
| After COH (OPU + 5/7) | ≈ in pregnant women (ns) | 14.0 ± 12.9 versus 16.0 ± 11.6 | |||||
| After COH (D-OPU+ 5–7/D-OPU ratio) | ↑ in non-pregnant women (ns) | 5.4 ± 7.3 versus 3.4 ± 3.3 | |||||
| Sacks et al., 2004 | IVF | 135 | 40 | 95 | Before COH (D-2) | ↑ in non-pregnant women (ns) | 0.571 ± 2.02 versus 0.429 ± 1.12 |
| Wunder et al., 2005 | IVF | 162 | 47 | 102 | Before COH (D-1) | ↑ in non-pregnant women (ns) | 1.76 (0.12–36.99) versus 1.26 (0.13–35.46) |
| During COH (D-hCG-1/hCG) | ≈ in non-pregnant and pregnant women (ns) | 1.40 (0.195–87.25) versus 1.25 (0.018–34.25) | |||||
| After COH (D-OPU) | ↑ in non-pregnant women (ns) | 3.48 (0.21–167.5) versus 2.87 (0.07–33.05) | |||||
| Robinson et al., 2008 | IVF | 114 | 41 | 65 | Before COH (D-3) | ≈ in non-pregnant and pregnant women (ns) | 1.17 (0.44–2.73) versus 1.35 (0.48–3.12) |
| Arefi et al., 2010 | IVF | 70 | 30 | 40 | Before COH (D-1) | ≈ in non-pregnant and pregnant women (ns) | 3.68 ± 1.88 versus 4.36 ± 1.92 |
| During COH (D-hCG) | ≈ in non-pregnant and pregnant women (ns) | 4.82 ± 1.99 versus 5.10 ± 1.84 | |||||
| After COH (D-OPU) | ≈ in non-pregnant and pregnant women (ns) | 5.27 ± 1.98 versus 5.90 ± 2.58 | |||||
| After COH (D-OPU + 2/3) | Significantly ↓ in non-pregnant women (***) | 4.84 ± 3.18 versus 8.98 ± 4.18 | |||||
| Seckin et al., 2012 | IVF | 69 | 35 | 34 | At COH start | ≈ in non-pregnant and pregnant women (ns) | 3.24 ± 2.68 versus 3.61 ± 2.86 |
| Yildizfer et al., 2015 | IVF | 26 | 8 | 18 | Before COH (D-3) | Significantly ↑ in non-pregnant women (P value not available) | 3.8 ± 0.5 versus 2.8 ± 0.4 |
| Buyuk et al., 2017 | IVF | 39 | 11 | 27 | Before COH (D-2/3) | Significantly ↑ in non-pregnant women (*) | 1.01 ± 0.13 versus 0.62 ± 0.14; cut-off >0.534 (AUC 0.67) |
| Significantly ↑ in non-pregnant women with DOR (*) | 0.98 ± 0.15 versus 0.24 ± 0.03 mg/L; cut-off >0.317 (AUC 0.89) | ||||||
| Almagor et al., 2004 | IVF | 72 | 22 | 50 | After embryo implantation (D-ET + 10) | ≈ in pregnant women (ns) | 9.9 ± 12.1 versus 11.5 ± 6.4 |
| Sacks et al., 2004 | IVF | 135 | 40 | 95 | After embryo implantation (D-ET + 14) | Significantly ↓ in non-pregnant women (***) | 2.1 ± 1.9 versus 5.8 ± 6.8 |
| Seckin et al., 2012 | IVF | 69 | 35 | 34 | After embryo implantation (D-ET + 7) | ≈ in pregnant women (ns) | 9.14 ± 11.36 versus 10.58 ± 11.35 |
| Yildizfer et al., 2015 | IVF | 26 | 8 | 18 | After embryo implantation (D-ET + 15) | ≈ in non-pregnant women (ns) | 8.4 ± 1.0 versus 7.2 ± 0.8 |
ET: embryo transfer; DOR: diminished ovarian reserve; ns: non-significant; *P < 0.05; ***P < 0.001.
Sahin et al. (2018) found significantly higher CRP levels at ovulation trigger day (i.e. the day of hCG administration) and also at Day 8 post-ovulation trigger in women who did not achieve biochemical pregnancy (n = 35, 2.2 ± 2.3 and 3.3 ± 3.5 mg/L, respectively) compared with women with biochemical pregnancy (n = 28, 0.7 ± 0.5 and 0.6 ± 0.4 mg/L, respectively) (P = 0.001 for day hCG, and P ˂ 0.001 for Day 8). Moreover, CRP level was significantly higher at Day 8 post-ovulation trigger compared with ovulation trigger day in the non-pregnant group (3.3 and 2.2 mg/L, respectively, P = 0.003), but not in the pregnant group (0.6 and 0.7 mg/L, respectively, P = 0.055) (Sahin et al., 2018).
CRP and IVF outcomes
The relationship between serum CRP concentration at different time points during the IVF cycle and IVF outcome was evaluated in eight studies (Table IV). Specifically, 87.5% (7/8) of studies measured serum CRP concentrations before COH (between Day 1 and Day 3 of the menstrual cycle (Sacks et al., 2004; Wunder et al., 2005; Robinson et al., 2008; Arefi et al., 2010; Seckin et al., 2012; Yildizfer et al., 2015; Buyuk et al., 2017), 25% (2/8) on ovulation trigger day or the day before ovulation trigger (hCG/hCG-1) (Wunder et al., 2005; Arefi et al., 2010), 37.5% (3/8) on ovarian puncture day (Almagor et al., 2004; Wunder et al., 2005; Arefi et al., 2010), 25% (2/8) on the day of fresh embryo transfer (i.e. Day 2 or Day 3 after ovarian puncture) (Almagor et al., 2004; Arefi et al., 2010) and 12.5% (1/8) after embryo transfer (i.e. from Day 5 to Day 7 after ovarian puncture) (Almagor et al., 2004).
Two studies reported significantly higher CRP concentrations before COH in women who subsequently did not achieve pregnancy compared with women who achieved pregnancy (Yildizfer et al., 2015; Buyuk et al., 2017) (Table IV). Moreover, the receiver operating characteristic (ROC) curve analysis to determine the Day 3 CRP cut-off values that predicted clinical pregnancy failure showed that a serum CRP threshold level >0.534 mg/L was associated with no clinical pregnancy, with a sensitivity of 68%, a specificity of 60% and an AUC of 0.67 (Buyuk et al., 2017). Buyuk et al. (2017) also found that the CRP concentration difference between the pregnant and non-pregnant groups was more pronounced in women with diminished ovarian reserve (0.241 ± 0.033 mg/L for pregnant women versus 0.983 ± 0.154 mg/L for non-pregnant women; P = 0.01, respectively). In women with diminished ovarian reserve, serum CRP level ≥ 0.317 mg/L predicted no clinical pregnancy with a sensitivity of 86%, a specificity of 100% and an AUC of 0.89 (Buyuk et al., 2017). Two additional studies found that CRP values before COH were higher (+39.7% (Wunder et al., 2005) and +33.1% (Sacks et al., 2004)) in non-pregnant women compared with pregnant women (not significant). However, Sacks and colleagues reported that serum CRP levels before COH were below the assay detection limit (i.e. 2 mg/L), weakening the difference between groups. Three studies reported similar CRP values in both groups before COH (i.e. differences lower than 20%) (Robinson et al., 2008; Arefi et al., 2010; Seckin et al., 2012).
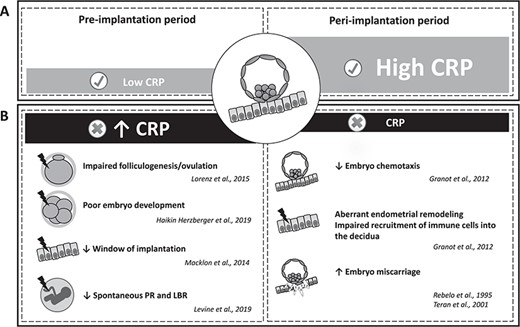
Proposed model of CRP regulation and roles in ART cycles. (A) Modulation of circulating CRP values before and after embryo implantation in optimal ART cycles. (B) Potential effects of CRP dysregulation on ART outcomes. PR: pregnancy rates; LBR: live birth rates.
During COH, similar CRP values were found in non-pregnant and pregnant women on ovulation trigger day (Wunder et al., 2005; Arefi et al., 2010). On ovarian puncture day, results were contradictory (Almagor et al., 2004; Wunder et al., 2005; Arefi et al., 2010). Wunder et al., 2005 reported higher values (Wunder et al., 2005), whereas Almagor et al., 2004 observed lower concentrations in non-pregnant women compared with pregnant women (not significant in both studies) (Almagor et al., 2004). Arefi and colleagues found similar CRP values in both groups (Arefi et al., 2010).
After ovarian puncture, Arefi and colleagues found a significant decrease of CRP concentrations in non-pregnant women (P < 0.001) (Arefi et al., 2010), whereas Almagor et al. (2004) reported similar CRP values in both groups. Almagor et al. (2004) tested the hypothesis that the ratio of CRP concentration at Day 2 post-ovarian puncture/day of ovarian puncture rather than the daily CRP concentration might significantly differ between successful and unsuccessful ART cycles. They found that this ratio was significantly higher in women who did not achieve pregnancy compared with the pregnant group (2.5 ± 2.7 versus 1.2 ± 1.0 mg/L, respectively; P = 0.01) (Almagor et al., 2004). They suggested that a CRP ratio <1.85 could be a predictive marker of IVF outcome (sensitivity: 86%; specificity: 44%) (Almagor et al., 2004).
Serum CRP quantification during early embryo implantation and ART outcomes
The association between CRP levels after embryo implantation and ART outcomes were evaluated in four studies in women undergoing IVF. To date, no study assessed this association in women undergoing IUI cycles.
CRP and IVF outcomes
These four studies evaluated the relationship between IVF outcomes and serum CRP concentration during the early embryo implantation period (i.e. from Day 7 to Day 15 after embryo transfer) (Almagor et al., 2004; Sacks et al., 2004; Seckin et al., 2012; Yildizfer et al., 2015). Only one study found that CRP concentration at Day 14 after embryo transfer was significantly lower in the non-pregnant group compared with the pregnant group (P < 0.0001) (Sacks et al., 2004). The other three studies reported similar CRP values in both groups (Almagor et al., 2004; Seckin et al., 2012; Yildizfer et al., 2015).
Discussion
The available published data on circulating CRP values and ART outcomes suggest that high serum CRP concentrations before embryo implantation could be associated with subsequent ART failure (Fig. 3). Conversely, high circulating CRP values during the early embryo implantation period might be positively associated with successful pregnancy in women undergoing ART (Fig. 3). However, these results need to be considered with caution because of the limited number of studies and their considerable differences in design, population and methods.
Available data on circulating CRP concentration and ART outcomes
Most of the reviewed studies support the association between high CRP values before embryo implantation and subsequent ART failure (Almagor et al., 2004; Sacks et al., 2004; Wunder et al., 2005; Tasdemir et al., 2015; Yildizfer et al., 2015; Buyuk et al., 2017; Sahin et al., 2018). Only one study reported a significant decrease in CRP values in non-pregnant women before embryo implantation (Arefi et al., 2010), but this study had the lowest NOS score (i.e. 3/10) and did not provide a definition of pregnancy. Moreover, the results of the study of Arefi et al. (2010) were weakened also by the absence of information on the women’s BMI. Indeed BMI positively influences circulating CRP concentration in women undergoing ART (Wunder et al., 2005; Levin et al., 2007; Robinson et al., 2008; Yildizfer et al., 2015; Buyuk et al., 2017).
The other studies included in the systematic review also have limitations. Only a minority of studies reported the predictive value of circulating CRP concentration on ART outcomes, with the appropriate information on cut-offs, sensitivity, specificity and positive and negative predictive values (Almagor et al., 2004; Buyuk et al., 2017). Moreover, most studies found either normal (i.e. <2 mg/L) (Sacks et al., 2004; Wunder et al., 2005; Robinson et al., 2008; Tasdemir et al., 2015; Buyuk et al., 2017) or high baseline CRP concentrations (i.e. between 2 and 10 mg/L, reflecting low-grade inflammation) (Arefi et al., 2010; Seckin et al., 2012) in both pregnant and non-pregnant groups, thus potentially preventing the observation of a significant influence on ART outcomes. The small number of patients (Tasdemir et al., 2015; Sahin et al., 2018) and/or the high number of excluded patients (Almagor et al., 2004) also limited the statistical power of the studies. Particularly, the number of women who achieved pregnancy was very low in two studies (Tasdemir et al., 2015; Yildizfer et al., 2015). Moreover, the available studies evaluated ART outcomes using heterogeneous primary endpoints (i.e. biochemical or clinical pregnancy rates). In addition, these endpoints are insufficient because the goal of ART is the birth of a healthy child. To date, no study evaluated the association between circulating CRP concentrations and live birth rates in women undergoing ART. Importantly, many clinical parameters were missing or were significantly different between the pregnant and non-pregnant groups, although they strongly influence CRP values or IVF outcomes. For instance, women’s age is strongly associated with pregnancy rates, due to less responsive ovaries and/or altered oocyte quality in older women (American College of et al., 2014; Crawford & Steiner, 2015). Hence, female age is a confounding variable for ART outcomes because it is highly associated with the biochemical and clinical pregnancy rates (Artini et al., 2018). In five studies (Sacks et al., 2004; Wunder et al., 2005; Tasdemir et al., 2015; Buyuk et al., 2017; Sahin et al., 2018), women who became pregnant had lower circulating CRP values; however, they were significantly younger than those who did not. This suggests that the differences in pregnancy rates could have been influenced by age rather than CRP values. Women’s age was missing in one study (Robinson et al., 2008). Therefore, the authors could not take into account the influence of age in their analysis, undermining the data interpretation. Another confounding variable was BMI that is highly associated with serum CRP concentrations (Ford, 1999; Visser et al., 1999; Yudkin et al., 1999; Festa et al., 2001; Rexrode et al., 2003; Wunder et al., 2005; Thorand et al., 2006; Levin et al., 2007; Robinson et al., 2008; Ertas et al., 2010; Yildizfer et al., 2015; Buyuk et al., 2017). Yet, BMI was not given in 20.0% (2/10) of studies (Almagor et al., 2004; Arefi et al., 2010). Pregnancy rates are also strongly influenced by several ART parameters. For instance, the number and quality of inseminated spermatozoa were missing in 50.0% (1/2) of studies on IUI (Sahin et al., 2018). Moreover, the number and quality of transferred embryo(s) strongly influence pregnancy rates. Yet, the number of transferred embryo was missing in 30.0% (3/10) of studies (Almagor et al., 2004; Robinson et al., 2008; Buyuk et al., 2017), and their quality was never mentioned. Many factors associated with COH and/or ovarian puncture also may affect CRP values, thus representing potential sources of bias and cofounding factors. Recent studies reported that COH is associated with an increase in inflammatory cytokines, such as CRP (Orvieto et al., 2004; Orvieto et al., 2005; Wunder et al., 2005; Orvieto et al., 2006; Orvieto et al., 2007; Arefi et al., 2010; Korhonen et al., 2016). The effect of the high doses of gonadotropins used in IVF on inflammatory and oxidative stress markers is currently unclear. Moreover, additional studies are needed to determine whether gonadotrophins directly affect CRP secretion. For instance, the impact of FSH on CRP production is unknown. A recent study reported the upregulation of inflammation-related genes (i.e. genes involved in prostaglandin synthesis, interleukin (IL) signaling and immune cell trafficking) in human granulosa cells among women undergoing COH at the time of hCG trigger (Wissing et al., 2014). Replacing hCG with GnRH agonists for the final ovarian maturation results in a lower degree of systemic inflammation (Orvieto et al., 2006). Therefore, the molecule(s) and dose of gonadotrophins used for COH may influence circulating CRP concentration, representing a potential bias in the published studies. Finally, no or few data were available on ongoing infection/trauma and on the intake of anti-inflammatory drugs (e.g. ibuprofen and acetaminophen) in the selected studies, despite their effect on CRP values. Altogether, the high level of incomplete data among studies strongly undermines their strength. It may also explain the result discrepancy and the failure to reach statistical significance in some comparisons between women who did and did not achieve pregnancy. Well-designed large-scale studies are required to evaluate the predictive value of CRP quantification in ART outcomes. Importantly, analyses should be adjusted for the major variables that influence CRP and/or ART outcomes (e.g. maternal age, BMI, number of transferred embryos, use of anti-inflammatory drugs).
Despite these limitations, the association between high circulating CRP levels before embryo implantation and poor reproductive outcomes is consistent with the decreased fertility observed in women with high preconception CRP levels (≥1.95 mg/L) (Sjaarda et al., 2017). Moreover, elevated CRP values have been reported in women with reproductive disorders, including PCOS (Kelly et al., 2001; Escobar-Morreale, Luque-Ramirez, & Gonzalez, 2011; Agacayak et al., 2015; Kahyaoglu et al., 2017), OHSS (Orvieto, 2004; Sacks et al., 2004; Levin et al., 2005; Korhonen et al., 2016) and endometriosis (Kianpour et al., 2012). The association between increased inflammation and poor reproductive outcomes has been corroborated using other circulating inflammatory factors. For instance, Persson and colleagues reported higher IL-5 secretion by peripheral blood mononuclear cells at ovarian puncture time in women who did not become pregnant after IVF compared with women who did (Persson et al., 2012).
Altogether, these findings suggest a detrimental impact of high circulating CRP during preconception on oocyte competence, embryo development and/or endometrial receptivity (Fig. 3B). Previous studies suggested that high circulating CRP concentrations have a negative effect on folliculogenesis. For instance, Lorenz et al. reported significantly higher CRP values during the early follicular phase in anovulatory cycles compared with ovulatory cycles (Lorenz et al., 2015). Moreover, Buyuk and colleagues found that the CRP cut-off value to predict IVF outcome was lower and with better sensitivity and specificity in women with diminished ovarian than for women with normal ovarian reserve before COH (Buyuk et al., 2017). Other studies reported the association between poor folliculogenesis and increased expression of other inflammatory markers. For instance, increased serum resistin levels and intrafollicular TNF-α levels are negatively associated with the number (Chen et al., 2007) and quality (Lee et al., 2000) of oocytes in women undergoing IVF. The exact role of CRP in impaired folliculogenesis remains to be characterized in women undergoing ART. CRP concentration seems slightly higher in serum compared with follicular fluid on ovarian puncture day (Orvieto et al., 2004; Wunder et al., 2005; Haikin Herzberger et al., 2019). Moreover, CRP concentrations in serum and follicular fluid are strongly correlated (Wunder et al., 2005; Haikin Herzberger et al., 2019), suggesting that CRP quantification in serum may be a surrogate marker of follicular fluid level CRP during COH. To date, no data on CRP production by cultured ovarian cells has been reported. Future studies on the impact of follicular fluid CRP on oocyte competence could be useful to help determine the role of CRP in human folliculogenesis/oogenesis.
Concerning the impact of CRP on embryo development, a recent finding reported that high serum CRP levels (≥5 mg/L) on ovarian puncture day were significantly associated with low embryo quality (Haikin Herzberger et al., 2019), suggesting a detrimental impact of circulating CRP on oocyte competence and early embryo development. Radin et al. found that high preconception serum CRP levels preferentially affect male embryo implantation and/or development in humans (Radin et al., 2015), corroborating the detrimental effect of maternal inflammation on male embryos observed in animal models (Perez-Crespo et al., 2005; Dobbs et al., 2014). Interestingly, low-dose aspirin treatment reduces circulating CRP in women with high CRP levels (≥1.95 mg/L), restoring the normal offspring sex ratio (Radin et al., 2015).
The association between high circulating preconception CRP and poor ART outcomes could also result from a detrimental CRP effect on endometrial receptivity. It has been suggested that an excessive inflammatory response in decidual cells reduces the window of receptivity (Macklon & Brosens, 2014), increasing conception delay and favoring recurrent implantation failure after IVF. Moreover, low-grade inflammation might be a cause of implantation failure of chromosomally normal embryos (Macklon & Brosens, 2014).
On the other hand, high circulating CRP values appear to be positively associated with pregnancy after embryo implantation (Sacks et al., 2004) (Fig. 3). This result is in agreement with the data (reviewed in Granot et al., 2012) on the presence of local and systemic pro-inflammatory signals during early pregnancy. Indeed, a gradient of chemokines and cytokines is produced by endometrial cells to guide the blastocyst to the implantation site (Granot et al., 2012). Moreover, the growing embryo secretes IL-1 that promotes CRP production (Pepys & Hirschfield, 2003). Pro-inflammatory cytokines, such as IL-6, leukemia inhibitory factor, IL-8 and TNF-α, also participate in endometrial remodeling and in the recruitment of immune cells into the decidua (Granot et al., 2012), indicating the presence of an inflammatory state during the early stages of implantation. Likewise, Persson and colleagues reported higher IL-4, IL-5 and IL-13 secretion from peripheral blood mononuclear cells at Week 4 after embryo transfer (Persson et al., 2012). Moreover, CRP significantly increases throughout pregnancy from the first to the third trimester (Rebelo, Carvalho-Guerra, Pereira-Leite, & Quintanilha, 1995; Teran et al., 2001). One can speculate that CRP concentration reduction during the peri-implantation period is detrimental for the establishment of early pregnancy (Fig. 3B). Intriguingly, several studies found similar CRP values during the post-implantation period in women who did and did not achieve pregnancy after ART (Almagor et al., 2004; Seckin et al., 2012; Yildizfer et al., 2015). The limited inflammatory process at the implantation site at Week 4 of gestation might not be able to significantly influence the concentration of circulating inflammation markers, thus explaining this observation. Indeed, blastocyst adhesion to the receptive endometrium takes place ~6–7 days after ovulation trigger, but the connection between the invading blastocyst and maternal vessels only begins ~8–9 days after ovulation trigger (Lohstroh et al., 2005). Therefore, it is thought that the molecular signals associated with embryo implantation appear in the maternal circulation at Days 8–9 after ovulation trigger. Consequently, CRP levels might significantly increase only later during pregnancy (e.g. at 6–8 weeks of gestation).
Clinical benefits and limitations of CRP quantification for predicting ART outcomes
The validation of predictive biomarkers that can guide treatment options is necessary to improve ART outcomes. The quantification of serum CRP before starting COH seems particularly promising for predicting the likelihood of achieving a pregnancy. Moreover, the detection of high CRP concentration in women before COH could help to identify low-prognosis ART cycles, guiding towards IVF cycle cancellation to minimize the medical risks and costs as well as the psychological burden. CRP quantification has already been proposed for the prediction of pregnancy pathologies, such as pregnancy loss (Ahmed et al., 2015), gestational diabetes (Wolf et al., 2003), pre-eclampsia (Teran et al., 2001; Wolf et al., 2001; Thilaganathan et al. 2010; Tjoa et al. 2003), intrauterine growth restriction (Tjoa et al., 2003), preterm delivery (Hvilsom et al., 2002; Lohsoonthorn, Qiu, & Williams, 2007) and premature rupture of membranes complicated by chorioamnionitis (Yoon et al., 1996). Altogether, the available data suggest that CRP could represent a useful biomarker for the personalized management of patients undergoing ART. Indeed, CRP is an attractive screening tool because its quantification is highly sensitive, simple, inexpensive, rapid and relatively standardized. Currently, hsCRP displays the most suitable characteristics for routine clinical use among all identified inflammatory markers (Pearson et al., 2003). The nephelometric assay was the first method approved by the US Food and Drug Administration for assessing low-grade inflammation (Roberts et al., 2001). Immunoturbidimetry-based assays are the most commonly used methods in clinical settings. Both technologies usually allow detecting CRP with a sensitivity (i.e. limit of quantification) of ~1 mg/L (Vashist et al., 2016). Moreover, fasting before sampling may be needed in assays that depend on optical clarity, such as turbidimetry and nephelometry (Myers et al., 2004). High-sensitivity methods are required for the quantification of low levels of CRP. Clinically accredited or in-house ELISA kits display sensitivities of 10−9 mg/L, although they may lack adequate standardization (Vashist et al., 2016). In a previous study, all the most commonly used methods were standardized using a unique international standard (IFCC Certified Reference Material 470 standard) (Roberts et al., 2001), and hsCRP concentrations measured by ELISA assay, immunoturbidimetric and nephelemetric automated methods were comparable (Rifai, Tracy, & Ridker, 1999; Roberts et al., 2001). However, further standardization efforts and stringent calibration are still required to ensure high reproducibility (Wu et al., 2017). Moreover, the appropriate CRP cut-off still needs to be determined to predict the success or failure of embryo implantation. Some studies reported very different CRP reference values: <3 mg/L (Korhonen et al., 2016), <5 mg/L (Almagor et al., 2004; Orvieto et al., 2004; Orvieto et al., 2006) or even <50 mg/L (Kahyaoglu et al., 2017). Several studies did not mention any reference value (Levin et al., 2007; Robinson et al., 2008; Liu et al., 2014; Yildizfer et al., 2015). Altogether, the limited data on CRP levels in women undergoing ART do not allow the normal CRP reference ranges in this population to be established. For clinical use, hsCRP tests should be preferred to detect low circulating levels of CRP (0.5–10 mg/L), indicative of low-grade inflammation (Ansar & Ghosh, 2013). Obviously, CRP should be measured in the absence of ongoing inflammatory conditions to reflect the baseline systemic environment. Importantly, CRP test results can vary among laboratories. Therefore, serial CRP assessments should be performed by a single laboratory to minimize errors. Moreover, two measurements using a hsCRP assay (optimally 2 weeks apart) are recommended to increase the result reliability (Myers et al., 2004). CRP levels are stable, without circadian variation (Meier-Ewert et al., 2001), allowing its detection at any time of the day.
CRP-lowering therapeutic options and ART outcomes
Circulating CRP concentration is influenced by genetic and environmental factors. For example, CRP concentrations are more similar in monozygotic twins than in dizygotic twins (MacGregor, Gallimore, Spector, & Pepys, 2004), and adiposity strongly influences CRP values in monozygotic twins (Greenfield et al., 2004). Modification of environmental factors, such as lifestyle factors (e.g. weight loss, specific dietary patterns and physical activity), and pharmacological treatments (e.g. low-dose aspirin, steroids and tamoxifen) can lower the circulating CRP concentration and might improve reproductive outcomes (Table V).
CRP-lowering environmental factors and drugs and their impact on human fertility.
| CRP-lowering environmental factors and drugs | Impact on fertility | References | |
|---|---|---|---|
| Mutsaerts et al., 2016 | |||
| ↑ spontaneous PR in infertile patients | Einarsson et al., 2017 | ||
| Best et al., 2017 | |||
| Espinos et al., 2017 | |||
| Weight loss | ↑ PR and LBR in women with obesity undergoing IVF | Sim et al., 2014 | |
| ↓ TTP in women with obesity undergoing IVF | Sim et al., 2014 | ||
| ↓ risk of ovulatory disorders | Chavarro et al., 2007 | ||
| Environmental factors | ↑ number of retrieved oocytes in women with overweight/obesity during IVF | Becker et al., 2015 | |
| ↑ fertilization rates in women undergoing IVF | Gaskins et al., 2014 | ||
| Diet patterns | ↓ cycle failure in women undergoing IVF | Gaskins et al., 2014 | |
| Gaskins et al., 2015 | |||
| ↑ PR and LBR in women undergoing IVF | Moran et al., 2016 | ||
| Gaskins et al., 2016 | |||
| Physical activity | ↑ spontaneous fecundability in women attempting pregnancy | McKinnon et al., 2016 | |
| ↓ spontaneous TTP in women with overweight/obesity | Wise et al., 2012 | ||
| ↑ pregnancy and live birth rates in women with obesity undergoing IVF | Palomba et al., 2014 | ||
| ↑ spontaneous PR and LBR in lean women with low-grade inflammation | Levine et al., 2019 | ||
| Low-dose aspirin | ↓ spontaneous TTP in women attempting pregnancy | Levine et al., 2019 | |
| ↓ pregnancy loss in women undergoing IVF | Shirlow et al., 2017 | ||
| Steroids | ↑ LBR in women undergoing IVF | Shirlow et al., 2017 | |
| ↑ ovulation in women with PCOS undergoing ovulation induction | Morley et al., 2017 | ||
| Drugs | Metformin | ↑ PR in women with PCOS undergoing ovulation induction | Morley et al., 2017 |
| ↑ PR in women with thin endometrium and undergoing IUI | Wang et al., 2017 | ||
| Tamoxifen | ↓ early pregnancy loss in women with a thin endometrium and undergoing IUI | Wang et al., 2017 | |
| Manheimer et al., 2013 | |||
| Acupuncture | ↑ PR and LBR in women undergoing IVF | Hullender Rubin et al., 2018 | |
PR: pregnancy rate; LBR: live birth rate; TTP: time to pregnancy; PCOS: polycystic ovary syndrome.
Lifestyle factors
Weight loss is associated with decreased circulating levels of inflammatory markers, including CRP (Tchernof, Nolan, Sites, Ades, & Poehlman, 2002; Forsythe, Wallace, & Livingstone, 2008; Christiansen, Paulsen, Bruun, Pedersen, & Richelsen, 2010; Varady et al., 2013; Goldberg, Temprosa, Mather, Orchard, & Kitabchi, 2014; Bianchi, 2018), and also with higher cumulative ovulation rates in women with PCOS (Legro et al., 2015), higher pregnancy rates in infertile couples (Best, Avenell, & Bhattacharya, 2017) and higher spontaneous live birth rates in women using ART (Mutsaerts et al., 2016; Einarsson et al., 2017). Moreover, weight loss also significantly increases clinical pregnancy rates, cumulative live birth rates and the number of live births, while it significantly decreases the time to pregnancy in women with obesity undergoing IVF (Sim, Dezarnaulds, Denyer, Skilton, & Caterson, 2014; Espinos et al., 2017). On the other hand, increasing evidence indicates that dietary patterns affect circulating CRP and reproductive function, irrespectively of weight loss (Kermack & Macklon, 2015). Circulating CRP values can be decreased by lower glycemic index diets (Gaskins et al., 2010; Buyken et al., 2014), higher fiber intake (Ajani, Ford, & Mokdad, 2004), vegan diets (Sutliffe, Wilson, de Heer, Foster, & Carnot, 2015), Mediterranean-style diets (Esposito et al., 2004), ginseng supplementation (Saboori, Falahi, Yousefi Rad, Asbaghi, & Khosroshahi, 2019) and antioxidant supplementation (multivitamin, vitamins E or C, beta carotene) (Colbert et al., 2004). It has been shown that several dietary patterns (e.g. vegetarian diets, low-fat and low glycemic index diets, intake of folate or antioxidants) improve reproductive outcomes (McLean & Wellons, 2012, Practice Committee of the American Society for Reproductive Medicine in collaboration with the Society for Reproductive et al., 2017)), by decreasing the risk of ovulatory disorders (Chavarro, Rich-Edwards, Rosner, & Willett, 2007) and increasing the number of retrieved oocytes (Becker, Passos, & Moulin, 2015), the IVF fertilization rates (Gaskins et al., 2014), the pregnancy rates after IVF (Moran, Tsagareli, Noakes, & Norman, 2016) and the live birth rates (Gaskins et al., 2015; Gaskins et al., 2016), while reducing IVF cycle failure (Gaskins et al., 2014). Physical activity also significantly decreases CRP concentrations (Aronson et al., 2004; Colbert et al., 2004). Interestingly, physical activity is associated with improved fertility, including in women with overweight and obesity (Wise et al., 2012; McKinnon et al., 2016). Moreover, physical activity significantly increases pregnancy and live birth rates in women with obesity undergoing IVF, irrespective of body weight loss (Palomba et al., 2014). The combination of different lifestyle factors synergistically results in higher reproductive outcomes (Chavarro et al., 2007).
CRP-lowering drugs
Several CRP-lowering drugs have shown beneficial effects on spontaneous fertility or ART outcomes. Here, only drugs with a proven effect on the reduction of circulating CRP and associated with a beneficial effect on early conception in women will be presented. Recent studies revealed that low-dose aspirin treatment significantly decreases CRP levels in women with high baseline CRP levels (≥1.95 mg/L), but not in women with low baseline CRP values (Sjaarda et al., 2017). Moreover, preconception low-dose aspirin treatment significantly improves spontaneous clinical pregnancy and live birth rates only in lean women (BMI ≤25 kg/m2) with high baseline CRP (≥1.95 mg/L) (Sjaarda et al., 2017). The most recent meta-analysis reported that in women with undocumented inflammation status, low-dose aspirin significantly improves clinical pregnancy rate in IVF/ICSI cycles compared with placebo or no treatment, but not the implantation or live birth rates (Wang et al., 2017). This increase in clinical pregnancy rate might be the result of ovarian and endometrial effects of low-dose aspirin. Indeed, low-dose aspirin significantly improves ovarian folliculogenesis (Rubinstein, Marazzi, & de Fried, 1999; Wang et al., 2017) and oocyte competence (Rubinstein et al., 1999), probably by promoting follicular vascularization (Rubinstein et al., 1999). Therefore, preconception low-dose aspirin treatment may optimize the vascular distribution of gonadotropins and other growth factors in growing ovarian follicles and consequently improve oocyte maturation and embryo implantation. Moreover, low-dose aspirin treatment significantly improves endometrial receptivity (Rubinstein et al., 1999; Hsieh, Tsai, Chang, Lo, & Chen, 2000). Steroid treatment also reduces CRP levels in different inflammatory states (Sin, Lacy, York, & Man, 2004) and significantly decreases clinical pregnancy loss and improves live birth rates in women undergoing IVF (Shirlow, Healey, Volovsky, MacLachlan, & Vollenhoven, 2017). Metformin significantly decreases CRP levels in lean and overweight women with PCOS (Chen et al., 2017) and significantly improves ovulation and clinical pregnancy rates compared with placebo (Morley, Tang, Yasmin, Norman, & Balen, 2017). Acupuncture also significantly decreases CRP values (Attia et al., 2016) and may increase clinical pregnancy and live birth rates (Hullender Rubin, Anderson, & Craig, 2018). Manheimer and colleagues suggested that acupuncture has stronger effects in women with lower baseline pregnancy rates during ART (Manheimer et al., 2013). Additional clinical studies are needed to assess the relationship between CRP-lowering drugs and ART outcomes.
All these innovative approaches may contribute to the normalization of low-grade inflammation, thus increasing the clinical pregnancy and live birth rates. Importantly, the most appropriate time to start CRP-lowering therapies (e.g. before or during ART cycles) and their duration must be carefully determined. For example, postponing fertility treatment for weight loss may be detrimental due to the risk associated with age-related fertility decline (Sabounchi, Hovmand, Osgood, Dyck, & Jungheim, 2014; Tremellen, Wilkinson, & Savulescu, 2017). Moreover, the local inflammatory response is an important feature during the earliest phases of pregnancy. Therefore, one can speculate that CRP-lowering treatments should be initiated before the start of COH. Once CRP values are normalized, CRP-lowering drugs should be stopped before starting the ART cycle. Indeed, no beneficial effect was observed when low-dose aspirin treatment was initiated after conception or during early pregnancy (Di Nisio et al., 2005).
In addition, preconception BMI and CRP levels seem to modify significantly the efficacy of CRP-lowering drugs (Sjaarda et al., 2017). This is consistent with data showing that CRP-lowering environmental factors do not improve markers of inflammation in healthy individuals (Villalba et al., 2019). Altogether, these results suggest that these therapeutic strategies might be more beneficial in women with low-grade inflammation. Future larger and properly powered studies with adequate sample sizes and methodology should focus on the effects of CRP-lowering environmental factors and drugs on IVF outcomes in women with low-grade inflammation to confirm these preliminary findings. In particular, future studies should include both preconception basal CRP level and BMI to evaluate the clinical usefulness of CRP quantification and of preconception therapeutic options in the management of women undergoing ART. CRP quantification before ART may identify subgroups of patients who might benefit from CRP-lowering environmental factors and drugs. Until then, clinicians should recommend a healthy lifestyle. Indeed, all patients should be given clear information about preconception health, including advice about lifestyle factors (Lane, Robker, & Robertson, 2014; Norman, 2015). As dropouts are common in lifestyle improvement programs (Mutsaerts, Kuchenbecker, Mol, Land, & Hoek, 2013), additional emotional support and encouragement are highly recommended. Conversely, clinicians should not endorse taking unproven and unnecessary pharmacological compounds that may have no beneficial effect on ART success rate. Indeed, the mechanisms by which these drugs decrease CRP values and improve ART outcomes remain unclear. Although CRP is already considered a clinically useful biomarker in other pathologies (e.g. infection/trauma and cardiovascular risk), most mechanistic studies suggest that CRP represents a downstream surrogate marker and not a target on its own (Ridker, 2016). Consequently, CRP quantification before and after ART treatment was not performed in most studies; therefore, the improvement of pregnancy and/or live birth rates cannot be directly attributed to the reduced inflammatory state.
Conclusion
The value of CRP quantification as a predictive marker of ART outcome needs to be better investigated in large prospective studies that take into account the main parameters influencing CRP concentration and ART outcomes (e.g. women’s age and BMI, number of transferred embryo(s)). If future high-quality studies confirm the negative association between circulating CRP during preconception and ART outcomes, the quantification of circulating CRP before ART could help physicians to predict poor cycles, thus contributing to improve decision-making concerning the cancellation of an ART cycle and the initiation of prophylactic therapy to reduce systemic low-grade inflammation.
Acknowledgements
We warmly thank Elisabeth Andermarcher for her help in formulating this manuscript in English.
Authors’ roles
Study design (S.B., G.B., M.A., S.H.), execution (S.B., G.B., M.A., S.H.), analysis (S.B., G.B., M.A., S.H.), manuscript drafting (S.B., G.B., M.A., B.D.B., A.G., A.F.-H., I.T., S.H.) and critical discussion (S.B., G.B., M.A., B.D.B., A.G., A.F.-H., I.T., S.H.).
Funding
AMROG; Université de Montpellier; Université Grenoble-Alpes.
Conflict of interest
The authors declare no conflict of interest.
References
American College of, O., P. Gynecologists Committee on Gynecologic and C. Practice.
Practice Committee of the American Society for Reproductive.
Practice Committee of the American Society for Reproductive Medicine in collaboration with the Society for Reproductive, E., A. a. o. Infertility. Electronic address, E.
