


Abstract
Chronic inflammation is linked to increased cardiovascular risk. Inflammatory bowel disease (IBD) is characterized by chronic inflammation of the gastrointestinal tract and elevated pro-inflammatory markers. The association between IBD and myocardial infarction (MI) is not well understood. We sought to elucidate this risk using a large database.
We reviewed data from a large commercial database (Explorys, IBM Watson) that aggregates electronic medical records from 26 nationwide health care systems. Using systemized nomenclature of medicine-clinical terms, we identified adult patients (20 to 65 years) with a diagnosis of IBD—ulcerative colitis (UC) or Crohn’s disease (CD)—who had active records between August 2013 and August 2018. We then examined the risk of MI in patients with or without IBD.
Out of 29,090,220 patients, 131,680 (0.45%) had UC, and 158,750 (0.55%) had CD. Prevalence of MI was higher in patients with UC and CD versus non-IBD patients (UC 6.7% vs CD 8.8% vs non-IBD 3.3%, odds ratio [OR] for UC 2.09 [2.04 -2.13], and CD 2.79 [2.74–2.85]. The odds of MI in IBD patients overall were highest in younger patients and decreased with age (age 30–34 years: OR 12.05 [11.16–13.01], age 65+ years: OR 2.08 [2.04–2.11]). After adjusting for age, race, sex, and traditional cardiovascular risk factor, IBD conferred greater odds of MI (adjusted odds ratio [aOR] 1.25 [1.24–1.27]).
In this large cohort, IBD is associated with significantly increased MI compared with non-IBD patients. The relative risk of MI was highest in younger patients and decreased with age. These findings emphasize the need for aggressive risk factor reduction in IBD.
INTRODUCTION
Inflammation has long been recognized as a key factor in the pathogenesis of cardiovascular disease (CVD), and pro-inflammatory markers such as C-reactive protein (CRP) have a well-established association with the development of coronary artery disease.1–3
Chronic inflammatory diseases, such as rheumatoid arthritis (RA) and systemic lupus erythematosus (SLE), have been associated with higher risk of atherosclerosis and arterial thromboembolic disease (including myocardial infarction [MI] and stroke).4, 5 Inflammatory bowel disease (IBD), comprised of ulcerative colitis (UC) and Crohn’s disease (CD), is characterized by chronic inflammation of the gastrointestinal tract and elevated pro-inflammatory markers.6 Inflammatory bowel disease mainly affects the gastrointestinal tract but is also known to have extraintestinal complications due to persistent long-standing systemic inflammation.7 About 3 million Americans have IBD, with about 70,000 new cases being diagnosed per year.8
Although IBD has been shown to be associated with an increased risk of venous thromboembolism (VTE),9 its association with coronary artery disease and arterial thromboembolism is less understood. Research in this area has yielded contradictory findings. A 2007 systematic review found that IBD was not associated with increased cardiovascular mortality.10 However, subsequent studies found an increased risk of arterial thromboembolic events in IBD patients, including myocardial infarction.11–14 In addition, Aggarwal et al in a 2014 study showed that patients with IBD had earlier onset of CVD than non-IBD patients.15 In contrast, more recent work in 2016 by Barnes et al utilizing the National Inpatient Sample showed no increased risk of MI in patients with IBD.16
Given the lack of consensus on this important issue, the large number of patients affected by IBD, the potential impact of increased cardiovascular risk in this population, and the ambiguity of data around this question, we sought to further investigate the association between IBD and the risk of myocardial infarction (MI).
METHODS
Study Design
We performed a retrospective analysis of a large electronic medical record (EMR)–based commercial database called Explorys (IBM Watson). Established in 2009, Explorys aggregates both inpatient and outpatient EMR data from 26 major integrated health care systems spread over 50 states in the United States beginning in 1999 until the present date, with over 50 million unique patient records.17 Each participating institution contributes de-identified data from electronic health records, billing records, and laboratory records. This data is then standardized, normalized, and stored in a cloud-based database. Explorys uses standard medical ontologies such as the Systematized Nomenclature of Medicine Clinical Terms (SNOMED CT) for medical diagnoses and procedures, RxNorm for medications, and logical observation identifier names and codes (LOINC) for laboratory values. For diagnoses, International Classification of Disease, Ninth Revision, Clinical Modification (ICD-9-CM) codes are mapped into the SNOMED-CT hierarchy. The Explorys platform allows investigators to generate cohorts based on presence of absence of SNOMED-CT diagnoses on patient electronic medical records. Cohorts can be further refined demographically (eg, age, gender, insurance status, and race) and also allow for identification of comorbidities. More details about the back end of Explorys are published elsewhere.18
Use of the Explorys platform has been validated in multiple fields including hematology,18 cardiology,19 and gastroenterology.20 Explorys is a Health Insurance Portability and Accountability Act (HIPAA)–compliant platform utilizing de-identified EMR data, and studies arising from Explorys platform were deemed exempt by the University Hospitals Institutional Review Board.
To protect patient confidentiality, Explorys rounds population counts to the nearest 10 and treats all counts between zero and 10 as equivalent. For the purposes of this study, counts listed between zero and 10 were approximated to be five.
Patient Selection
For this study, we used the Explorys search tool to identify all non-deceased adult patients (20 years or older) with active records over the last five years (August 2013 to August 2018). Patients with UC were identified by searching the database for cases with listed SNOMED-CT diagnoses for UC (search term: “ulcerative colitis”). Similarly, patients with CD were identified using listed diagnoses for CD (search term: “Crohn’s disease”). We also searched for alternative diagnoses for each condition using the odds ratio (OR) operand to capture as many patients as possible (see Supplementary Table S1 for the complete list of SNOMED-CT codes used). We excluded patients who had diagnoses for both UC and CD. Patients with MI were identified as those with presence of SNOMED-CT diagnoses “myocardial infarction” or “acute myocardial infarction.” Controls were defined as non-IBD patients (ie, those without diagnoses of either UC or CD). For our analyses, we identified cohorts of patients with UC or CD with and without MI. We were unable to perform propensity-score matching because the Explorys platform only provides population-level data and not individual cases.
To increase the internal validity of our results, we also repeated the analyses in active patients within the last three years and within the last year. In an indirect way to assess the validity and diagnostic accuracy of our selected SNOMED-CT terms for UC, CD, MI, and comorbidities, we converted their respective SNOMED-CT terms to equivalent ICD-9-CM codes (Supplementary Table S1). These ICD-9-CM codes have been utilized in prior studies using administrative data to identify their respective conditions, including MI.8, 21, 22 This was especially important for the diagnosis of MI in our population because the Explorys platform does not provide electrocardiographic data or troponin values to confirm diagnosis of MI.
Covariates
We collected information on patient demographics such as age (20–65 years, in increments of five year groups), sex, and ethnicity (Caucasian or non-Caucasian). We also collected data on comorbidities known to be associated with increased risk of CVD and MI (eg, hypertension, diabetes mellitus, dyslipidemia, obesity, and smoking)23 by searching the database for their respective SNOMED-CT terms (see Supplementary Table S1 for the complete list).
Statistical Analysis
Patients with UC and CD were compared with each other and with non-IBD patients. We separately compared age-matched and age- and gender-matched patients within each group. To assess the change in risk of MI in patients with age, we divided patients into age groups based on five-year age intervals (20–24, 25–29 and so on, and then 65+). This was repeated in the male and female cohorts.
The five-year prevalence of MI in IBD patients was calculated by dividing the number of patients with IBD who had MI by the number of patients at risk (all patients with IBD), and this was similarly done for non-IBD patients. This was repeated for the three-year and one-year.
Categorical variables are presented as numbers and percentages and were compared using the Pearson χ2 test. Odds ratios are presented with 95% confidence intervals (CI). To adjust for possible confounding from the covariates listed previously, a multivariable model adjusting for all covariates listed in Table 1 was constructed using binary logistic regression using MI as the dependent variable. Independence among covariate risk factors was assessed using the variance inflating factor (VIF) with cutoff of significant collinearity set at VIF > 1.5. “Goodness-of-fit” was assessed for all regression models using the Hosmer-Lemeshow test, with P > 0.05 indicating good fit. All interactions were tested. For all analyses, a 2-sided P value of <0.05 was considered statistically significant. All statistical analysis was performed using Statistical Package for Social Sciences (SPSS version 25, IBM Corp).
Baseline Characteristics of Study Population
| Ulcerative Colitis (UC)(N = 131,680) | Crohn’s Disease (CD) (N = 158,750) | Non-IBD (N = 28,799,790) | P value for UC vs CD | P for UC vs Non-IBD | P for CD vs Non-IBD | |
|---|---|---|---|---|---|---|
| Age, years | ||||||
| 20–24 | 4,940 (3.8) | 7,830 (4.9) | 2,037,410 (7.1) | |||
| 25–29 | 8,060 (6.1) | 12,570 (7.9) | 2,403,300 (8.3) | |||
| 30–34 | 9,850 (7.5) | 13,990 (8.8) | 2,344,940 (8.1) | |||
| 35–39 | 10,340 (7.9) | 14,240 (9.0) | 2,298,700 (8.0) | 0.08 | ||
| 40–44 | 8,850 (6.7) | 12,050 (7.6) | 2,076,170 (7.2) | |||
| 45–49 | 9,600 (7.3) | 12,370 (7.8) | 2,218,890 (7.7) | 0.19 | ||
| 50–54 | 10,080 (7.7) | 12,470 (7.9) | 2,306,480 (8) | 0.05 | 0.03 | |
| 55–59 | 11,930 (9.1) | 13,820 (8.7) | 2,553,850 (8.9) | 0.001 | 0.01 | 0.01 |
| 60–64 | 12,310 (9.3) | 13,700 (8.6) | 2,472,570 (8.6) | 0.53 | ||
| 65+ | 45,720 (34.7) | 45,710 (28.8) | 8,087,480 (28.1) | |||
| Female | 78,200 (59.3) | 96,510 (60.8) | 16,241,610 (56.4) | |||
| Race | ||||||
| Caucasian | 129,470 (83.3) | 96,510 (82.1) | 18,766,020 (64.8) | |||
| Non-Caucasian | 21,790 (16.7) | 28,210 (17.9) | 10,192,820 (35.2) | |||
| Comorbidities | ||||||
| Dyslipidemia | 51,890 (28.8) | 53,180 (26.0) | 7,142,120 (19.8) | |||
| Hypertension | 63,160 (49.3) | 70,090 (46.4) | 8,467,000 (29.3) | |||
| Diabetes Mellitus | 30,460 (23.8) | 34,810 (23.0) | 3,423,900 (11.9) | |||
| Obesity | 29,650 (23.2) | 33,070 (21.9) | 3,229,990 (11.2) | |||
| Smoking | 36,310 (28.4) | 48,190 (31.9) | 4,941,250 (17.1) |
Numbers are n (%). All P values are<0.0001 unless stated otherwise.
RESULTS
Out of 29,090,220 patients active in the database between August 2013 and August 2018, 131,680 (0.45%) had UC, and 158,750 (0.55%) had CD, with overall prevalence of IBD being 1.0%. Baseline characteristics are displayed in Table 1. Results of analyses from data limited to the last three years and the last year were consistent with our five-year data and are displayed in Supplementary Table S2.
Patients with either UC or CD were less likely to be younger (20–65 years old: UC 65.3%, OR 0.73 [0.71–0.74], and CD 71.2%, OR 0.97 [0.96–0.98], P < 0.0001, vs non-IBD 71.9%) and more likely to be female (UC 59.3%, OR 1.13 [1.12–1.14], and CD 60.8%, OR 2.01 [1.99–2.03], vs non-IBD 56.4%) or Caucasian (UC 83.3%, OR 2.70 [2.67–2.75], and CD 82.1%, OR 2.49 [2.46–2.53], vs non-IBD 64.8%) compared with patients without IBD (Table 1).
Common cardiovascular risk factors were more prevalent in individuals with either UC or CD compared with those without IBD: dyslipidemia (UC 28.8%, OR 1.64 [1.62–1.66], vs CD 26.0%, OR 1.42 [1.41–1.44], vs non-IBD 19.8%), hypertension (UC 49.3%, OR 2.35 [2.32–2.37], vs CD 46.4%, OR 2.09 [2.07–2.11], vs controls 29.3%), diabetes (UC 23.8%, OR 2.32 [2.29–2.35], vs CD 23.0%, OR 2.23 [2.19–2.25], vs non-IBD 11.9%), obesity (UC 23.2%, OR 2.39 [2.36–2.42], vs CD 21.9%, OR 2.23 [2.17–2.26], vs non-IBD 11.2%), and smoking (UC 28.4%, OR 1.92 [1.89–1.94], vs CD 31.9%, OR 2.27 [2.24–2.29], vs non-IBD 17.1%). Collinearity was minimal between these covariates, with all VIF values being <1.5. The P values for Hosmer-Lemeshow goodness-of-fit tests were >0.05 in all models generated, indicating adequate fit.
In overall unadjusted analysis, the prevalence of MI was higher in patients with UC and CD vs non-IBD patients (UC 6.9% vs CD 9.0% vs non-IBD 4.0%, OR for UC 2.09 [2.04 -2.13], and CD 2.79 [2.74–2.85]). In non-caucasians, patients with either UC or CD had higher odds of MI compared with non-IBD patients. (Table 2).
Risk of MI in IBD vs Non-IBD Patients According to Race
| Race | Caucasians | Non-Caucasians |
|---|---|---|
| Prevalence of MI in non-IBD patients (%) | 4.0 | 1.8 |
| Prevalence of MI in UC patients (%) | 6.9 | 5.5 |
| Prevalence of MI in CD patients (%) | 9.0 | 7.3 |
| Odds ratio (UC vs non-IBD) | 1.77 (1.73–1.82) | 3.18 (3.00–3.37) |
| Odds ratio (CD vs non-IBD) | 2.37 (2.33–2.42) | 4.29 (4.10–4.49) |
The odds of MI in IBD patients overall were highest in younger patients and decreased with age (age 30–34 years, OR 12.05 [11.16–13.01] to age 65+ years, OR 2.08 [2.04–2.11]) (Fig. 1). A similar trend was observed with both UC and CD patients; however, patients with CD had greater odds of MI compared with patients with UC (across all age groups, Fig. 2).
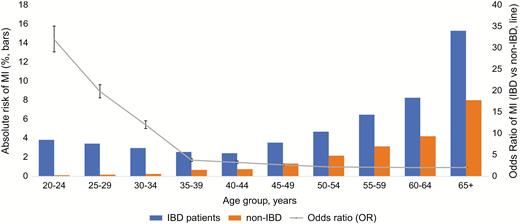
Overall risk of MI in patients with IBD vs non-IBD patients, prevalence (bars) and odds ratio (line).
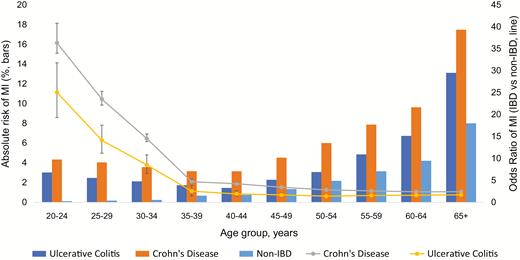
Overall odds of MI stratified by UC vs CD, prevalence (bars) and odds ratios (line).
In our multivariable model, after adjusting for age, race, sex, and traditional cardiovascular risk factors listed in Table 1, the presence of IBD conferred greater odds of MI (adjusted odds ratio [aOR] 1.25 [1.24–1.27], Table 3). In patients with IBD, risk factors for MI were male gender (aOR 1.40 [1.36–1.43];), hypertension (aOR 3.77 [3.60–3.94]), older age (aOR for 65+ years vs 20–65 years: 2.02 [1.96–2.08]), diabetes (aOR 2.36 [2.30–2.43]), smoking (aOR 1.57 [1.53–1.61]), dyslipidemia (aOR 1.51 [1.47–1.55]), and obesity (aOR 1.15 [1.11–1.18]).
Multivariable Model with MI Being the Dependent Variable
| Multivariable Model | AOR (95% CI) in Overall Study Population* | AOR for IBD (95% CI)* | AOR for Non-IBD (95% CI)* | |
|---|---|---|---|---|
| — | IBD vs no IBD | 1.25 (1.24–1.27) | — | — |
| Age | 65+ vs 20–64 | 2.30 (2.29–2.31) | 2.02 (1.96–2.08) | 2.30 (2.29–2.31) |
| Race | Caucasian vs Non-caucasian | 1.32 (1.31–1.33) | 1.00 (0.97–1.04); P = 0.84 | 1.33 (1.32–1.35) |
| Sex | Male vs female | 1.78 (1.77–1.79) | 1.40 (1.36–1.43) | 1.79 (1.78–1.81) |
| Comorbidities | ||||
| Dyslipidemia | 1.38 (1.37–1.39) | 1.51 (1.47–1.55) | 1.38 (1.37–1.39) | |
| Diabetes Mellitus | 1.85 (1.84–1.86) | 2.36 (2.30–2.43) | 1.85 (1.84–1.86) | |
| Hypertension | 7.23 (7.19–7.27) | 3.77 (3.60–3.94) | 7.28 (7.24–7.32) | |
| Smoking | 1.69 (1.68–1.71) | 1.57 (1.53–1.61) | 1.69 (1.68–1.70) | |
| Obesity | 1.25 (1.24–1.26) | 1.15 (1.11–1.18) | 1.25 (1.24–1.26) |
*All P values are <0.0001 unless stated otherwise. Model adjusted for interactions.
In overall adjusted analysis, Caucasian race was associated with increased risk of MI (aOR 1.32 [95% CI, 1.31–1.33]). This risk persisted in non-IBD patients (aOR 1.33 [95% CI, 1.32–1.35]) but was attenuated in patients with IBD (aOR 1.00 [95% CI, 0.97–1.04]; P = 0.84)
In overall unadjusted analysis, females with both UC and CD had higher odds of MI than men when compared with non-IBD patients (OR for females with UC 2.54 [95% CI, 2.46–2.61], vs OR for males with UC 1.85 [95% CI, 1.79–1.91] OR for females with CD 2.91 [95% CI, 2.82–3.00], vs OR for males with CD 2.15 [95% CI, 2.07–2.23]) (Fig. 3–5). However, in adjusted analysis of all patients, male gender conferred higher risk of MI (aOR 1.78 [95% CI, 1.77–1.79], Table 3).
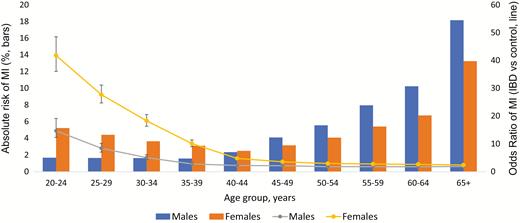
Gender differences in odds of MI in patients with IBD, prevalence (bars) and odds ratios (line).
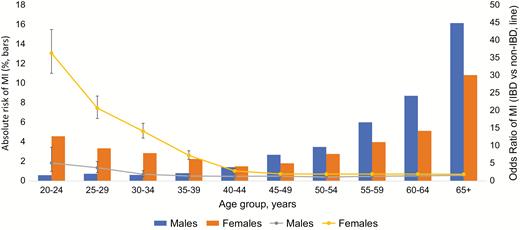
Gender differences in odds of MI in patients with UC, prevalence (bars) and odds ratio (line).
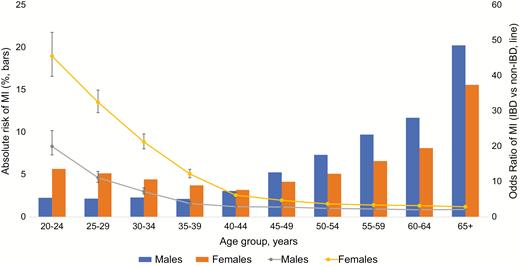
Gender differences in odds of MI in patients with CD, prevalence (bars) and odds ratios (line).
DISCUSSION
In this large electronic medical record–based study of more than 29 million patients, we found that the presence of IBD is associated with higher risk of MI. This association persisted despite adjustments for multiple confounding traditional cardiovascular risk factors such as age, hypertension, diabetes, smoking, and hyperlipidemia, suggesting that IBD may be an independent risk factor for MI.
Inflammation has long been implicated in the pathogenesis of atherosclerosis and coronary artery disease.1–3 Pro-inflammatory markers such as homocysteine and CRP that are known to be elevated in patients with CVD are also markers of chronic systemic inflammation in conditions such as RA, SLE, and IBD.4–7
While the increased risk of VTE in patients with IBD is well known, the association between IBD and atherosclerotic CVD/arterial thromboembolic disease has been more elusive and subject to debate. A 2007 systematic review found that IBD was not associated with increased cardiovascular mortality.10 In a large study analyzing a large population-based claims database with roughly 18,000 IBD patients, Ha et al showed that the increased risk of MI was present only in women with IBD who were 40 years or older, even after adjusting for traditional cardiovascular risk factors.11 Yarur et al showed in their retrospective cohort study that after adjusting for traditional CVD risk factors, patients with IBD were more likely to have adverse CV outcomes (hazard ratio [HR] 4.08 [95% CI, 2.49–6.70]).13 A large Danish study with about 20,000 patients also observed increased risk of CVD in patients with IBD.14. In contrast, in an analysis of the Nationwide Inpatient Sample (NIS), Barnes et al found that patients with IBD were less likely to be discharged with a diagnosis of acute MI compared with patients without IBD.16 The findings of our study, the largest to date, help shed light on this controversy and support the adverse association of IBD and higher risk of MI.
There are several potential mechanisms proposed to explain the increased risk of MI in patients with IBD. First, the underlying pro-inflammatory state is a potent stimulus for thrombogenesis and endothelial dysfunction.24 Activation of the coagulation cascade and pro-inflammatory cytokines due to active intestinal inflammation may also be a contributing factor.24, 25 Notably, as reported in the Danish study, the risk of adverse cardiovascular events is highest during active flares or persistent disease, with this risk diminishing during times of remission. Unfortunately, in our study we are unable to distinguish between active and quiescent IBD.
Differences Between Crohn’s Disease and Ulcerative Colitis
We observed that CD conferred a higher risk of MI compared with UC. Compared with UC, CD is a more aggressive and widespread disease that has more frequent extraintestinal manifestations26 and is more likely associated with more intense inflammatory activation.
Higher Risk of MI in Younger Patients
We also observed that the risk of MI was highest among younger patients with either UC or CD and diminished over time (Fig. 1). The majority of patients are diagnosed with IBD between 15 and 30 years of age,26, 27 and younger age at diagnosis has been shown to be associated with more aggressive and disabling disease, implying increased levels of inflammation,28, 29 which may explain the increased risk of MI in younger patients. The reduction in odds with age may be explained by the fact that disease severity tends to decrease with age, and patients without IBD accumulate traditional risk factors as they age, which may reduce the relative contribution of inflammation to atherosclerosis.
Inflammatory Bowel Disease and Cardiovascular Risk Factors
We noted that in our cohort, traditional CVD risk factors (such as hypertension, diabetes dyslipidemia, smoking, and obesity) were more common among patients with both IBD (Table 1). One explanation for this is that because IBD patients receive more intensive health care, they may undergo more testing and have more diagnoses than patients without IBD (detection bias). The increased risk of MI seen in patients with IBD could be explained by the higher prevalence of CV risk factors in this cohort; however, the fact that this effect persisted despite adjusting for CV risk factors further supports the existence of independent pathogenic mechanisms inherent to IBD.
Gender and Racial Differences
Our overall analysis showed younger women (<45 years) to be at higher risk of MI compared with their male counterparts in both UC and CD cohorts (Fig. 3–5). Above 45 years of age, both males and females had similar risk of MI. Upon adjustment for baseline characteristics, however, we found that males were at higher risk than females (aOR 1.78 [95% CI 1.77–1.79]). One explanation for this finding may be that in our analysis females have a higher CVD risk factor profile at baseline, which was adjusted for in our multivariable model. Moreover, our adjusted model accounted for all age groups, thus also explaining this discrepancy.
In adjusted analyses, we found that in the overall population, Caucasians were at higher risk of MI than non-Caucasians (aOR 1.32; 95% CI, 1.31–1.33, Table 3). Prior work has shown that Caucasians have higher prevalence of coronary artery disease compared with non-Caucasians.30 Also, disparities exist in cardiovascular health care provision to non-Caucasians,31 which may also explain why MI is diagnosed more frequently in Caucasians. Similarly, Caucasian race was also associated with higher risk of MI in the non-IBD cohort. However, no racial predominance in risk of MI was seen in the IBD cohort (aOR 1.00; 95% CI, 0.97–1.04; P = 0.84, Table 3). One possible explanation for this is that IBD patients have greater exposure to health care and therefore may be screened and treated for cardiovascular disease more aggressively than patients without IBD and without racial disparity, which may otherwise exist in non-IBD patients, who may otherwise not be screened.
Strengths and Limitations
A significant strength of our study is that it utilizes a very large nationwide database, with more than 29 million patients included in our analysis. Moreover, we provide a comprehensive epidemiological analysis of the risk of MI in patients with IBD across age groups, gender, and races and therefore illuminate the cardiovascular risk profile of patients with IBD. Our results are consistent with the growing body of literature that suggests that inflammation is an independent risk factor for MI, and the results also help settle previously discrepant findings.
This is a retrospective study reliant on diagnostic SNOMED-CT codes; therefore, it is impossible to verify accuracy of diagnoses, and it is prone to coding errors. In our one-year analysis, prevalence of IBD was 1.5%, which is consistent with a recent study estimating prevalence of IBD in the US population to be 0.9%.8 An analysis from the Centers for Disease Control analyzing data from the 2015 National Health Interview Survey found prevalence of IBD to be an estimated 1.3%, which is also similar to our estimate.32
Due to the lower numbers of younger patients in the database, our calculations of odds ratios may have been skewed and not truly representative of the real risk in this subset of patients. However, this does not detract from the overall trend that was observed.
Another significant limitation of our study is validity of diagnosis of MI. While we indirectly assessed the accuracy of our SNOMED-CT search terms by generating their ICD-9-CM equivalents and comparing them with the literature, we acknowledge that this approach is still prone to error, and there may have been misclassification of cases. We were unable to differentiate between a spontaneous MI due to a primary coronary event (Type 1 MI) from demand-related ischemia (Type 2 MI), as an elevated troponin level due to demand ischemia in the setting of sepsis or surgery may have been coded as “myocardial infarction.” Validation was also not possible due to the fact that all patient information in the database is de-identified.
Another limitation of using this database is that temporal relationships cannot be determined with IBD duration, severity, and therapies with risk of myocardial infarction due to the design of the database. Also, it is possible that some patients may have received care at institutions not part of the Explorys health care network; thus, we were not able to account for these patients.
CONCLUSION
In this cohort of over 250,000 patients with IBD compared with over 28 million age-and gender-matched patients without IBD, we found that both UC and CD are associated with a disproportionately higher risk of MI. Our findings need to be further confirmed by prospective studies.
Author contributions: MSP contributed to the design of study, data collection, analysis and drafting of manuscript. EM and SGA contributed to the design of study and manuscript revision. PS, JK, GSC, GHO contributed to the manuscript revision and guidance. MG contributed to the overall supervision of study, guidance, and manuscript revision.

