


Abstract
Larger organisms have more potentially carcinogenic cells, tend to live longer and require more ontogenic cell divisions. Therefore, intuitively one might expect cancer incidence to scale with body size. Evidence from mammals, however, suggests that the cancer risk does not correlate with body size. This observation defines “Peto's paradox.” Here, we propose a novel hypothesis to resolve Peto's paradox. We suggest that malignant tumors are disadvantaged in larger hosts. In particular, we hypothesize that natural selection acting on competing phenotypes among the cancer cell population will tend to favor aggressive “cheaters” that then grow as a tumor on their parent tumor, creating a hypertumor that damages or destroys the original neoplasm. In larger organisms, tumors need more time to reach lethal size, so hypertumors have more time to evolve. So, in large organisms, cancer may be more common and less lethal. We illustrate this hypothesis in silico using a previously published hypertumor model. Results from the model predict that malignant neoplasms in larger organisms should be disproportionately necrotic, aggressive, and vascularized than deadly tumors in small mammals. These predictions may serve as the basis on which to test the hypothesis, but to our knowledge, no one has yet performed a systematic investigation of comparative necrosis, histopathology, or vascularization among mammalian cancers.
Introduction
Cancer afflicts most, perhaps all, classes of vertebrates and appears to be most common in mammals (Galis 1999; Galis and Metz 2003). Basic cancer-causing mechanisms are similar among mammalian species, and many tumor-suppressing systems are conserved (Leroi et al. 2003), which allows us to model the disease in humans by using rodents and other mammals. Nevertheless, malignant neoplasia is somehow fundamentally different in different mammalian species, a fact recognized over 30 years ago by Peto et al. (1975). This fundamental difference is implied by what is now called “Peto's paradox” (Leroi et al. 2003).
The paradox begins with the following logical argument. If all mammalian cells were roughly equally susceptible to oncogenic mutations, had equivalent tumor-suppressing systems, and neoplastic cells were equally viable in all mammals, then the number of cells susceptible to malignant transformation in a given organism would be roughly proportional to its body size, and the probability that a given susceptible cell transitions to malignancy would be an increasing function of time, as observed in humans (Cole and Rodu 2001). Therefore, one would anticipate that cancer incidence would correlate positively, at least roughly, with the product of body mass and longevity. Within a species, this variation could be trivial, but among mammalian species, which vary in mass from 2 × 10⁻³ kg to 190,000 kg—a small bumblebee bat, Craseonycteris thonglongyai versus a large blue whale, Balaenoptera musculus (Pereira et al. 2006)—these correlations should be marked enough to measure, again under the assumption that cancer etiology and pathogenesis are roughly consistent among all mammals.
A review of the literature, however (discussed subsequently), reveals no obvious correlation between cancer incidence and body mass, in agreement with earlier assessments (Leroi et al. 2003). In general, cancer is easy to find in most mammals, but populations in which cancer is a leading cause of death seem to be special cases associated with an external etiologic agent and show no obvious association with body size, at least not what one would expect given masses that range over eight orders of magnitude. Therefore, we conclude that cancer etiology and pathogenesis are not consistent across the class. In other words, we conclude that Peto's is a legitimate paradox, the resolution to which is neither obvious nor trivial.
Here we suggest a hypothesis that could resolve Peto's paradox. In particular, we hypothesize that malignant cell populations in larger organisms are more susceptible to invasion by selfish “cheater” phenotypes, and these selfish cells damage or destroy the tumor from within, much like the tumor damages or destroys its host from within. In essence, the cheater population forms a tumor-within-a-tumor, or “hypertumor” (Nagy 2004). We use mathematical models and computer simulations to illustrate the hypertumor-mechanism hypothesis and generate practically testable predictions.
Cancer epidemiology in mammals and Peto's paradox
Although current research is unable to establish ubiquity of cancer among mammals, evidence points in that direction. In particular, malignant neoplasia is widely reported in domestic animals and wildlife, both free-ranging and captive (Table 1). Beyond this, however, surprisingly little is known.
A partial list of reported cancer in mammals and dinosaurs
| Common name | Scientific name | Reference |
|---|---|---|
| Virginia opossum | Didelphis virginiana | Prater et al. (1999) |
| Tasmanian devil | Sarcophilus laniarius | Pearse and Swift (2006) |
| Domestic dog | Canis familiaris | Michell (1999) |
| Coyote | Canis latrans | Bekoff and Gese (2003) |
| Red fox | Vulpes vulpes | Hirayama et al. (1999) |
| Island gray fox | Urocyon littoralis | Roemer et al. (2004) |
| House cat | Felis domesticus | Mayr et al. (2000) |
| Asian golden cat | Catopuma temminckii | Rao and Acharjyo(1985) |
| Bengal tiger | Panthera tigris | Powe et al. (2005) |
| African lion | Panthera leo | Sakai et al. (2003) |
| Snow leopard | Uncia uncia | Murata et al. (2003) |
| Domestic ferret | Mustela putorius furo | Jones et al. (2006) |
| Meerkat | Suricata suricata | Singh et al. (2005) |
| Binturong | Arctictis binturong | Klaphake et al. (2005) |
| Cottontail Rabbit | Sylvilagus spp. | Syverton et al. (1950) |
| White-tailed Jackrabbit | Lepus townsendii | Jardine et al. (2004) |
| House mouse | Mus musculus | Hirst and Balmain (2004) |
| Rat | Rattus spp. | Russo and Russo (1996) |
| White-footed mouse | Peromyscus leucopus | Parnell et al. (2005) |
| Woodchuck | Marmota monax | Menne and Cote (2007) |
| Coypus | Myocastor coypus | Keymer et al. (1999) |
| California sea lion | Zalophus californianus | Acevedo- Whitehouse et al. (1999) |
| Northern elephant seal | Mirounga angustirostris | Fauquier et al. (2003) |
| African hedgehog | Atelerix albiventris | Raymond and White (1999) |
| Domestic horse | Equus caballus | Plummer et al. (2007) |
| Black rhinoceros | Diceros bicornis | Paglia and Radcliffe (2000) |
| Asian elephant | Elaphis maximus | Liu et al. (2004) |
| Dromedary camel | Camelus dromedarius | Vitovec (1982) |
| Pig | Sus scrofa | Kleinschmidt et al. (2006) |
| Western roe deer | Capreolus capreolus | Aguirre et al. (1999) |
| Pere David's deer | Elaphurus davidianus | Yoon et al. (1999) |
| Nubian ibex | Capra nubiana | Wooldridge et al. (1999) |
| Domestic goat | Capra hircus | Whitney et al. (2000) |
| Cattle | Bos taurus | Campo (1997) |
| Domestic sheep | Ovis aries | Palmarini et al. (1999) |
| Bottlenose dolphin | Tursiops truncatus | Martineau et al. (2002) |
| Atlantic spotted dolphin | Stenella frontalis | Martineau et al. (2002) |
| Pantropical spotted dolphin | Stenella attenuata | Martineau et al. (2002) |
| Pacific white sided dolphin | Lagenorhynchus obliquidens | Martineau et al. (2002) |
| Short-finned pilot whale | Globicephala macrorhynchus | Martineau et al. (2002) |
| Harbor porpoise | Phocoena phocoena | Martineau et al. (2002) |
| Amazon river dolphin | Inia geoffrensis | Martineau et al. (2002) |
| Common dolphin | Delphinus delphis | Martineau et al. (2002) |
| Beluga whale | Delphinapterus leucas | Martineau et al. (2002) |
| Killer whale | Orcinus orca | Martineau et al. (2002) |
| Pigmy sperm whale | Kogia breviceps | Martineau et al. (2002) |
| Fin whale | Balaenoptera physalus | Martineau et al. (2002) |
| Blue whale | Balaenoptera musculus | Martineau et al. (2002) |
| Duck-billed dinosaur | Hadrosauridae | Rothschild et al. (2003) |
Cancer in wildlife
The majority of studies on cancer in wild mammals are case reports of individuals in zoos or sporadic cases observed in the wild (see references in Table 1). Few solid epidemiological studies in wild populations exist, largely because size of the population at risk is either unknown or ill-defined (Martineau et al. 2002). What evidence does exist suggests that incidence of malignant neoplasia in wild mammals tends to remain well below that in humans. For example, among captive wildlife, crude cancer risk (number of cancers in animals that die of natural causes) varies between about 1.5% and 4.5% (Galis and Metz 2003). In a population of Swedish roe deer, crude risk of all neoplasia is only 2% (Aguirre et al. 1999). In comparison, 20–30% of people in most countries suffer cancer at some time in their lives (Bishop 1989; Muirhead et al. 2004).
In a few cases, cancer in wild populations approaches or even exceeds that in humans, but in each case the cause is a well-defined, nongeneric agent. For example, the entire population of Tasmanian devils, a marsupial carnivore of Tasmanian Australia, are threatened by one particular cancer, called devil facial tumor disease (DFTD). Oddly, this cancer behaves as an emerging infectious disease. Scant evidence of DFTD existed prior to 1995, but by 1996 it had spread across half of the devil's range (Hawkins et al. 2006). In some areas, local prevalence approaches or even exceeds 80%, and population density appears to correlate negatively with prevalence (Hawkins et al. 2006). The disease is characterized by massive, infiltrating facial tumors that eventually impede the animal's ability to feed (Pearse and Swift 2006). Histologically, they appear to be sarcomas of neuroectodermal origin (Hawkins et al. 2006). Interestingly, karyotypes of cells from tumors in 11 different devils all show precisely the same complex aneuploidy, suggesting that the tumors pass as allografts from animal to animal during combat (Pearse and Swift 2006). In essence, this cancer metastasizes among, not just within, hosts.
Woodchucks also suffer high cancer rates, especially in the liver, but again the cause is a specific etiological agent. Some woodchuck populations harbor a hepatitis virus that, as in humans, causes a variety of hepatic diseases, including hepatocellular carcinoma (Snyder et al. 1982; Roth et al. 1985; Menne and Cote 2007). In fact, woodchucks have become an important animal model for hepatitis virus infection in humans (Menne and Cote 2007), so most literature focuses on experimentally induced infection. In one study of natural infection, however, 13 of 16 (81%) infected woodchucks also suffered hepatocellular carcinoma, with one distant metastasis, compared to one liver adenoma in 149 (0.7%) virus-free animals (Roth et al. 1985). Another study of uninfected woodchucks uncovered only two neoplasms in 147 animals (1.4%) (Roth et al. 1991). Other solid neoplasms reported in woodchucks include fibrosarcoma (Young and Webster 1985), teratoma, seminoma (Anderson and Johnson 1988), meningioma (Podell et al. 1988), pleural mesothelioma (Kang et al. 2004), and leiomyosarcoma (Kang et al. 2005), although these are all sporadic cases.
Perhaps the best nonhuman cancer epidemiological work has been performed on cetaceans—whales, porpoises, and dolphins. The disease has been identified in many cetacean species (Table 1). Most of these examples are sporadic case reports typical in wildlife cancer literature, but in one population of belugas inhabiting the St. Lawrence estuary, the incidence of cancer approaches or perhaps even exceeds that of humans (Martineau et al. 2002). The cause appears to be agricultural and industrial pollution of the estuary (De Guise et al. 1994, 1995; Martineau et al. 1994, 2002; Muir et al. 1996; Letcher et al. 2000).
This beluga population, however, appears to be exceptional. Reported cancer risk in no other cetacean population approaches that of the St. Lawrence belugas. Indeed, Martineau et al. (2002) identified only 33 other cases of cancer in cetaceans worldwide prior to 2002 and note that few cancers have been found in cetaceans killed by hunters or dying of natural causes, including beluga in the Beaufort Sea, pilot whales, bottlenose dolphins, harbor porpoises, and various other toothed whales (Odontocetes). These researchers conclude that “cancer in stranded [St. Lawrence Estuary] belugas are more numerous than in other cetaceans, where cancer is a rare event.” One may perhaps debate the latter portion of this statement on the grounds that, without careful epidemiological study directed specifically at cancer in all whales, we are largely ignorant of any measure of cancer incidence except for a few species in the order. Nevertheless, we find it interesting that in an order with the largest mammals on the planet and with species that range in mass from the vaquita (Phocoena sinus) (30–55 kg) to the blue whale (≈150, 000 kg), no correlation between cancer incidence and size has been noted.
Cancer in domestic mammals
Much more is known about cancer in domestic mammals than in wildlife—indeed, neoplasia is a major aspect of the pathology taught to students of veterinary medicine, including students preparing for large-animal practice and those training for care of companion animals (Hahn 2002; Withrow and Vail 2006). Also, domesticated and laboratory strain mice and rats have long been used as animal models of human cancer (Russo and Russo 1996; Hirst and Balmain 2004; Wakamatsu et al. 2007, for example). Nevertheless, we find no references in this literature reporting a correlation between cancer incidence and the product of body mass and longevity. In fact, although tumor incidence varies among small mammals (Greenacre 2004), it can reach 40% or more in “wild strain,” as opposed to laboratory strain, mice (Mus musculus) (Andevort and Dunn 1962).
However, cancer incidence in domestic species yields a potentially biased view of cancer patterns among mammals in general. First, very few—less than 0.1%—of the 4000–5000 known mammalian species (Wilson 1988; Ceballos et al. 2005) have been domesticated (Watson et al. 1995; Diamond 1997, 2002). Second, many domestic animals, especially companion animals, become senescent. In humans, cancer incidence increases roughly exponentially with age usually through the first seven decades of life (Cole and Rodu 2001); therefore, cancer is primarily a disease of senescence. For example, median age at diagnosis is in the mid-60s for patients with small cell lung cancer (Van Meerbeek et al. 1997), even though this tumor type is strongly associated with environmental causes, primarily tobacco smoke (Van Meerbeek et al. 1997; Kobzik 1999; Murren et al. 2001). Therefore, if small domestic mammals tend to live longer than do large animals, we would expect disproportionately more cancers in small mammals even under the hypothesis of equivalent cancer mechanisms among mammalian cells.
Peto's paradox
Under the hypothesis that cancer risk correlates with the product of body size and longevity, we would expect cancer to be common in baleen whales since they are both large and long-lived. But, as we argued earlier, the literature reveals no such pattern. Therefore, either the hypothesis is incorrect, at least for cetaceans, or we lack sufficient data to identify the pattern. The literature from other mammals suggests that the hypothesis is, in general, incorrect. Elephants, for example, are common denizens in larger zoos, and the Asian elephant (Elephas maximus), at least, has been domesticated. However, in PubMed, which indexes the major veterinary journals, a search across all fields on the terms “Elephantidae,” “Elephants,” “Elephas,” and “Loxodonta,” coupled with “tumor,” “neoplasia,” “cancer,” and “carcinoma” in all possible permutations uncovers only 15 case reports, most of which are not cancer, and no epidemiological studies. Only two papers report tumors in Loxodonta, neither of which are cancer (a pheochromocytoma and an odontoma). A similar search for neoplasia in rhinoceroses uncovers only six case reports. In contrast, a single search under the words “Panthera AND neoplasia” finds reports of tumors in 11 lions, six tigers, two leopards, three jaguars, and one snow leopard.
Of course, we do not present these searches in lieu of epidemiological studies—we do not mean to suggest, for example, that tumor incidence in lions and elephants are roughly equal. The fact is that solid epidemiological research simply does not exist for most wildlife populations (Martineau et al. 2002), apparently including captive ones. However, suppose that cancer etiology and pathogenesis were essentially equivalent in blue whales, elephants, and roe deer. Also suppose that crude cancer risk observed for roe deer by Aguirre et al. (1999) is accurate at 2%, which is about a tenth of the risk in humans (see the beginning of this section). Roe deer weigh about 25 kg, blue whales about 150,000 kg and elephants about 4000 kg. Therefore, it takes about 6000 “roe deer equivalents” to make one blue whale and about 160 to make an elephant. Under the hypothesis of equivalent carcinogenic risk among mammalian cells, which implies the hypothesis that randomly chosen 25 kg masses of tissue have, on average, roughly equivalent cancer risks, then the probability that a blue whale lives a cancer-free life would be less than (1 − 0.02)6000 ≈2.27 × 10−53. Similarly, at least 96% of all elephants would develop cancer at some point in their lives.
Note that these calculations represent lower bounds for cancer risk because they are based on two intentionally incorrect assumptions. First, they assume that roe deer, blue whales and elephants all have equivalent mean life spans. In fact, the larger species live longer. Second, they assume that the number of cell divisions required to construct an organism is roughly equivalent across species, but larger organisms require more cell divisions, increasing the likelihood of oncogenic mutations. Therefore, even given the paucity of epidemiological research on wildlife neoplasia, it is somewhat surprising that so few cases of cancer in baleen whales and pachyderms have been noticed, especially since cancer has been widely reported in so many other mammals, both common and rare (Table 1).
These observations lead us to conclude that cancer risk does not correlate strongly with the product of body size and longevity; therefore, cancer etiology and pathogenesis are fundamentally different in different mammals. The reason why may seem obvious. Mammal populations vary in exposure to cancer-causing agents, cells vary in susceptibility to malignancy, cancer risk varies by tissue and mammal species vary in their proportions of each tissue type. Therefore, one should expect that cancer rates vary among mammalian species. In addition, despite striking similarities that allow us to use other mammals as models of human cancer, certain cellular mechanisms of carcinogenesis act differently in different mammalian species (Maronpot et al. 2004; Forsyth et al. 2005). However, these sources of variation could obliterate the expected correlation of cancer incidence with body mass only if they were enormous or also covaried with body mass. Therefore, just evoking variation among mammal populations—genetic, environmental, or both—does not resolve Peto's paradox.
A number of hypotheses, reviewed by Leroi et al. (2003), have been proposed that do resolve the paradox. First, mutation rates may vary inversely with body size. For example, selection may favor more effective DNA repair mechanisms in large organisms, thereby avoiding early malignant neoplasia. Second, carcinogenic mutations may be more advantageous to cells in smaller rather than larger hosts. For example, cells in larger hosts may be less sensitive to mutations that, in smaller organisms, cause cell proliferation in preneoplastic lesions. Third, selection might favor more redundant anticancer mechanisms, like tumor-suppressor genes, within the genomes of larger organisms. To these three we may add three others. Perhaps a weak correlation between cancer incidence and body size exists, but the mechanisms of variation noted above dominate the pattern. Or, maybe there is no paradox at all. Perhaps cancer incidence covaries strongly with body size and longevity, but our general ignorance of cancer epidemiology across the class obscures the pattern. Finally, perhaps cancer case fatality correlates negatively with body size and longevity. For example, malignant neoplasia in large organisms may tend to resolve spontaneously or remain a sublethal, chronic condition, whereas the same disease would kill a smaller host. If this were true, then Peto's would be an empty paradox—the cancers are there, but we fail to notice.
In what follows, we do not attempt to identify which of these hypotheses is correct. Indeed, most are not even mutually exclusive. Instead, we adopt the more modest goal of suggesting a mechanism that may explain how cancer case fatality rate may correlate negatively with body size.
Hypertumors and Peto's paradox
Cancer pathogenesis appears to be driven primarily by natural selection acting on phenotypic variation among neoplastic cells (Leroi et al. 2003; Nagy 2005; Axelrod et al. 2006; Merlo et al. 2006; Vineis and Berwick 2006). In the “standard model” of carcinogenesis (Cotran et al. 1999; Hanahan and Weinberg 2000), cells on the road to malignancy accumulate mutations in key genes, causing them to both proliferate and lose cohesion with the surrounding cells and with the extracellular matrix. These mutations drive cells to compete, instead of cooperate, with their genetically intact neighbors. At some point, a subpopulation of these cells acquires all the “hallmarks of cancer” (Hanahan and Weinberg 2000), including in part the ability to proliferate without external stimulation, avoid cellular senescence, shut down apoptotic mechanisms, and disperse both locally (invasion) and over long distances (metastasis). These properties give mutated cells a selective advantage as competition becomes increasingly fierce in the developing tumor. Accumulating evidence suggests that a small population of cells, called cancer stem cells, controls the behavior of most cells within a tumor (Zhang et al. 2006; O'Brien et al. 2007; Ricci-Vitiani et al. 2007). These stem cells are not only capable of independent proliferation, but apparently can promote their own growth by directing other cells to construct an ecosystem suitable for stem cell survival and proliferation. In this sense, cancer stem cells represent the ultimate “winners” in the tumor's evolutionary game.
Angiogenesis, the growth of new blood vessels into the neoplasm, is another phenotypic property almost universally favored by selection in nascent tumors (Carmeliet and Jain 2000; Folkman et al. 2000; Hanahan and Weinberg 2000). When hypoxic, tumor cells elicit angiogenesis by secreting tumor angiogenic factors (TAF), notably vascular endothelial growth factor (VEGF) and angiopoietin-2 (ang-2) among others (Holash et al. 1998). These growth factors cause proliferation of nearby vascular endothelial cells (VECs). Daughter VECs then build new blood vessels up the VEGF concentration gradient towards the hypoxic region (Neufeld et al. 1999).
Recently, Nagy (2004, 2005) investigated in silico the consequences of natural selection and angiogenesis in malignant tumors. The core of these models consists of a system of ordinary differential equations describing the dynamics of tumor cells of various phenotypes, immature VECs able to produce mature tumoral blood vessels, and the mature vessels themselves. Competing tumor cells varied in growth potential, sensitivity to variations in local oxygen pressure affecting both birth and death rates, and ability to secrete TAF. (Model details are presented in the Supplementary Material.) Under realistic conditions, these models predict the possibility of “hypertumors,” aggressive cells that fail to secrete sufficient TAF to support tumoral growth. In essence, hypertumors are composed of “cheaters” that take advantage of the vascular infrastructure built by other tumor cells. This population of cheaters grows parasitically on the tumor, damaging it perhaps to the point of inviability. Morphologically, hypertumors are expected to appear as necrotic regions associated with histological and genetic markers of aggressive growth (Nagy 2004).
This hypertumor concept may suggest a possible resolution to Peto's paradox. Larger organisms may in fact suffer more cancer, but tumors in larger organisms are more likely to evolve hypertumors, causing a negative correlation between case fatality rate and host body size. Malignant tumors in baleen whales, for example, would rarely kill their hosts because a tumor, either primary or metastatic, may experience one or more hypertumors that maintain the tumor at a sublethal size. In a pika (Ochotona princeps), on the other hand, which weighs only about 150 g (Smith and Weston 1990), most viable tumors reach lethal size before hypertumors have time to arise. Therefore, large mammals may indeed suffer more malignant neoplasia than small mammals, but the tumors would rarely represent a health risk. At most, careful necropsy of a baleen whale, for example, would reveal numerous small (maximum 10–100 g), necrotic tumors and perhaps many regression scars. In such enormous animals, however, even the largest of these tumors would be 10−5 to 10−6 of the animal's mass and could easily go unnoticed under conditions in which most baleen whales have been necropsied—on a whaling ship, often at sea.
The model and simulations
To illustrate these points and generate testable predictions, we conducted further simulations of the model described by Nagy (2004). (Simulation details are available in the online Supplementary Material.) These simulations begin with a small (0.1 g), vascularized tumor of only one cell type. At randomly chosen times, the tumor would be challenged by rare mutant cell strains. Parameters describing the phenotypes of all strains were chosen randomly from intervals representing realistic possible values. The number and mean interarrival times of mutant challengers were fixed at 20 and 50 days, respectively, although we emphasize that this choice is somewhat arbitrary. Neither parameter is well defined in existing literature. In particular, interarrival times for mutant strains cannot be equated with mutation rates because it includes the probability that a mutant strain reaches a population size large enough to be buffered from stochastic fluctuations. The values chosen, however, produce realistic results in realistic time scales.
We repeated the simulation 1000 times. In each run, we tracked tumor mass and microvessel length density (mean microvessel length per unit mass of tumor). We also monitored the number of potentially deadly tumors (defined subsequently) and time at which they would have reached this size, if at all, for six representative organisms: American pika, woodchuck, western roe deer, humans, beluga whales, and blue whales (Table 2).
Estimated body and “lethal” tumor masses for representative mammalian species.
| Species | Body Mass (kg) | Lethal Tumor Mass (g) |
|---|---|---|
| Ochotona princeps | 0.15 | 12 |
| Marmota monax | 5 | 170 |
| Capreolus capreolus | 25 | 560 |
| Homo sapiens | 70 | 1200 |
| Delphinapterus leucas | 1400 | 11,400 |
| Balaenoptera musculus | 100,000 | 281,000 |
| Species | Body Mass (kg) | Lethal Tumor Mass (g) |
|---|---|---|
| Ochotona princeps | 0.15 | 12 |
| Marmota monax | 5 | 170 |
| Capreolus capreolus | 25 | 560 |
| Homo sapiens | 70 | 1200 |
| Delphinapterus leucas | 1400 | 11,400 |
| Balaenoptera musculus | 100,000 | 281,000 |
Defining tumor lethality presents two main problems. First, it is well known that the distribution of tumor sizes at time of death in humans varies greatly. General host health, tumor secretory products, type and extent of involved tissues, tumor bleeding, infection, infarction, and metastatic burden all affect the size of the most massive tumor at time of death (Cotran et al. 1999). For most malignant tumors, metastatic potential determines lethality, and there is only a weak correlation between tumor size and probability of metastasis (Cotran et al. 1999). Therefore, defining a “lethal mass” for all possible cancers is impossible. One can, however, set a benchmark that represents an “average” life-threatening tumor. For humans, we set this benchmark at 1.2 kg, close to the median lethal mass for breast cancer (Spratt et al. 1993; Kuang et al. 2004). For succinctness, we will refer to this value as “lethal mass” and the frequency of tumors reaching lethal mass as “case fatality rate.”
Results
In a great majority of simulations, hypertumors held tumors to sublethal size for years, usually to the end of the simulation (Fig. 1). Only a small fraction of simulated tumors would have appeared as clinical disease in humans, with most never exceeding 10–100 g. Patterns of growth typically included early periods of rapid evolutionary change leading to more stable histology punctuated by occasional, self-limiting invasions (Fig. 2). Case fatality in the simulations correlates negatively with body mass (Fig. 3). Also, tumors take more time to reach lethal size in larger organisms (Fig. 4), but deadly tumors in larger organisms grow much faster than they do in smaller animals (Fig. 5). In conjunction with high growth rates, deadly tumors in larger organisms are also more highly vascularized (Fig. 6).
Distribution of maximum tumor sizes in 1000 simulations of vascular tumor growth. In all simulations, the tumor was challenged by 20 mutant strains with a mean of 50 days between challenges.
Typical hypertumor dynamics. (A) Tumor mass dynamics over time. (B) Microvessel length density. Units are scaled such that 1 is the density of microvessels in the healthy tissue of tumoral origin. (C) Dynamics of individual strains. A hypertumor arises at about 300 days, which in turn is invaded by a second hypertumor at about 650 days. One can show mathematically that this tumor will eventually go extinct (data not shown).
Case fatality for six mammalian species in 1000 simulated tumors.
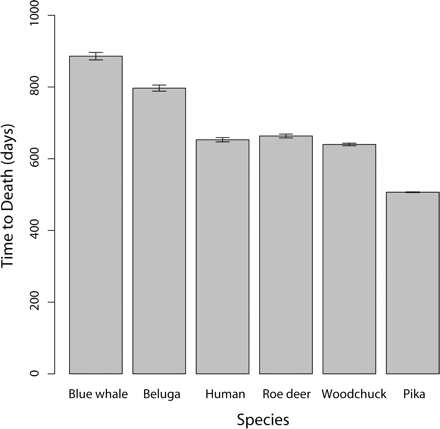
Time for a vascularized tumor to reach lethal mass from an initial mass of 0.1 g for six mammalian species in 1000 simulated tumors. Error bars are ±1 SEM.
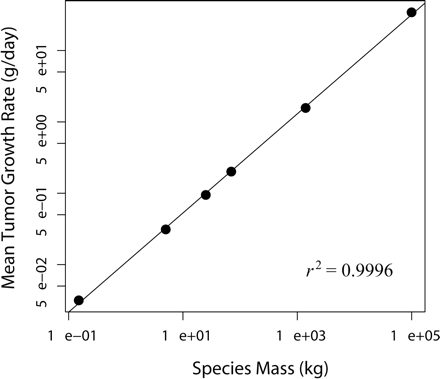
Mean tumor doubling times plotted against mass of six mammalian species in 1000 simulated tumors that reached lethal mass. SEM are smaller than the diameter of the marker for each species. The line represents a least-squares regression with parameters 0.69473 (slope) and −0.97095 (intercept).
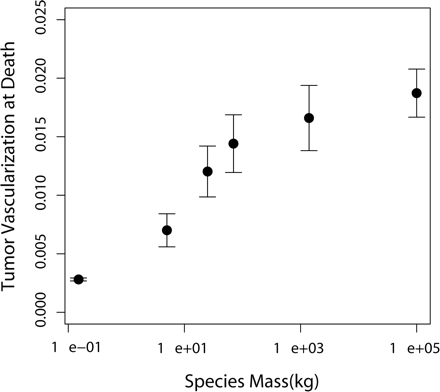
Mean vascularization of lethal tumors plotted against mass of the six mammalian species listed in Table 2, in 1000 simulated tumors. Error bars represent SEM.
These observations are a consequence of the hypertumoral mechanism. Only tumors unencumbered by hypertumors can grow large enough to threaten the health of larger organisms. These tumors are more highly vascularized because hypertumors fail to develop, and hypertumors represent the main mechanism by which tumors in this model “outstrip their blood supply” and thereby develop ischemic necrosis.
This model generates three practically testable predictions. First, tumor necrosis will vary disproportionately with body size in mammals—tumor necrosis in small mammals should be relatively rare, become more common in larger organisms, until it becomes a dominant feature of most, but not all, tumors in the largest mammals. Second, tumors that kill small mammals should vary greatly in aggression, whereas tumors that kill the largest organisms should uniformly exhibit histological and genetic markers of aggressive proliferation, including many mitotic figures in standard assays and preferential disruption of genes associated with massive tissue expansion. Finally, tumors in small mammals will also vary greatly in vascularization, but those that kill the largest organisms should be uniformly highly vascularized. These observations suggest a simple study—compare malignant tumors in humans and whales using standard microscopic techniques measuring mitotic figures and vascular density. The St. Lawrence beluga population, for example, would be ideal for such a study. If the hypertumoral hypothesis is correct, one should observe significantly more mitotic figures, more necrosis, and higher microvessel density in the cetaceans.
Discussion
Although cancer has been reported in many species of mammals, most cases involve domesticated or captive animals. Very few studies allow one to estimate standard epidemiological measures like prevalence, incidence rate, lifetime risk, or case fatality for the vast majority of mammals. What little evidence there is suggests that wildlife populations suffering high incidences of cancer harbor some external etiologic agent—epizootic infection, pollution or, in the case of Tasmanian devils, a bizarre cancer able to exploit the organism's behavior.
Conspicuously absent from this pattern is a correlation with body size. Cancer does not appear to be the dominant cause of death in the largest mammals—baleen whales and elephants. Wild mice raised in captivity can suffer shockingly high rates of neoplasia (Andevort and Dunn 1962). Humans, a modestly-sized mammal, and beluga whales in the St. Lawrence, which are about 20 times more massive than humans, experience roughly similar cancer risks (Martineau et al. 2002). In contrast, cancer is rare among belugas in the Beaufort Sea (Martineau et al. 2002). These and similar observations suggest that increasing body size generally does not increase cancer risk.
The lack of correlation between body size and incidence of tumors is typically explained by differences in cellular susceptibility to oncogenic change (Leroi et al. 2003). Fewer researchers, it seems, have suggested the alternative hypothesis that malignant cells enjoy a smaller advantage in larger organisms. Hypertumors may supply a mechanistic basis that is easily testable in the field using readily available histopathologic techniques to assess tumor aggression and vascularization. To our knowledge, however, no such systematic studies have been performed.
One important aspect of malignancy ignored in the models used for this study is metastasis. Except in a few instances—for example, basal cell carcinoma or glioblastoma (Cotran et al. 1999)—metastasis characterizes cancer. It is well known that prognosis tends to correlate negatively with metastatic burden, a property on which most tumor staging systems are based. It is equally well known that metastatic potential differs among tumors of different types even in the same tissue of origin. For example, small-cell lung cancer in humans tends to metastasize more than other types of cancer, even those of the lung (Kobzik 1999). Evolutionarily, one can view metastasis as an adaptation to avoid competition for resources within a growing tumor (Nagy 2005). If ischemia becomes pronounced in a tumor, because of a hypertumor or some other mechanism, then one expects selection to favor the metastatic phenotype. Therefore, one might predict higher metastatic loads in larger mammals, like baleen whales, compared to humans. However, the simulation results suggest that hypertumors can keep most of these metastatic tumors at bay, as well. Eventually, though, the main driver of the evolutionary dynamics would switch from competition among cells to competition among tumors. Therefore, a more detailed understanding of patterns of metastasis in mammals of various sizes would be of great interest.
Supplementary data
Supplementary data are avilable at ICB online.
Acknowledgments
This research is supported in part by NSF/NIH grant DMS/NIGMS-0342388 to J.D.N.
Conflict of interest: None declared.
References
Author notes
From the symposium “Ecological Dimorphisms in Vertebrates: Proximate and Ultimate Causes” presented at the annual meeting of the Society for Integration and Comparative Biology, January 3–7, 2007, at Phoenix, Arizona.
