


Synopsis
Whole-organism performance traits, such as maximal speed and endurance capacity are undoubtedly costly, but we know little about how or when all of the costs associated with performance are paid to individuals or how to measure them. To understand how performance traits might be involved in trade-offs with other life-history traits it is critical to determine the development, production, and maintenance costs of performance traits, as well as how each of these changes with increased or decreased use of the performance trait. We discuss the advantages and disadvantages of several potential phenotypic measures of dynamic whole-organism performance that may be used in life-history studies, including direct performance measures; metabolic rates; ecological cost of transport; and changes in metabolic rate after training. We use the first approach, direct performance measures, to show trade-offs between endurance capacity and several traditional life history variables in phrynosomatid lizards. The largest problem currently in determining the costs of performance traits and how those costs might lead to life-history trade-offs is that there are estimates of performance costs in very few taxa, and when there are, those species typically are not studied with respect to “traditional” life-history traits.
Introduction
Organisms use a number of life-history strategies to maximize Darwinian fitness. Each strategy is typically constrained by the pool of acquired energetic resources for which various life-history traits “compete” over the course of an organism’s life. This “competition” results in trade-offs, often manifested as allocation toward either survival or future/current reproduction (Stearns 1989, 1992; Roff 1992). The energetic costs of reproductive investment are typically obvious, and have been well studied (Stearns 1989; Harshman and Zera 2007), but investment in traits that enhance survival can take a variety of more subtle forms (Marden 1989; Zera et al. 1997; Lochmiller and Deerenberg 2000; Zera and Harshman 2001). One set of traits that is important to survival, and ultimately fitness, is whole-organism performance (Irschick et al. 2008; Husak 2016), which is defined as the ability to use dynamic actions to accomplish some task that is important to fitness (Bennett and Huey 1990; Irschick and Garland 2001; Husak et al. 2009). The ability to run quickly from a predator, move slowly over long distances while foraging, be maneuverable in flight, or crush food with a forceful bite can be the difference between high or low survival probability. However, such whole-organism performance traits do not come without costs and are thus subject to life-history trade-offs (reviewed in Lailvaux and Husak 2014).
To fully understand how performance traits may be involved in life-history trade-offs, and thus influence the evolution of other life-history traits, one must first understand both the costs of performance traits and the costs associated with different abilities for a given performance trait. Although there may be costs associated with increased predation risk or injury for those who use their performance traits more often than others, we focus here on costs associated with resource allocation to performance, since that may directly lead to trade-offs with other traits. These “costs” of performance traits can generally be thought of in two ways: they have an energetic cost associated with building and maintaining the structures and molecular pathways associated with the trait; and they have an energetic expense that is paid only during use of the trait. These two different ways of approaching the costs of performance are analogous to what Clark (2012) described as the “joule cost” and “power limits” of courtship displays, respectively, in a sexual selection context. This dichotomy can be dissected further to include development costs, production costs, and maintenance costs (Fig. 1) as has been applied to receiver-independent costs of animal signals (reviewed in Searcy and Nowicki 2005). Development costs are incurred during the time that the performance trait is built during development, which can be before the trait is even used (e.g., in utero or in ovo). Production costs are incurred when the performance trait is used, and this is analogous to an energetic expense as described above. Maintenance costs are incurred while maintaining the performance trait after it has developed, even while it is not in use. These would correspond to the cost of growing bone and muscle required for performance (development cost), the energetic expense of employing that performance trait (production cost), and the cost of maintaining the tissues after built to continue to use that trait (maintenance cost).
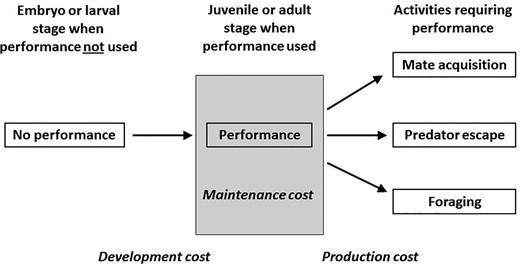
Schematic of costs associated with performance traits. Development costs occur while the morphology and physiology underlying the trait are being built during development before the trait is used. Production costs occur when the performance trait is used. Maintenance costs occur after the performance trait is developed and are required to maintain the function of the performance trait, even when it is not in use. These assume the trait is fixed with no plasticity after development, but any increase in use of the performance trait that results in performance enhancement may result in additional development and maintenance costs, as well as production costs (see Fig. 2). For example, there are development costs late in life for digestive tissue and function in snakes (Secor and Diamond 1998), seasonal jaw muscle hypertrophy in lizards (Irschick et al. 2006), and brain structures involved in singing only during the breeding season in birds (Tramontin et al. 2000).
The line between development and maintenance costs may appear ambiguous in some cases, especially given the plastic nature of many performance traits during use and disuse, but careful consideration of when and how the cost is incurred will determine which type it is. For example, an increase in activity or use of the trait (i.e., “exercise”) will enhance the performance trait, resulting in more development costs, potentially followed by higher maintenance costs (Daan et al. 1990; Speakman and Selman 2003; Konarzewski and Ksiazek 2013). However, the change in the nature of these costs will be determined by the relationship between basal/standard metabolic rate (BMR/SMR) and energy budget (daily energetic expenditure, or DEE) and the energy management strategy employed by the organism (Careau et al. 2008; see also Careau and Garland 2012, 2015; Mathot and Dingemanse 2015; Careau 2017). Under the “allocation model”, DEE is fixed, and increases in BMR/SMR will reduce expression of other traits. Under the “independent model”, DEE does not constrain BMR/SMR or other trait expression directly. Finally, the “performance model” predicts the scenario above, where greater BMR/SMR results in a higher capacity to mobilize energy for expression of other traits. We have modified these energy management models to consider costs of performance when use of the trait increases, causing performance enhancement and subsequent changes in the phenotype (Fig. 2; note that “activity” is contained within Other so that the focus is on performance). Energy expenditure may remain unchanged, and any increases in performance and associated changes to BMR/SMR will result in phenotypic trade-offs, as in the “allocation model” (Fig. 2, left). Alternatively, energy expenditure may increase along with increases in performance and the metabolic changes associated with performance enhancement, as in the “performance model” (Fig. 2, right). Both scenarios assume that increased use of performance results in increased production costs (differences “A” in Fig. 2) that lead to increased maintenance costs (differences “B” in Fig. 2) after the new metabolic machinery and tissues necessary to support enhanced performance are built via development costs (areas “C” in Fig. 2). Such an assumption may not always be true as we discuss below. In any case, the timing of development and maintenance costs may strongly impact the potential for life-history trade-offs at different life stages or in different sexes or ecological contexts (Reznick et al. 2000).
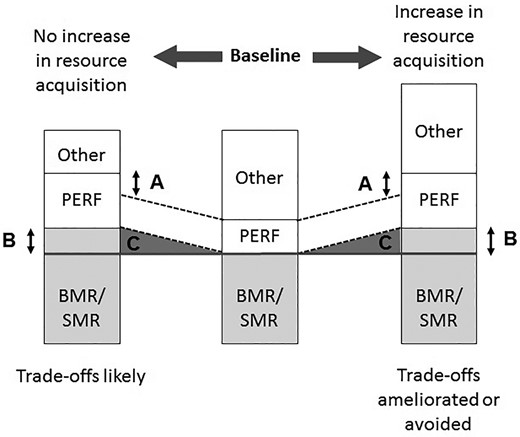
Theoretical impacts of increased activity on energy budgets and life-history trade-offs. The height of each stack on a bar represents the relative contribution of that trait to total energy expenditure. The center bar is a baseline condition, with two alternative scenarios of increased performance use and subsequent enhancement shown in the right and left bars. The parallel dashed lines show how initial production costs of performance would be if there was no change in two different scenarios described below. Significant increases in activity will result in higher production costs (A) that result in performance enhancement. Performance enhancement occurs by alterations to morphology and physiology, which will result in higher maintenance costs (B) that are a product of additional development costs (C) as the enhanced morphology and physiology are built. If resource acquisition does not increase with activity (left), then the change in the energy budget will force life-history trade-offs such that some other aspects of the phenotype will receive less energy. If resource acquisition does increase with activity (right), then life-history trade-offs may be ameliorated or avoided. These alternative outcomes of increased performance use and performance enhancement are modifications of energy maintenance strategies as described by Careau et al. (2008; see also Careau 2017). “Activity” as used in the original models is included in “Other” here.
Each type of cost may be important during allocation decisions made by organisms, but each has potentially different time scales over which those costs are incurred, meaning that each type of cost may result in very different trade-offs. For example, if costs occur during development and before sexual maturation, then there may be little to no trade-off with reproductive traits. Considering locomotor performance traits helps to illustrate the differences among the types of costs. Muscles with large cross-sectional areas are necessary for high sprint speed capacities, which require substantial investment of protein, as well as investment in maintaining the large muscles (Atherton and Smith 2012). Thus, high sprint speed may have high development and maintenance costs, but using the muscles momentarily to escape a predator likely has a small production cost on a daily basis. Oxygen-carrying capacity and appropriate cellular components for aerobic metabolism are necessary for high endurance capacities (reviewed in Bexfield et al. 2009; Connes et al. 2013), and, once built, may have a small maintenance cost after the initial development cost, but the total cost of endurance may be greatly increased when one considers the daily production cost of endurance during sustained aerobic respiration (Taylor et al. 1987; Weibel and Hoppeler 2005; Hillman et al. 2013). A business analogy can help to illustrate this. Some companies require large initial start-up investments, but then require low daily operating expenses, whereas other companies require little start-up investment but have high daily operation costs. The questions from a life-history perspective are, which of these types of costs matters in determining life-history trade-offs, and which life-history traits are likely to be affected by each?
If performance traits share a resource pool with other life-history traits, and those traits are costly, then experimentally increasing one, without concomitant increases in energy acquisition, should result in decreases in expression of the others (Fig. 2). Although this demonstrates plasticity of resource allocation and resolution of immediate trade-offs, it can be instructive for how such trade-offs might be resolved over evolutionary time as well (Reznick et al. 2000). There are now several examples that demonstrate trade-offs between performance traits and traditional life-history traits (reviewed in Lailvaux and Husak 2014, 2017; Husak et al. 2016). For example, when green anole lizards (Anolis carolinensis) are endurance-trained on a treadmill with a constant diet, their reproductive output and immune systems are compromised (Husak et al. 2016). Indeed, data from Husak et al. (2016), when analysed across treatments, showed clear negative relationships between final endurance performance and one of two measures of immune function (Fig. 3). The likely cause of this is a reduction in fat stores and, more mechanistically, a reduction in leptin production. Indeed, supplemental leptin in a replicated study “rescued” immune function but not reproduction in females (J. F. Husak, unpublished data). This suggests that there were still not sufficient resources available to reproduce after both performance enhancement and immune system “recovery” with leptin. Interestingly, endurance training enhanced growth in both males and females, despite being a costly investment. This is likely due to increases in common mechanistic pathways (e.g., growth factors; Husak et al. 2016). Such experimental studies, often called phenotypic engineering, can be powerful tools to detect trade-offs within species (Ketterson et al. 1996; Sinervo and Basolo 1996; Zera et al. 1998), but they do not quantify what the costs are in terms of relative energetic investments.
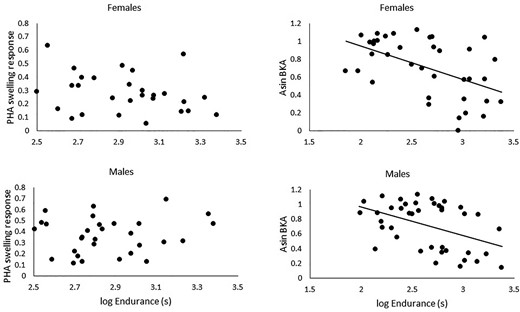
Relationships between endurance capacity and two measures of immune function (swelling response to phytohaemagglutinin (mm) and bacterial killing ability (%), BKA) in males and females. There was no significant relationship for PHA swelling response in either sex (P > 0.06 for both), but there was a significant negative relationship with BKA for both sexes (females, F1, 35 = 12.66, P = 0.001; males, F1, 38 = 9.46, P = 0.004). Data are from Husak et al. (2016).
Estimating costs of performance
Here, we discuss several possible ways for investigators to quantify costs of whole-organism performance traits so that they can be included in future analyses of life-history trade-offs.
Direct performance values
Perhaps the simplest way to test for trade-offs among traits is to use the values for those traits, corrected for body size. If one detects negative correlations between traits, then a trade-off is implied and costs can be inferred (Stearns 1989). In this scenario, traits like longevity, age at first maturity, and relative clutch/litter size would be included in a dataset with maximal whole-organism performance traits, such as burst speed, endurance capacity, and bite-force capacity (e.g., Veasey et al. 2001), each of which is presumed to impact on fitness (Irschick et al. 2008; Lailvaux and Husak 2014; Husak 2016). At first this approach may seem to miss actual energetic costs of high performance, and indeed it may, but it is fundamentally no different than including traditional life history traits in analyses that test for trade-offs (Stearns 1989, 1992; Roff 1992). All such measures, whether they be clutch/litter size, longevity, age to maturity, size at maturity, or offspring size, assume that the metric used reflects the true energetic cost of the investment, though for some of these traits that estimation is more direct (e.g., clutch mass) than others (e.g., longevity). This assumption is likely no more violated for performance traits than it is for many other life-history traits historically studied.
While this approach may reveal potential trade-offs, it does not reveal the cause of those trade-offs or whether negative relationships between traits are due to direct energetic trade-offs or correlated evolution of traits for other reasons. We discuss this issue below with an example in lizards.
Metabolic rate measures
Living organisms must always expend energy on at least a bare minimum of basic cellular processes that maintain homeostasis (Hulbert and Else 2000). Typically, these expenditures are measured as basal metabolic rate (BMR; for endotherms) or standard metabolic rate (SMR; for ectotherms), and represent the lowest amount of energy expended during a period of inactivity (and thermoneutrality in endotherms) while post-absorptive, and non-reproductive (McNab 1997; Careau and Garland 2012). Maximum metabolic rate (MMR) is the highest metabolic rate that an animal can sustain for some period of time, typically measured during forced activity, such as running, swimming, or flying (Weibel and Hoppeler 2005). Related to MMR is aerobic scope, which can be expressed as the absolute amount of energy available above maintenance costs that can be applied to short-term processes that require aerobic metabolism (absolute aerobic scope, AAS = MMR – BMR or SMR) or the multiplicative factor by which an organism can increase metabolism over maintenance costs to perform short-term processes that require aerobic metabolism (factorial aerobic scope, FAS = MMR/BMR or SMR). Finally, field metabolic rate (FMR) or daily energy expenditure (DEE) represents the total energy expended over a 24-h period during normal activity, and often includes free-ranging animals engaged in unknown behavior that may involve locomotion, foraging, social interactions, and/or digestion (Speakman 1997; Nagy 2005). The additional energetic costs represented in FMR/DEE versus BMR/SMR are often attributed vaguely to “activity”, but of course can comprise other energetic costs beyond those incurred by performance alone.
While these measurements can tell us a great deal about energy requirements for animals in a variety of contexts, they are largely inadequate as a sole estimate of performance costs. BMR/SMR measures will include the maintenance cost of structures needed for performance, such as muscle, bone, and cellular components for metabolism, but those costs are only some (typically unknown) fraction of BMR/SMR. Additionally, BMR/SMR measures will not, by definition, capture production costs of performance, and, unless properly taken, development costs. However, resting metabolic rate (RMR), the lowest amount of energy expended during a period of inactivity, but with one of the criteria for BMR or SMR violated (Careau and Garland 2012), may be useful. One could compare BMR before and after training to RMR during training to potentially reveal the development cost of performance. This idea is explored below. Conversely, DEE measurements do not distinguish the maintenance costs of performance from its production costs, since both are included in the measure. MMR and aerobic scope will only capture production costs of certain performance traits, such as endurance capacity, but not others, such as those that may be largely anaerobic (e.g., sprint speed, bite force). Nevertheless, these measures are useful in combination with others as we discuss below.
Ecological cost of transport
The ecological cost of transport (ECT) is expressed as the percentage of daily energy expenditure (DEE) spent moving. This measure requires estimates of daily movement distance (DMD), the incremental costs of locomotion (ICL; Taylor et al. 1970; Garland 1983), and daily energy expenditure (DEE), and is calculated as: ECT (% DEE) = 100 * DMD (km/day) * ICL (J/km)/DEE (J/day). To estimate ICL, one must determine the energetic cost of movement at different speeds, and the slope of the relationship between energetic cost and movement speed represents ICL. Thus, ECT includes production costs but does not distinguish maintenance costs from other expenditures in DEE. Development costs are also not included. When applied to mammals, it is obvious that ECT is quite variable among species (ranging from 0.19% to 28%) and can be a substantial portion of daily energy expenditure, especially for carnivores. For example, ECT is 24% and 28% of DEE for striped hyenas (Hyaena hyaena) and tigers (Panthera tigris), respectively (Lailvaux and Husak 2017).
As a measure of locomotor performance costs, ECT may be a very useful measure. However, ECT is a univariate consideration of general locomotor performance costs and does not include other potentially important performance traits that are not related to locomotion, such as bite-force performance, that may influence energy expenditure and acquisition. Nevertheless, one could theoretically calculate a similar ecological cost of performance (ECP) for any performance trait that is expressed as a percentage of DEE. One need only to determine the incremental cost of using the performance trait and combine it with the use of the trait in nature. This could be challenging, as we illustrate with a hypothetical example of bite force. The energetic cost of biting with different strengths over some time period could be measured with respirometry and force transducers, yielding a slope, which equals the incremental cost (J/N). The more challenging piece is daily biting forces, where one would need to determine the average amount of force used by individuals while biting. If one can determine the hardness (i.e., force to crush) of dietary items, and the frequency of those items in the diet, then one could calculate a reasonable estimate of ECP if DEE is known (This approach could also allow whether prey energy content is worth the energy expended by comparing the energy used to the energy gained: do larger prey items that are harder to crush contain more energy?). The procedure of calculating ECP could be repeated for all performance traits of interest to build a performance energy budget as a fraction of DEE, but it is no small undertaking!
Metabolic changes after long-term training
Costs associated with building and maintaining structures that underlie performance traits can presumably be determined by experimentally increasing those performance traits with exercise training and measuring subsequent changes in BMR/SMR (reviewed in Speakman and Selman 2003). Long-term exercise training increases levels of aerobic enzymes in cardiac and skeletal muscle (Moraska et al. 2000; Houle-Leroy et al. 2003), which generally increases BMR in non-human animals, primarily due to an increase in metabolic output per unit of weight, despite decreases in body mass and fat mass (reviewed in Speakman and Selman 2003). Changes in BMR/SMR can be determined for most types of performance traits where an animal can be induced to increase the use of it. This approach, if done appropriately, is also a potentially good way to disentangle maintenance costs from production costs of using the performance traits. Examining how BMR/SMR changes during the course of training can capture new development costs, and the difference in BMR/SMR after training from baseline can capture maintenance costs per unit of performance increase. Production costs can be estimated during the course of training while the animals are performing. When conducting such studies on change in BMR/SMR, it is critical that there is sufficient time after training has ceased before measuring metabolic rates, since there is typically a temporary post-exercise period of elevated metabolic rate called excess post-exercise O2 consumption (EPOC) that can last up to 48 hrs in trained humans (Dolezal et al. 2000), though in general EPOC declines quickly within 2 h (Binzen et al. 2001). Measuring EPOC gives more insights into production costs, but it should be measured separately from the longer term increases in BMR/SMR after exercise that estimate maintenance costs.
Despite the potential positives this approach brings, there are several potential problems. First, the ecological relevance of such experimental performance enhancement through forced exercise is unclear. Second, from the limited data available, there seems to be a different metabolic response to voluntary versus forced exercise training (Moraska et al. 2000). Third, the limited studies performed to date have provided mixed results as to whether there should be straightforward increases in BMR/SMR. With regard to the first problem, there is very little knowledge about whether animals “exercise” in nature or not and what purpose, if any, it might serve (Meijer and Robbers 2014; Halsey 2016). However, there are many possible reasons for sustained increases in activity due to a shift in life-stage (e.g., sedentary to dispersing: Stenseth and Lidicker 1992; Nathan et al. 2008; Arnold et al. 2017), mating strategy (e.g., mate searching: Stockley et al. 1996; Duvall and Beaupre 1998; Shillington and Peterson 2002; Stark et al. 2005; Moya-Laraño et al. 2007), migration status (Hedenström and Alerstam 1995, 1996; Nilsson et al. 2013, 2014), or predator/prey abundance (Brown and Kotler 2007; Wilson et al. 2015), all of which are relevant to an organism’s life history. If compensatory mechanisms have not evolved to reduce the cost of the increased activity or the plastic response to increased activity, then trade-offs may be inevitable.
An example with lizards
As an illustration of the first approach mentioned above, we tested for performance-life-history trade-offs among phrynosomatid lizard species using raw performance values as our measures of investment in the performance traits. Although lizards as ectotherms generally have lower metabolic rates than endotherms (e.g., Nagy 2005), lizards provide a conservative test that whole-animal performance traits can be involved in life-history trade-offs. We combined previously published life-history data (Zúñiga-Vega et al. 2016) with metabolic and locomotor performance data (maximal sprint speed and endurance capacity) we compiled from the literature (Andrews and Pough 1985; Huey et al. 1990; Garland 1994; Jayne and Ellis 1998; Garland 1999; Angilletta et al. 2002; McElroy and McBrayer 2010; Albuquerque et al. 2015; Scales and Butler 2016). Since the vast majority of such performance data are from males, we had to assume that within species variation in performance was smaller than among-species variation, an assumption that is likely true for most species included (Lailvaux 2007; Van Damme et al. 2008). Although lizards have long been popular study organisms for both life-history and whole-organism performance, researchers have tended to focus on different lizard species for testing hypotheses regarding life-history and performance evolution. Consequently, our combined life-history/performance dataset contained numerous missing values. Such missing values are a problem for phylogenetic comparative analyses, and species with missing data are thus often excluded from comparative datasets, in many cases drastically reducing sample sizes. To deal with this, we analysed relationships between sprint speed and life-history traits, and between endurance and life-history traits, using the Rphylopars package (Goolsby et al. 2017) for R v 3.3.2. Rphylopars is an implementation for the R software package of the PhyloPars tool (Bruggeman et al. 2009) which allows for conducting comparative analyses on datasets with missing data by using restricted estimated maximum likelihood (REML).
We used the squamate phylogeny of Pyron et al. (2013) to extract the tree describing evolutionary relationships among the lizard species of interest. We used the multivariate implementation of Pagel’s lambda in Rphylopars to estimate phylogenetic signal in the combined lizard life-history data, the significance of which we tested for using log-likelihood ratio tests. We used both Akaike information criteria (AIC) and Bayesian information criteria (BIC) to choose the best fit evolutionary model for the tree from among three possibilities: a Brownian Motion random walk (BM); a random walk with a single stationary peak, modelled as an Ornstein-Uhlenbeck process (OU) (Hansen 1997; Butler and King 2004); or an Early Burst (EB) model where the net rate of evolution slows exponentially over time (Harmon et al. 2010). Because OU model fit requires an ultrametric tree, we first transformed the trimmed lizard tree using the chronos command in the ape package for R (Paradis et al. 2004). Finally, we conducted Phylogenetic Generalized Least Squares (PGLS) as implemented in Rphylopars to test for relationships in 25 species of phrynosomatid lizards between both maximum sprint speed and maximum endurance capacity (absolute values, not size-corrected; performance traits analysed separately from each other) and the following variables: female size, age at sexual maturity, clutch size, longevity, offspring size, relative clutch mass, and size at sexual maturity (as defined in Zúñiga-Vega et al. 2016). We also used similar methodology to test for a relationship between sprint speed and endurance with body size included in the model.
Including lambda as a tree transformation parameter did not improve the fit of the multivariate comparative model (AIC = 65.05) relative to the null hypothesis of a star phylogeny (AIC = 65.11; ΔAIC = 0.06, P = 0.15), indicating no significant phylogenetic signal (Revell et al. 2010). Both AIC and BIC also indicated no better fit for the OU (AIC = 66.34; BIC = 257.9), BM (AIC = 78.12; BIC = 266.25), or EB (AIC = 80.13; BIC = 271.68) evolutionary models. Thus, we present results from the model with lambda fixed to 0 (no phylogenetic signal). That model revealed no significant relationships between sprint speed and any of the considered life-history variables (F8,16 = 0.78, P = 0.63; Table 1). However, all of those same variables showed significant relationships with endurance capacity, except for age at maturity which was marginally non-significant. Indeed, life-history collectively accounted for 67% of the variance in endurance capacity across phrynosomatid lizards (F8,16 = 7.29, P < 0.001; Table 1). There was no relationship between sprint speed and endurance with body size included as a covariate (R2 = 0.014, P = 0.33), agreeing with previous tests for this relationships (Albuquerque et al. 2015).
Results of phylogenetic least squares analyses using lambda = 0 (i.e., no phylogenetic signal) to test for relationships between sprint speed (left) and endurance capacity (right) and the considered life-history variables across 25 phrynosomatid species. Bold values indicate significant relationships.
| Sprint speed | Endurance | |||||||
|---|---|---|---|---|---|---|---|---|
| Variable | Coefficient | Std error | Z-value | P | Coefficient | Std error | Z-value | P |
| Intercept | –12.1 | 41.91 | ||||||
| Female size (mm SVL) | 3.06 | 3.21 | 0.95 | 0.36 | –7.3 | 3.06 | –2.39 | 0.03 |
| Age at maturity (months) | 0.28 | 0.48 | 0.59 | 0.57 | –1.13 | 0.55 | –2.03 | 0.06 |
| Clutch size | –0.37 | 0.53 | –0.71 | 0.49 | 2.95 | 0.61 | 4.83 | <0.001 |
| Longevity (years) | –0.26 | 0.37 | –0.68 | 0.51 | 2.50 | 0.44 | 5.69 | <0.001 |
| Offspring size (mm SVL) | –0.08 | 1.02 | –0.08 | 0.94 | 4.00 | 1.00 | 3.99 | 0.001 |
| Relative clutch mass | 0.15 | 0.46 | 0.33 | 0.75 | –3.10 | 0.57 | –5.41 | <0.001 |
| Size at maturity (mm SVL) | 0.96 | 1.66 | 0.58 | 0.57 | –10.04 | 1.66 | –6.04 | <0.001 |
| Standard metabolic rate | –1.22 | 1.16 | –1.05 | 0.31 | 4.3 | 1.11 | 3.92 | 0.001 |
Our results suggest that lizard species with high endurance capacity have low relative clutch masses and a small size at maturity, but live longer and have larger offspring and higher SMRs. Lizards have been the subject of study for life-history evolution for over 40 years, yet, our results shed new light on how the integrated phenotype has evolved in this group. Early studies (e.g., Vitt and Congdon 1978; Vitt and Price 1982) suggested that there is a continuum of strategies with two extreme ends: high relative clutch mass, slow, stocky-robust body shape (e.g., horned lizards in the genus Phrynosoma) versus low relative clutch mass, fast, slender body shape (e.g., whiptails in the genus Aspidoscelis). Further predictions were that large clutches should not be found in widely foraging species because of the cost of carrying those clutches during predator escape or while foraging. Sit-and-wait foragers, on the other hand, should not have this same cost, since they move more rarely and for less time. Relative clutch mass should be low in widely foraging species and should vary little among individuals or species of that strategy. Thus, relative clutch mass should represent a trade-off between the advantages of investing heavily in current reproduction at a given time and the costs associated with reproducing to foraging success and/or predator escape. Many of these predictions were framed in terms of sprint speed, and not endurance, but our results in the species studied suggest that it is endurance that may be key. Although lizards generally (with the exception of varanids) have poor endurance capacities, Garland (1999) showed that lizards exhibit marked interspecific variation in their endurance capacities, which covary with their typical locomotor activity levels in nature. The costs associated with reproduction in lizards may be greater for those who rely on constant, lower speed movements (i.e., endurance) compared to “sprinters” that may be able to compensate for reduced speed with behavioral shifts (Husak 2006). The positive association between endurance and SMR support the notion that high endurance capacity is costly and at least partly explains lower relative clutch mass in these species. Future work with more complete datasets will help to more directly test this hypothesis.
Future prospects
Performance traits are costly, and are likely to be involved in life-history trade-offs. What we currently need is a dissection of how and when costs are incurred, as this knowledge will better inform what trade-offs are likely and why. Costs of performance can be manifested during development before the trait is used, and then later during use, as well as just to maintain the underlying tissues that support the traits (see Fig. 1). There are potentially many ways to measure these costs, but no one way is sufficient. Ideally, one could calculate a multivariate ecological cost of performance measure similar to the univariate ecological cost of transport (Garland 1983) as described above, but even this has issues to address. Since there is often a masking effect of “overall good performers” in datasets that include multiple performance traits, a multivariate approach should be taken where possible (e.g., Van Damme et al. 2002; Wilson et al. 2014; Walker and Caddigan 2015; Careau and Wilson 2017). Such an approach may reveal performance continua among species similar to that seen in the fast-slow continuum along the reproduction-survival trade-off (see Lailvaux and Husak this volume). However, the lack of such multivariate performance datasets across or within species makes it difficult to test this hypothesis yet.
Acknowledgments
This work was inspired by the symposium “Integrative Life-History of Whole-Organism Performance” at the 2017 meeting of the Society for Integrative and Comparative Biology.
Funding
The symposium was funded by the SICB divisions of DAB, DCB, DEC, DEDE, DEE, DNB, and DVM, as well as the National Science Foundation [grant # IOS-1637160 to S.P.L. and J.F.H.] and the Company of Biologists [EA1233 to S.P.L. and J.F.H.].
References
Author notes
From the symposium “Integrative Life-History of Whole-Organism Performance (SICB wide)” presented at the annual meeting of the Society of Integrative and Comparative Biology, January 4–8, 2017 at New Orleans, Louisiana.
