


Abstract
Maturity, sex ratio (proportion female by number) and length-at-age of cod in the Irish Sea were examined using data collected during groundfish surveys in spring 1992–2002. Skewed sex ratios with a predominance of males were observed in the survey catches of 2- and 3-year-old cod taken on the spawning grounds. In contrast, commercial midwater trawl catches of cod in the same area had consistently higher sex ratios, suggesting that mature males and females have different vertical migration behaviour. Estimates of proportion mature were not affected by method of capture. In a GLM analysis, the factor age explained most of the variation in maturity in each sex, whilst length, although a significant factor, explained less variation than year and region (spawning and non-spawning grounds). Maturity was observed in a variable proportion of 2-year-olds, whilst virtually no 1-year-olds and all 3-year-olds and older were mature irrespective of area or year of capture. Population estimates of proportion mature in 2-year-olds, from all years' data combined, were 0.87 in males and 0.45 in females. Estimates were higher in spawning areas than in non-spawning areas, and showed a general increase over time throughout the survey area. However, in any year, the proportion mature at age 2 varied little with length and was reduced only in the smallest fish (<40 cm) at this age in some years. The increase over time in proportion mature coincided with rising sea surface temperature (SST) and a decline in recruitment and stock biomass at high rates of fishing mortality. Mean length-at-age differed consistently between year classes, the differences being largely established in the first year of life. The fastest growth rates were apparent in very weak year classes produced in the late 1990s when SST was relatively high. The interrelationships between growth, maturity, SST and abundance are examined, and changes in growth and maturity since earlier studies in the 1970s are investigated.
Introduction
Cod have historically been an important target of commercial fisheries in the North Atlantic. Increasing rates of fishing mortality have caused serious declines in abundance in many Northeast Atlantic stocks of cod (ICES, 2003) and several stocks in the Northwest Atlantic have collapsed (Hutchings and Myers, 1994). The comparatively large size at maturity in cod can result in high cumulative fishing mortality prior to first spawning, particularly in mixed demersal fisheries with relatively small mesh sizes and no constraints on discarding. Knowledge of size and/or age at maturity is therefore an important input to fisheries management (Trippel and Harvey, 1991).
The age and length at which cod reach maturity increase from 2 years and 40 cm in the Southern and warmer parts of their range (George's Bank and the Baltic) to 7 years and 75 cm at the northern limit of their distribution in the NE Arctic (Hislop, 1984; Brander, 1994a). Growth rates of cod also vary with latitude, exhibiting a positive correlation with sea temperature (Brander, 1995; Dutil et al., 1999). This reflects the growth rates of cod maintained at different temperatures in captivity (Jobling, 1988). Male cod generally mature at a younger age and smaller size than females do (Hislop, 1984; Brander, 1994a), but there is no published evidence for sexual dimorphism of growth. Delayed maturity in high-latitude stocks of cod is the expected trait for species in which the mortality rate of adults is low, somatic growth continues throughout life and fecundity increases with size (Wootton, 1990; Takada and Caswell, 1997). Females in Southern cod stocks, inhabiting sea areas with temperatures reaching 16°C, can produce a substantial number of eggs at an early age due to rapid growth and early maturity. This may confer selective advantage if life expectancy is reduced in these areas.
Marshall et al. (1998) emphasize the need for time-series data on maturity and fecundity so that fish recruitment can be related to egg production rather than surrogates such as spawning stock biomass (SSB). In most scientific assessments of European marine fish stocks, including Irish Sea cod, SSB is calculated using the same maturity ogive for each year, and the effect of size- or age-composition of mature fish on population fecundity is ignored. Substantial changes over time in the age at maturity have, however, been recorded in stocks of cod, including reductions of up to 50% over time periods as short as a decade (Oosthuizen and Daan, 1974; Beacham, 1982; Ponamorenko and Yaragina, 1995; Trippel et al., 1997). This could be a density-dependent response to declining abundance (Beacham, 1982; Cardinale and Modin, 1999) or, if fishing mortality is sufficiently high, selection of early-maturing genotypes (Beacham, 1982; Trippel, 1995; Martinez-Garmendia, 1998). The success of selective breeding in aquaculture suggests that there are significant amounts of genetic variation in traits like age or length at maturity (Law, 2000). Rochet (1998) analysed population data from a range of fish stocks using multivariate and auto-regressive methods and concluded that compensatory changes in growth, age at maturity and fecundity are likely to occur following an increase in mortality rate due to fishing or natural causes.
Changes in environmental conditions, for example trends in temperature, could also influence patterns of maturity, either directly or through changes in growth (Beacham, 1982; Cardinale and Modin, 1999). Regional and inter-annual variations in growth of cod have been reported for cod stocks such as in the North Sea (Daan, 1974; Houghton and Flatman, 1980; Macer, 1983; Rijnsdorp et al., 1991). Reduced size at age was observed in many of the cod stocks in the Northwest Atlantic during periods of stock decline, but appeared to be related to changes in temperature and other environmental variables rather than stock density (Dutil et al., 1999).
Maturity and growth in Irish Sea cod have not been documented since the 1970s (Brander, 1975). Spawning of cod in the Irish Sea occurs from February to May at two main sites in the western and eastern Irish Sea (Brander, 1975; Nichols et al., 1993; Fox et al., 2000). Tagging studies have shown that cod can migrate seasonally from the spawning grounds as far as, and in some cases beyond, the northern and southern limits of the Irish Sea (Brander, 1975; Pawson, 1993; Connolly and Officer, 2001). This indicates that estimates of growth and maturity should be obtained from broad-scale surveys rather than from commercial fisheries that may target specific components of the stock. The present paper examines patterns in maturity, sex ratio, and growth of Irish Sea cod, primarily using data from groundfish surveys (GFS) carried out during March 1992–2002. The paper deals initially with spatial distribution patterns of immature and mature fish of each sex during the spawning season. Maturity at the scale of the individual is then considered through an analysis of factors influencing the probability of being mature. The paper then gives estimates of variables such as sex ratio, proportion mature, and mean length-at-age at the scale of the population. Finally, inter-annual variations in mean proportion mature at age in the population are considered in relation to stock size, size-at-age, and sea surface temperature. Changes in growth and maturity between the 1970s and 1990s are documented.
Methods
Sampling procedure
Data for this study were collected on 11 groundfish surveys of the northern Irish Sea in March of the years 1992–2002 using the RV “Lough Foyle” operated by the Northern Ireland Department of Agriculture and Rural Development. Additional data to examine gear-related differences in estimates of population structure were obtained from catches of chartered commercial vessels using midwater trawls (MWT) in February, March, and April 1995 and 2000 during egg production surveys (Armstrong et al., 2001; Anon., 2002). The gear used on all groundfish surveys was a Rock-hopper otter trawl with 17 m ground-gear, fitted with a fine-mesh (20 mm) cod-end liner. Average headline height was 3 m, and door-spread varied around 40 m depending upon depth. The survey comprised 45 fixed-position stations with standard tow distance of 3 nautical miles. Station positions are shown in Figure 1. The gear used by commercial trawlers MFV “Bonafide”, MFV “Celestial Shore”, MFV “Green Isle”, and MFV “Golden Fleece” in 1995 and 2000 was a standard commercial MWT with approximately 20 m vertical opening and 80 mm cod-end mesh, towed close to the seabed. Trawling took place on the cod spawning grounds in the western Irish Sea.
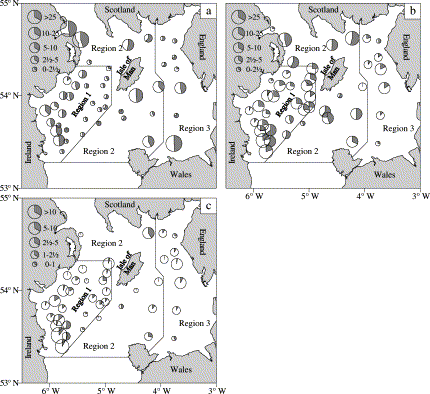
Mean catch rates (nos. per 3-mile tow) of cod during 1992–2002 groundfish surveys in spring. (a) 1-year-olds; (b) 2-year-old and older; and (c) actively spawning fish. The grey area in the pie charts represents the proportion of females.
The entire catch of cod at each station was quantified and the length distribution (total length to the nearest cm below) was recorded. Length, weight, maturity, and age were recorded for 85% of 2-year-olds and virtually all 3-year-olds and older cod taken during the groundfish surveys. Incomplete sampling of catches of 2-year-olds occurred on the relatively few occasions when large catches were taken. A third of the catch of cod smaller than 30 cm, mainly 1-year-olds, was retained for biological analysis, and sampling was not always random. However, the length distributions of 1- and 2-year-olds sampled for age and maturity were close to those in the total catch over the 11 surveys. In total, 3849 cod were sampled for biological analysis out of a total catch of 6082 fish (Table 1). Length, sex, and maturity stages were recorded for 905 cod taken by MWT in 1995 and 2000, and most fish were aged.
Summary of number of cod sampled for sex, maturity, and age determination during groundfish surveys in March. Mean annual temperature at the “Cypris” station off SW Isle of Man and stock abundance data are also given by year.
| Year | Age | 1990 | 1991 | 1992 | 1993 | 1994 | 1995 | 1996 | 1997 | 1998 | 1999 | 2000 | 2001 | 2002 |
|---|---|---|---|---|---|---|---|---|---|---|---|---|---|---|
| Region 1 | 1 | 35 | 20 | 83 | 93 | 38 | 61 | 22 | 15 | 78 | 56 | 59 | ||
| 2 | 59 | 212 | 19 | 81 | 117 | 111 | 157 | 78 | 60 | 259 | 98 | |||
| 3+ | 64 | 47 | 52 | 14 | 67 | 42 | 31 | 90 | 37 | 17 | 201 | |||
| Region 2 | 1 | 10 | 2 | 4 | 12 | 31 | 31 | 6 | 4 | 56 | 16 | 28 | ||
| 2 | 47 | 72 | 6 | 35 | 14 | 74 | 62 | 21 | 4 | 40 | 22 | |||
| 3+ | 6 | 0 | 4 | 2 | 1 | 7 | 3 | 18 | 3 | 1 | 8 | |||
| Region 3 | 1 | 169 | 3 | 48 | 18 | 28 | 14 | 11 | 0 | 19 | 36 | 6 | ||
| 2 | 8 | 18 | 3 | 10 | 21 | 42 | 97 | 22 | 6 | 42 | 19 | |||
| 3+ | 8 | 3 | 10 | 1 | 5 | 8 | 5 | 21 | 5 | 1 | 19 | |||
| Temperaturea | 10.7 | 10.8 | 10.6 | 10.7 | 11.5 | 10.9 | 11.4 | 11.8 | 11.4 | 11.5 | 11.4 | |||
| Recruitsb | 5.74 | 8.93 | 1.77 | 5.17 | 3.78 | 3.18 | 5.95 | 2.16 | 0.99 | 4.6 | 2.93 | 3.30 | ||
| SSBc | 9.23 | 6.89 | 7.38 | 6.52 | 6.16 | 4.85 | 5.95 | 5.78 | 4.97 | 5.11 | 2.31 | 3.36 | 4.93 |
Degrees Celsius, data supplied by T. Shammon, PEML, Port Erin, Isle of Man.
Recruitment in millions at age 0 (ICES, 2003).
Spawning stock biomass in kt (ICES, 2003; constant maturity ogive applied).
Allocation to age class and maturity stage
The sagittal otoliths were sectioned through the nucleus, embedded in clear resin, and viewed by transmitted light under a binocular microscope. Ages were allocated according to the number of translucent (winter) rings. As the surveys took place close to peak spawning, ages were allocated as integer years. Seven maturity stages were distinguished using macroscopic appearance of the gonads (Bowers, 1954). Males were considered mature when they had started producing clearly detectable amounts of milt or were recently spent. Females were considered mature if vitellogenesis had proceeded sufficiently for yolked oocytes to be visible to the unaided eye or if the fish were recently spent. This definition of maturity was considered appropriate for surveys taking place close to the peak of spawning, and was supported by histological studies of ovary development in Irish Sea cod and plaice in 1995 and 2000 (Armstrong et al., 2001; Anon., 2002). In these studies, close agreement was obtained between the classification of mature and immature females made visually at sea and using histology. Whilst some fish can abort ovary development at the commencement of the spawning season and undergo extensive atresia of oocytes, cod in this condition were rare in 1995 and 2000. Such fish may be classified macroscopically as mature although they do not contribute to spawning. Hence, the present study effectively considers “potential” maturity (Gerritsen et al., in press) and in this sense is comparable with historical studies on maturity which have in most cases been based only on visual maturity keys.
Distribution patterns
Mean spatial patterns in population structure were explored at the resolution of individual stations and age classes using catch rates averaged over all years. As the use of the raw biological sample data could introduce bias because of possible non-random sampling (mainly at age 1), a length-stratified approach was adopted. First, the proportions representing different population components (immature, mature, actively spawning, by sex) at each station were estimated for 2-cm length classes using the full time-series of biological sampling data for each age class. The proportions were then applied to the mean of the standardized catch-rates in 2-cm length classes for each age and station. Sex ratio R of cod in a catch or population estimate was calculated as the number of females divided by the total number of fish.
Factors influencing probability of maturity
To discern the relative importance of the various factors that contribute to the variation in maturity in cod, a binomial generalised linear model (GLM; Hosmer and Lemeshow, 2000) with a logit link was applied using the software package GenStat (Payne et al., 2000). The main effects year, region, age, and the covariate length were tested on the probability of an individual fish in a sample being mature. Fish aged 4 years and older were collapsed into one age category due to small sample sizes. The analysis was performed separately for males and females. Three geographic regions were specified based on known aspects of cod biology and distribution. Regions 1 and 3 (Figure 1) represent western and eastern spawning grounds, whilst region 2 is characterized by low abundance of cod eggs in spring (Nichols et al., 1993; Fox et al., 2000). The boundaries of regions 1 and 2 encompass a number of original smaller strata with similar station spacing. Covariates such as sea surface temperature (SST) and population size were not included in the model because data were not available at the level of the individual fish, and also to avoid over-complexity.
Significant main effects and interactions were included in the GLM using a stepwise procedure. Significance was evaluated at the 5% error level using the likelihood ratio chi-square test. The importance of a variable was determined according to the magnitude of change in residual deviance when the variable was introduced into the model. When modelling interactions, the related main effects and lower order interactions were retained in the model regardless of their significance.
Population estimates
Inter-annual variation in sex ratio Ra and proportion mature PMa in the population within each region was examined using the raw sample data for each age class a, and confidence limits were computed using standard estimators for binomial data. Annual estimates of mean PMa, Ra, mean length-at-age La, and standard deviation of the length-at-age distributions for the entire survey area were derived from the stratified mean estimates of abundance by sex. This required the construction of age–length keys by sex for the partially sampled age groups 1 and 2. The Kolmogorov–Smirnov test (Siegel and Castellan, 1988) was used to test for differences in the length-at-age distribution between the sexes. Inter-annual differences were tested using the Kruskal–Wallis one-way analysis of variance by ranks (Siegel and Castellan, 1988). Non-parametric tests were used because the estimates were based on raised data rather than original samples. When testing for differences in La between sexes, inter-annual variation was ignored and data from all years were combined to maintain sufficient observations.
Relationships with environmental variables
Annual population estimates of maturity-at-age and mean length-at-age 2 (L2) were examined for cross-correlation with time-series of mean SST and fish abundance (year-class strength and stock biomass). The estimate of zero proportion mature for females in 1994 was removed from the analysis because it was derived from a very small sample size and was unlikely to be robust. Monthly SST data were obtained from sampling of the “Cypris” station off the southwest of the Isle of Man (data supplied by T. Shammon of the Port Erin Marine Laboratory, Port Erin, Isle of Man). Recruitment and biomass estimates were obtained from the ICES assessment of the stock (ICES, 2003). The estimates of SSB given in ICES (2003) are obtained using a time-invariant maturity ogive and are used here as an index of overall stock biomass. Each time-series was independently analysed for auto-correlation, and cross-correlation between two time-series was assessed at relevant time lags. A binomial GLM with a logit link was then used to model proportion mature in males and females. Using a forward selection procedure the variables SST, L2, year-class strength, and SSB were examined for their contribution to model deviance. Once the main explanatory variables were identified, the first-order interactions were considered.
Results
Distribution patterns
The highest catch-rates of 1-year-old cod in the groundfish surveys, based on data combined over years, were recorded in the northeast and southwest of the survey area (Figure 1a). Estimates of R for these fish were close to 0.5 at most stations. The mean distribution of 2-year-old and older cod was less patchy than that of 1-year-olds (Figure 1b). There was a predominance of males on the spawning grounds (regions 1 and 3), whilst in region 2 estimates of R were closer to 0.5. Catch rates of cod with hydrated oocytes or running milt, indicating that spawning was imminent, were highest on the spawning grounds (Figure 1c), and the great majority of cod in this stage of maturity in the catches were males.
Factors influencing probability of maturity
GLM analysis of the GFS data showed that all factors (age, region, and year) and the covariate length had significant effects on the probability of an individual being mature (Table 2). Introducing the factor age into the model resulted in the largest reduction of deviance for both the sexes. The variable length resulted in the least reduction of deviance given by the main effects, and therefore was added to the model after the more significant factors region and year. The factor region influenced maturity of females to a greater extent than was apparent for males. Both sexes showed significant interactions between some of the main effects.
GLM analysis of effects age, region, and year and covariate length on the probability of being mature (accumulated analysis of deviance).
| Males | Females | ||||||
|---|---|---|---|---|---|---|---|
| Change | Dfa | Devianceb | Deviance ratioc | Change | Dfa | Devianceb | Deviance ratioc |
| +Age | 3 | 931.4 | 310.5*** | +Age | 3 | 1840.2 | 613.4*** |
| +Year | 2 | 69.0 | 34.5*** | +Region | 2 | 428.4 | 214.2*** |
| +Region | 10 | 56.4 | 5.6*** | +Year | 10 | 72.1 | 7.21*** |
| +Length | 1 | 6.6 | 6.6** | +Length | 1 | 22.7 | 22.7*** |
| +Year×region | 20 | 48.0 | 2.4*** | +Length×region | 2 | 20.4 | 10.18*** |
| +Length×age | 3 | 23.0 | 7.5*** | ||||
| Residual | 1301 | 607.8 | Residual | 2489 | 787.9 | ||
| Total | 1340 | 1741.1 | Total | 2507 | 3171.6 | ||
Df: degrees of freedom.
Additional amount of variation explained by adding the effects into the model in the order shown.
Based on dispersion parameter = 1.
p<0.001.
p<0.01.
Population estimates
Sex ratio
The sex ratio of cod, taken in the groundfish surveys varied by age class. The weighted mean R over the whole survey area and period declined from 0.48 in 1-year-old cod to 0.35 in 2-year-olds and 0.28 in 3-year-olds but increased again to 0.43 in 4 year-old and older cod. In all years except 1995, R was highest in region 2 where the estimates were not significantly different from the expected value of 0.5 (Figure 2). Males dominated significantly in regions 1 and 3, with R<0.3 in all years except 1995. The sex ratio of 1-year-olds was not significantly different from 0.5 in any region in any year.
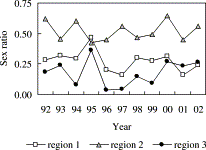
Sex ratio (proportion female, by number) of cod aged 2+ by year and GFS region.
The MWT catches in February–April of 1995 and 2000 were concentrated on the western spawning grounds (region 1). The sex ratio in these catches was consistently higher than in GFS catches in the same areas when disaggregated by age or length (Table 3). Disaggregation of the data was necessary as the size selectivity of the trawl types may differ, and R varies with size. Differences between estimates from GFS and MWT catches were more pronounced in 2000 than in 1995, when 2-year-old and older cod in the GFS catches in region 1 had an unusually high R of 0.47 compared with 0.16–0.32 in other years. The differences between MWT and groundfish survey results at age 3, when both sexes are 100% mature, suggest that males and females have different vertical migration behaviour on the spawning grounds.
Sex ratio (proportion female by number) in MWT catches in February–April 1995 and 2000 in region 1 compared to GFS catches from the same region in March 1995 and 2000. Numbers of observations are in parenthesis.
| Age | Length (cm) | |||||||
|---|---|---|---|---|---|---|---|---|
| 2 | 3 | 4+ | 45–54 | 55–64 | 65–74 | 75–84 | 85–94 | |
| MWT 1995 | 0.50 (169) | 0.56 (91) | 0.60 (225) | 0.52 (111) | 0.51 (98) | 0.47 (129) | 0.64 (187) | 0.70 (89) |
| GFS 1995 | 0.46 (59) | 0.50 (6) | 0.50 (8) | 0.38 (13) | 0.00 (3) | 0.67 (6) | 0.40 (5) | 0.50 (2) |
| MWT 2000 | 0.50 (18) | 0.69 (58) | 0.84 (51) | 0.42 (12) | 0.69 (26) | 0.70 (47) | 0.84 (31) | 0.88 (8) |
| GFS 2000 | 0.23 (53) | 0.32 (28) | 0.78 (9) | 0.22 (32) | 0.28 (29) | 0.31 (13) | 0.60 (10) | 1.00 (2) |
Maturity-at-age
Population estimates confirm the GLM analysis of data on individuals that age is a dominant factor in determining maturity in Irish Sea cod. Less than 0.5% of 1-year-olds in the GFS catches were mature, a variable proportion of 2-year-olds comprised mature fish and more than 99.5% of 3-year-olds were mature. There were large variations in proportion mature at age 2, PM2, between regions and years (Figures 3 and 4). Estimates were highest on the spawning grounds (regions 1 and 3) where most 2-year-old males were mature in all years (Figure 4). A general increase in PM2 was observed over time in males in region 2 and in females in all regions (Figure 4; Table 4). The differences between the spawning and non-spawning regions were consistent over time. Numbers of observations were relatively small in region 3, resulting in wide confidence limits. Mean values of PM2 over the whole survey period are summarized below: No significant effect of gear type could be discerned in estimates of PM at age (Table 5).
| Regions 1 and 3 | Region 2 | Whole area | |
|---|---|---|---|
| Males | 0.90 | 0.37 | 0.87 |
| Females | 0.60 | 0.24 | 0.45 |
| Regions 1 and 3 | Region 2 | Whole area | |
|---|---|---|---|
| Males | 0.90 | 0.37 | 0.87 |
| Females | 0.60 | 0.24 | 0.45 |
| Regions 1 and 3 | Region 2 | Whole area | |
|---|---|---|---|
| Males | 0.90 | 0.37 | 0.87 |
| Females | 0.60 | 0.24 | 0.45 |
| Regions 1 and 3 | Region 2 | Whole area | |
|---|---|---|---|
| Males | 0.90 | 0.37 | 0.87 |
| Females | 0.60 | 0.24 | 0.45 |
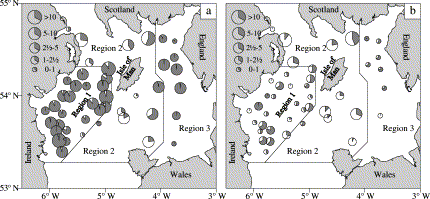
Mean catch rates (nos. per 3-mile tow) of 2-year-old cod during 1992–2002 groundfish surveys in spring. (a) Males and (b) females. The grey area in the pie charts represents the proportion mature.
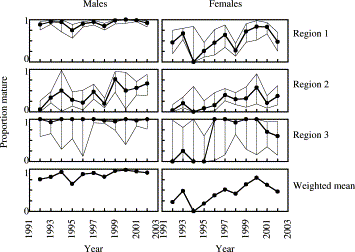
Proportion mature at age 2 in the biological samples, by sex, year, and GFS region, with 95% confidence intervals for regional estimates. Weighted means are derived from stratified mean estimates of population numbers for each sex and maturity stage.
Estimates of proportion mature in 2-year-old cod. Weighted mean values for the whole Irish Sea.
| Year | 1992 | 1993 | 1994 | 1995 | 1996 | 1997 | 1998 | 1999 | 2000 | 2001 | 2002 |
|---|---|---|---|---|---|---|---|---|---|---|---|
| Males | 0.76 | 0.81 | 0.93 | 0.65 | 0.88 | 0.90 | 0.81 | 0.95 | 0.98 | 0.94 | 0.91 |
| Females | 0.22 | 0.48 | 0.00 | 0.18 | 0.38 | 0.51 | 0.42 | 0.64 | 0.79 | 0.63 | 0.47 |
Proportion mature (PM) at age, with 95% confidence intervals, in MWT and GFS catches in region 1 in 1995 and 2000. No 1-year-olds were caught by MWT.
| Age | 1 | 2 | 3+ | |||||
|---|---|---|---|---|---|---|---|---|
| Sex | Year | Gear | PM | 95% Limits | PM | 95% Limits | PM | 95% Limits |
| Males | 1995 | MWT | – | 0.83 | 0.73–0.93 | 1.00 | 0.97–1.00 | |
| 1995 | GFS | 0.00 | 0.00–0.08 | 0.75 | 0.57–0.89 | 1.00 | 0.59–1.00 | |
| 2000 | MWT | – | 1.00 | 0.56–1.00 | 1.00 | 0.81–1.00 | ||
| 2000 | GFS | 0.00 | 0.00–0.11 | 1.00 | 0.91–1.00 | 1.00 | 0.82–1.00 | |
| Females | 1995 | MWT | – | 0.33 | 0.20–0.46 | 1.00 | 0.98–1.00 | |
| 1995 | GFS | 0.00 | 0.00–0.09 | 0.26 | 0.11–0.46 | 1.00 | 0.59–1.00 | |
| 2000 | MWT | – | 1.00 | 0.56–1.00 | 1.00 | 0.91–1.00 | ||
| 2000 | GFS | 0.00 | 0.00–0.15 | 0.83 | 0.53–0.98 | 1.00 | 0.66–1.00 | |
The weak influence of length on PM within age groups, indicated by the GLM, is seen in the population of 2-year-olds mainly at lengths below 40 cm in some years (Figure 5). Females showed more variation in proportion mature-at-length than males, reflecting the lower sample sizes caused by skewed sex ratios. Length had no influence on estimates of PM for the majority of 2-year-old fish in any year.
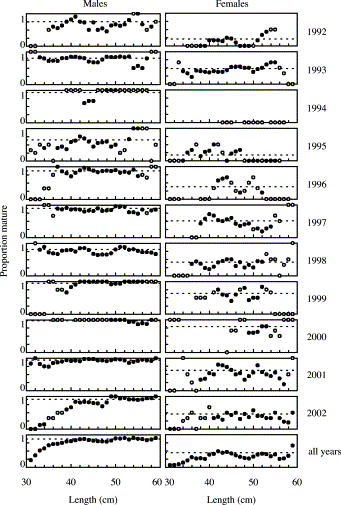
Proportion mature at age 2 in the biological samples, by length class, sex, and year. Data are running means over 3 cm; open circles indicate less than five observations.
Length-at-age
There were significant inter-annual differences in length-at-age, La, for all age classes with sufficient observations (Kruskal–Wallis one-way analysis of variance by ranks, 1-year-olds: p<0.01; 2- and 3-year-olds: p<0.001). Deviations in the La from the series means at each age were very consistent at ages 1–3 within year classes (Figure 6b), indicating that relative size-at-age is largely fixed by the age of 1. This may be due to variations in birth-date and/or early growth. The three weakest year classes (1992, 1997, and 1998) had above average La, and growth rates were higher in year classes 1997 onwards than in earlier year classes (Figure 6b).
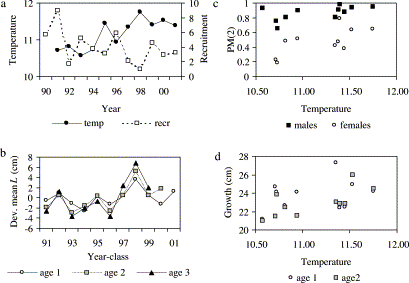
(a) Trends in sea surface temperature (SST; °C) and cod recruitment (millions of fish at age 0); (b) deviation of mean length-at-age (cm) from the series means, by year class; (c) proportion mature at age 2 vs SST; (d) mean length at age 1, and growth increment from age 1 to age 2, vs SST.
Males and females had very similar length distributions at ages 1 and 2, whilst at ages 3 and 4 the mean length of females was slightly larger than that of males (Figure 7; Table 6). Sample numbers in older fish were too low to make comparisons. The Kolmogorov–Smirnoff test was not sensitive enough to identify significant differences between the length distributions of males and females at any age. (More sensitive parametric tests were not appropriate due to the variable raising factors used in deriving the length distributions.)
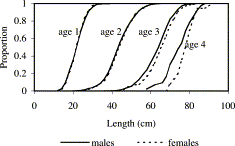
Standardized cumulative length distributions of male and female cod at ages 1–4.
Population estimates of mean length-at-age (L, cm) of cod from GFS data for 1992–2002. Also shown are first-quarter estimates from commercial landings in the 1970s from the eastern and southern Irish Sea (Brander, 1975) and from 1993 to 2001 in the Northern Irish fishery. Numbers of fish aged and standard deviation of length-at-age distributions are given.
| Commercial landings | ||||||||
|---|---|---|---|---|---|---|---|---|
| GFS males | GFS females | 1970s | 1993–2001 | |||||
| Age | L | n | SD | L | n | SD | L | L |
| 1 | 22.7 | 586 | 4.4 | 22.7 | 529 | 4.3 | – | – |
| 2 | 44.5 | 1371 | 7.4 | 44.7 | 584 | 7.2 | 45.1 | 46.0 |
| 3 | 64.1 | 505 | 8.1 | 65.7 | 193 | 8.1 | 62.9 | 65.0 |
| 4 | 76.1 | 42 | 6.9 | 79.7 | 36 | 7.7 | 75.7 | 77.0 |
| 5 | 85.8 | 9 | 7.3 | 88.7 | 6 | 7.7 | 83.0 | 85.3 |
| 6 | 89.9 | 3 | 2.7 | 90.4 | 4 | 3.1 | 87.6 | 90.4 |
| 7 | 98.0 | 1 | – | 89.8 | 2 | 2.4 | 93.5 | 96.4 |
As the length distributions of males and females at ages 1 and 2 were virtually identical (Figure 7), estimates of R at these ages are unlikely to be biased by any non-random sampling of large catches that may have occurred at these ages at some stations. The overall mean lengths at age in Irish Sea cod in the 1990s are very similar to those given by Brander (1975) from sampling in the eastern and southern Irish Sea areas in the 1970s (Table 6). Brander's data are from commercial landings samples collected in the first quarter of the years 1969–1973. Although the present data are from groundfish surveys and not commercial catches, the mean lengths at ages 2 and older are almost identical to those in samples from Northern Ireland trawlers in the first quarter of 1993–2001 (Table 6). This suggests a comparison between the present GFS data and Brander's data is valid.
Relationship with environmental variables
Both PM2 and SST increased over time (Figures 4 and 6a), although no significant auto-correlation was discernible in these or the other short time-series of year-class strength, biomass, or L2 examined. Significant cross-correlation was observed between PM2 and the other variables. For males, a significant positive cross-correlation existed at lag 0 for L2, significant negative cross-correlation at lag 0 for year-class strength and borderline negative cross-correlation at lag 1 for SSB. For females, there was borderline positive cross-correlation at lag 1 for temperature (see Figure 6c), significant positive cross-correlation at lag 0 for L2, and significant negative cross-correlation at lag 0 and lag 1 for SSB. The application of GLM showed that for males, the main variables L2 and SST at lag 1, were very highly significant (p<0.001) (Table 7). For females, the main variables L2 and SST at lag 1 were also very highly significant (p<0.001), whilst year-class strength was highly significant (p<0.01) and the interaction of L2 and year-class strength was significant (p<0.05). The variable SSB did not significantly influence maturity when analysed in combination with the other variables. Given the short time-series of observations, these results must be considered as indicative only.
GLM analysis of effects of variables L2, SST (previous year), and year-class strength (YCS) on annual mean proportion mature at age 2 (accumulated analysis of deviance). See footnote in Table 2 for header descriptions.
| Males | Females | ||||||
|---|---|---|---|---|---|---|---|
| Change | Df | Deviance | Deviance ratio | Change | Df | Deviance | Deviance ratio |
| +L2 | 1 | 52.81 | 52.81*** | +L2 | 1 | 68.23 | 68.23*** |
| +SST | 1 | 11.73 | 11.73*** | +SST | 1 | 25.01 | 25.01*** |
| +YCS | 1 | 9.65 | 9.65** | ||||
| +L2×YCS | 1 | 5.83 | 5.83* | ||||
| Residual | 8 | 15.79 | 1.97 | Residual | 5 | 25.32 | 5.06 |
| Total | 10 | 80.33 | 8.03 | Total | 9 | 134.03 | 14.89 |
p<0.001.
p<0.01.
p<0.05.
Discussion
Data quality
All data collected in the present study were from cod examined immediately after capture, using the same macroscopic criteria for maturity in each survey and the same group of personnel. (Justification for the use of visual criteria for identifying maturity is given in Methods section.) The length distribution of 3-year-old cod overlapped extensively with that of 2-year-olds and while immature 2-year-olds were found in all length classes, even the smallest 3-year-olds were very consistently staged as being mature (at the time of staging the fish, their age is unknown). This suggests a high accuracy in distinguishing between mature and immature fish.
Errors in age allocations will have components due to the variance of the birth-date distribution and interpretation of otolith structure. The standard deviation of the birth-date distribution is likely to be similar to the figure of 0.06 years for the egg production cycle (Armstrong et al., 2001). With the exception of some freshwater species, there is lack of complete validated ageing for most fish species (Moralis-Nin, 2000). Indirect validation of ageing of otoliths of Irish Sea cod is based on the observation that strong and weak year classes can be followed consistently through matrices of annual catch or abundance at age in commercial catches and research surveys. Consistency of age reading between different workers is high for cod. In 2000, an otolith-exchange exercise between four age readers at three European laboratories including the one undertaking the present study, showed complete agreement for 66 out of 67 otoliths from cod of 0–5 years of age.
Spatial patterns
The distribution of ripe and spawning cod (Figure 1c) was very similar to the distribution of cod eggs in the Irish Sea reported by Brander (1975), Nichols et al. (1993), and Fox et al. (2000). The main spawning areas were confirmed as the coastal bights in the western and north-eastern Irish Sea and to the southwest of the Isle of Man. The spatial patterns in PM2 (Figure 3) suggest that mature 2-year-olds migrate to these spawning grounds in spring, whilst immature fish of the same age mostly remain in the non-spawning areas.
As it is unlikely that the sex ratio in the population is markedly different from 0.5, the skewed sex ratios at ages 2 and 3 in the GFS catches probably reflect different patterns of behaviour or distribution between the sexes. The observation of higher estimates of R at ages 2 and 3 in MWT catches than in GFS catches on the western spawning grounds may be evidence that spawning females spend more time in midwater than males. The use of data-storage tags (DST) could provide valuable information on sex-related differences in vertical movements of spawning cod. Icelandic cod tagged by Thorsteinsson and Marteinssdottir (1998) using DSTs showed reduced vertical movements when on the spawning grounds. Unfortunately, virtually all tag returns were from male fish, so sex-related differences could not be established. A small number of DSTs returned from Irish Sea cod indicated higher levels of activity, defined as irregular or rapid vertical movements, throughout the day, than observed in North Sea cod (Righton et al., 2001).
Differences in horizontal migration of males and females can also cause skewed sex ratios in catches. Morgan and Trippel (1996) found that shoals of Northwest Atlantic cod on the spawning grounds were dominated by males, whilst females were predominant in deeper water. They suggest that males might arrive at the spawning grounds first, and that the females only join them when ready to spawn, a pattern also observed in Barents Sea cod (Ponamorenko, 1995). Older cod often spawn earlier than younger ones, whilst males can spawn over longer periods than females (Hutchings and Myers, 1993; Marteinsdottir and Björnsson, 1999). Although such behaviour patterns could explain the low sex ratio at ages 2 and 3 in the Irish Sea groundfish surveys, the MWT results indicate that vertical migration behaviour is the most likely cause in the western region. As spawning in the eastern Irish Sea probably occurs slightly later than in the west (Brander, 1994b), the very low sex ratio in this region could possibly result from delayed arrival of mature females. There are unfortunately insufficient MWT data from the shallow (<50 m) spawning grounds in the eastern Irish Sea to examine vertical patterns in sex ratio.
Tagging studies documented by Brander (1975), Pawson (1993), and Connolly and Officer (2001) show that mature cod in the western Irish Sea disperse in a predominantly southward direction after spawning and return to the same spawning grounds the following year. Some of the tags recovered outside the spawning season have been from areas to the south of the groundfish surveys, showing that the surveys do not cover the complete range of the stock occupied throughout the year. However, the timing of tag returns and the seasonal pattern of spawning (Armstrong et al., 2001) indicate that by mid-March the majority of mature fish of the Irish Sea stock are probably on or near the spawning grounds and within the boundaries of the groundfish survey. A southward extension of the survey in 2002 into the St. George's Channel provided no evidence of substantial numbers of young mature cod to the south of the spawning grounds, although these data are very limited.
Maturity-at-age
The age at 50% maturity in cod in the Southern and warmer regions of the species' range (George's Bank and the Baltic) is reported to be around 2 years (Hislop, 1984; Brander, 1994a). Cod in the Irish Sea follow this pattern and are fully mature by 3 years of age. The estimated proportion mature in 2-year-old female cod varied from 0.0 to 0.8 in the period 1992–2002, and fish in this age class contributed about 40% of the total weight of cod in the survey catches. Hence, variations in proportion mature in females can significantly impact estimates of spawning stock biomass, particularly when there is a steep age profile due to high rates of fishing mortality. The effect of variable maturity in first-time spawners may, however, be difficult to ascertain, as some studies have indicated that the eggs of such fish have poorer survival than those of repeat spawners (Solemdal et al., 1995; Trippel, 1998). The percentage of the female spawning stock biomass in the Irish Sea comprising first time spawners was estimated to vary from 40% to 75% over the survey period. These high proportions are due to the high fishing mortality of cod in the Irish Sea (ICES, 2003) and fluctuations in the estimated proportions mature.
The low overall sex ratio in 2- and 3-year-old cod in the groundfish surveys indicates that the population of females at this age was under-sampled. This could cause bias in the estimated proportion mature at these ages if the non-sampled portion of the population exhibited a different pattern of maturity. As no difference in proportion mature was discernible between GFS and MWT samples, bias is most likely to occur if significant numbers of 2-year-olds with a different proportion mature are present beyond the survey area. The abundance of such fish is presently poorly known other than from limited sampling in the southern Irish Sea during the March 2002 groundfish survey. Potential bias in the estimate of proportion mature can be evaluated by assuming that catch-rates and maturity patterns of 2-year-old cod in the southern Irish Sea are similar to those in region 2, as both areas lie beyond the main spawning grounds. By doubling the surface area of region 2 to include the southern Irish Sea, the estimate of proportion mature for the whole Irish Sea reduces from 0.87 to 0.80 in males and from 0.45 to 0.38 in females. This reduction is only moderate because the density of 2-year-old cod in region 2 is relatively low.
It is possible that there has been a decrease in the mean age at maturity of Irish Sea cod since the early 1970s. Brander (1975) sampled cod in March in the years 1971–1972 and found 38% of 2-year-old fish (n=86) and almost all 3-year-olds on the western Irish Sea spawning grounds to be mature. In the north-eastern Irish Sea, 83% of 2-year-olds and all older fish were mature. The values from the present study are slightly higher for the western spawning grounds and comparable for the eastern spawning grounds. In contrast, Brander (1975) found only 2% of 2-year-old fish to be mature in areas to the north of the spawning grounds (n=41) and none of the fish sampled at ages 3 and 4 in these areas were mature (n=11). In the present study, the average PM2 in the non-spawning areas was 24% in females and 37% in males, and all older fish were mature. Whilst this suggests the possibility of a reduction in mean age at maturity, this finding may not be robust in view of Brander's relatively small sample sizes and different sampling areas.
Maturity-at-length
In the present study, maturity was found to be predominantly a function of age. Any changes in proportion mature at length in the population as a whole resulted primarily from changes in age composition and proportion mature at age. Within an age class, length only influenced maturity at the extreme lengths and only in some years. In contrast, Hislop (1984) found that the mean length of immature 2-year-old cod in the North Sea was lower than that of mature 2-year-old fish. Oosthuizen and Daan (1974) found that maturity in North Sea cod was mainly determined by length, and that there were only small differences in proportions mature-at-length between fish of different age groups.
Growth, maturity and environment
No evidence for sexual dimorphism in growth has been reported in the many studies on North Atlantic cod (Daan, 1974; Wagner and Dethloff, 1985; Brander, 1994a; Bratty, 1997). The present study on Irish Sea cod showed no differences between sexes in the first two years of growth, but at age 3 and 4, females were on average 3 cm (<5%) longer than males. The possibility that this arises from differences in size-related catchability of the sexes cannot be discounted.
Changes in biomass are thought to have influenced growth and/or maturity in several stocks of cod in the Northwest Atlantic (Beacham, 1982; Trippel, 1995) and in the Northeast Atlantic (Houghton and Flatman, 1980; Macer, 1983; Van Alphen and Heessen, 1984). The evidence for such relationships can be equivocal, probably due to the errors associated with estimates of both abundance and mean length-at-age for the whole population as well as the influence of environmental variables, particularly sea temperature. For North Sea cod, Houghton and Flatman (1980) reported a correlation between growth and abundance and Macer (1983) and Van Alphen and Heessen (1984) found a correlation between total biomass and mean length-at-age of fish younger than 3 years. In contrast, a more recent study of the North Sea cod stock found no relationship between stock density and variations in length-at-age over the period 1967–1988 (Rijnsdorp et al., 1991).
The present study on Irish Sea cod has shown no change in average growth rates in the 1990s compared with the 1970s, and a relatively small increase in mean proportion mature, despite a substantial decline in abundance estimated from virtual population analysis (ICES, 2003). However, inter-annual variations in growth and maturity in the 1990s were relatively large, and occurred against a backdrop of increasing sea surface temperature and the occurrence of some very weak year classes. Recruitment in cod stocks at the northern end of the species' range is positively correlated with sea temperature whilst the relationship is negative in the Southern warmer-water stocks such as in the Irish Sea (Planque and Frédou, 1999). With only 11 years of data in the present study, it is difficult to disentangle the effects of size-at-age, temperature, and population abundance on maturity. Length was only a minor variable influencing probability of individuals being mature (Table 2). In any year, the proportion of 2-year-olds attaining maturity varied little over the length range of the bulk of the population at this age (Figure 5). Nonetheless, the GLM analysis of annual population data indicated that mean length at age 2 was the predominant factor explaining most of the inter-annual variation in estimates of PM2 in both male and female cod, followed by mean SST in the previous year. The relative size of cod in different year classes is largely determined by the growth rate in the first year of life, which was higher in years of above average SST in the short series, particularly in 1998 when a very weak year class was formed (Figure 6). The significant first-order interaction in the GLM for females shows the additional effect of year-class strength on the relationship between L2 and PM2 (Table 7). The growth increment in the second year of life was also largest in years of above average SST (Figure 6d). Whilst sea temperature could have a direct influence on maturation, the mean length attained at age 2 may provide a better indication of the full range of environmental conditions experienced by the fish (e.g. temperature, food supply, interactions with other fish), and which may directly affect physiology including maturation.
In Irish Sea cod, increased growth rate and reduced age at maturity could cause a compensatory increase in egg production in warm years when spawning success is likely to be poor. Trippel (1995) suggests that reduced age at maturity may provide an indicator that a fish population is coming under stress from high rates of exploitation. In the case of Irish Sea cod, the mean pattern of growth and maturation since 1992 has not differed substantially from recorded patterns in the 1970s despite increased fishing mortality and a large reduction in biomass, which reached a historic low in 2000 (ICES, 2003). It is possible that maturation is more strongly influenced by changes in abundance in stocks where partial maturity is observed over a greater range of ages and is more dependent on length than is the case for Irish Sea cod.
The authors wish to thank colleagues from the Department of Agriculture and Rural Development who have assisted in collection of data, particularly C. Burns, M. McAliskey, M. Dickey-Collas, R. Briggs, and P. McCorriston. The officers and crew of the R.V. Lough Foyle are also thanked for their assistance over the years. Thanks to T. Shammon for providing temperature data. We thank three anonymous referees for their constructive comments. H. Gerritsen was funded by the European Commission (Contract 98/090).
