-
PDF
- Split View
-
Views
-
Cite
Cite
Mika Rahikainen, Robert L. Stephenson, Consequences of growth variation in northern Baltic herring for assessment and management, ICES Journal of Marine Science, Volume 61, Issue 3, 2004, Pages 338–350, https://doi.org/10.1016/j.icesjms.2004.02.005
Close - Share Icon Share
Abstract
Growth rates of herring in the northern Baltic Sea differ among areas, and have changed substantially over time in some areas in response to environmental change. Weight-at-age of adult herring in some areas of the Finnish herring fishery fluctuated by as much as 60% over the past three decades. Elsewhere, there have been similar but more subtle changes. Growth variation has implications for stock assessment and management: differences suggest a need for considering a smaller spatial structure, at least at the scale of the ICES subdivision, in the case of northern Baltic herring. Changes in growth have an impact on the calculation and use of common biological reference points, and erode the capability of yield projections beyond the short term. Investigation of the impact of growth variation on common reference points of northern Baltic herring revealed that F0.1 was a robust reference despite the marked variability in growth, whereas Fx%SPR (e.g. F35%SPR) was less robust, depending on the definition of maximum spawning-per-recruit. Herring in different areas of the northern Baltic Sea probably require different reference points and possibly different management strategies, as a consequence of differences and variability in growth characteristics.
1 Introduction
Northern Baltic herring (Clupea harengus membras) have exhibited striking changes in growth over the past few decades. Previous authors have described an increase in mean weight-at-age of Baltic stocks from the early 1970s to the early 1980s, followed by a decrease to the original level or below (Parmanne, 1992; Raid and Lankov, 1995; Parmanne et al., 1997). Weight-at-age of adults decreased by 30–50% from the highest values in the early 1980s (Anon., 1994; Parmanne et al., 1994; Cardinale and Arrhenius, 2000). Changes in growth have been hypothesized to have been linked to “bottom-up” factors, including variation in the zooplankton community and in abundance of the clupeids grazing them (Horbowy, 1997; Flinkman et al., 1998), and “top-down” factors, such as size-selective predation by cod (Sparholt and Jensen, 1992; Beyer and Lassen, 1994; Rudstam et al., 1994). In addition to dramatic temporal changes, growth also differs among areas. The decrease in weight-at-age apparent in most parts of the Baltic could not be detected in either the Bothnian Sea (ICES subdivision 30) or Bothnian Bay (ICES subdivision 31) (Anon., 1994). This phenomenon has been related by some to asynchronous changes in hydrography in those areas compared with the rest of the Baltic. Whatever the exact mechanism, these large growth differences, and changes within and between areas, have had a major impact on the fishery (Stephenson et al., 2001a) and pose substantial problems for assessment and management.
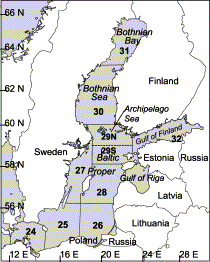
Stock assessment and scientific advice for Baltic herring are provided by the ICES (International Council for the Exploration of the Sea) Advisory Committee for Fisheries Management (ACFM; e.g., ICES, 2001a, b). Since 1998, ICES has used reference points linked to spawning-stock biomass (SSB) and fishing mortality rate (F) to provide biological advice for Baltic Sea herring that is considered to be consistent with a precautionary approach (ICES, 1998, 1999, 2000, 2001b). The scientific advice for the Baltic Sea Main Basin is for a large assessment unit (subdivisions 25–29 and 32), including also the Archipelago Sea and the Gulf of Finland (Figure 1). Biological reference points have been proposed for F, but have not been defined for SSB. For a smaller Bothnian Sea (subdivision 30) assessment unit, both SSB and F reference points have been defined. The technical basis for fishing mortality reference points is the same in both assessment units. A limit reference point (Flim) has been defined as the value of F associated with spawning-per-recruit at the lowest observed spawning-stock biomass (Floss). A more conservative functional reference point (Fpa) has been developed from Fmed, using stock-recruitment observations and spawning-per-recruit analysis (ICES, 2001a).
In this paper, we describe changes in weight- and length-at-age of herring in the northern Baltic Sea (ICES subdivisions 29, 30, and 32) over the period 1974–1997, and the differences in these life history parameters among areas. We highlight the relevance of growth variation in the perception of stock structure, stock assessment indices, and the choice of appropriate biological reference points, and consider the implications for management of Baltic herring.
2 Material and methods
Size and growth information was derived from samples of the Finnish commercial herring fishery collected annually for stock assessment purposes. Samples of length, weight, and age were collected opportunistically from commercial landings at major ports from 1974 through 1997, and are considered to be representative of the fishery (Parmanne, 1990). Maturity data were also collected, beginning in 1982. The temporal sampling unit has been quarter of the year, and spatial stratification has been based on ICES subdivisions.
The two major gear types in the Finnish herring fishery are trawls and trapnets (Stephenson et al., 2001a). The trapnet fishery takes place in the vicinity of, or on the migration route to, coastal spawning grounds, and catches primarily mature herring (Suuronen and Parmanne, 1984). In the northern Baltic Sea, all herring aged 1 year and about 50% of herring aged 2 years are immature. Trapnet samples are unrepresentative for those ages, because the gear selects only the fastest growing and maturing fraction of the stock. To avoid this problem, commercial trawl catch data for ages 1 and 2 and trapnet data for age 3+ have been used in growth investigations.
Analyses are based on data from the second quarter of the year. This is the time when herring are near spawning areas, to which they are presumed to “home”, so mixing among different (spawning) groups is presumed to be at a minimum. It is a period for which sampling from both trapnets and trawl fisheries has been intense and adequate for the analyses, and in which there is basically no growth in herring.
From 1974 to the mid-1980s, 20 trapnet samples on average were taken annually per subdivision during the second quarter. The number of samples increased to about 40 after the mid-1980s. The corresponding numbers of samples from trawls are 5 and 20, respectively. Each sample contained about 100 herring.
Body length was measured to the nearest millimetre, and wet body mass to the nearest gramme. Age was determined from otoliths illuminated from above against a dark background, using a stereo-microscope. The age of all fish was determined by a single reader.
The observed second quarter weights- and lengths-at-age were used to examine spatial and temporal variability in growth in the adjacent areas: the Bothnian Sea (subdivision 30), the Archipelago Sea (subdivision 29), and the Gulf of Finland (subdivision 32; Figure 1).
To study the impact of growth rate on biological reference points, we investigated two biological reference points prevalent in ICES: F0.1 (Gulland and Boerema, 1973) and Fx%SPR (especially F35%SPR; Mace and Sissenwine, 1993). As variability in growth changes the relationship between spawning-per-recruit (SPR) and fishing mortality, the F35%SPR was calculated in two different ways. The first was to apply the annual maximum SPR (at F=0) to obtain the annual estimate of F resulting in 35% of the maximum SPR. The second method was to apply the global maximum SPR to obtain the annual estimates of F35%SPR. Global maximum SPR is defined as the largest maximum SPR at F=0 of all calculated combinations in the input data (Rahikainen et al., 2003). The reference points were calculated from the observed mean weight-at-age, and maturity ogives over the whole range of observed growth rates for subdivisions 30 and 32, the areas displaying the greatest disparity in growth pattern in the northern Baltic Sea. The chosen fraction, 35% of maximum SPR, was adopted from ICES (2001b), but is essentially arbitrary.
A Thompson and Bell (1934) yield-per-recruit model was used. Reference point calculations were restricted to ages 1–9 years, because random variation in weight-at-age is large at older ages and could have had a disproportionate impact on the model output. Natural mortality rates (M) and exploitation patterns were adopted from a recent stock assessment (ICES, 2001b). For subdivision 30, we used M = 0.2 year−1 for all years. For subdivision 32 we used M = 0.25 year−1 in 1982 and 1983, and M = 0.2 year−1 for all other years, as done by the ICES assessment working group, to account for changes in predation. Exploitation patterns were estimated in 5–6-year periods, 1982–1987, 1988–1992, 1993–1997, to reduce the impact of random interannual variation in estimates.

3 Results
3.1 Growth
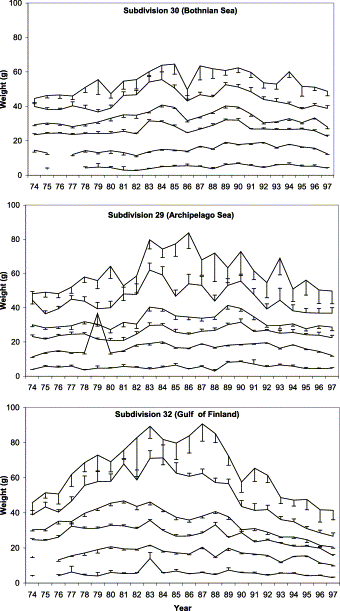
Weight-at-age of mature herring increased during the late 1970s and early 1980s, peaked in the mid-1980s, and subsequently declined through 1997 (Figure 2). Weight-at-age of immature herring (ages 1 and 2) did not change concomitantly. Although the change in growth of herring aged 3 and older is apparent in all three areas, there are marked differences in adjacent areas. Change in weight-at-age was greatest in subdivision 32 where, in the late 1990s, it was about 40% of its maximum level. Change was small in subdivision 30, and intermediate in subdivision 29.
Mean weight-at-age of herring of age groups 1–4, 6, and 8 in ICES subdivisions 30, 29, and 32 in the years 1974–1997. Vertical bars indicate one half of the 95% confidence interval.
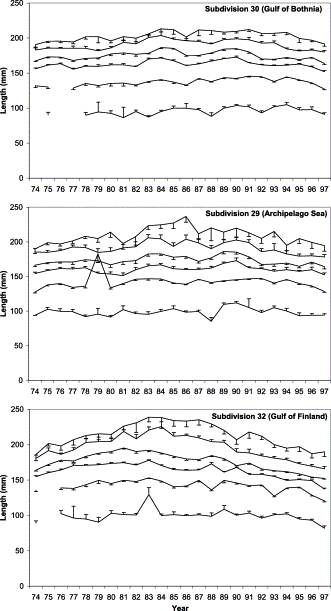
The temporal pattern of length-at-age is similar to that of weight-at-age, but less pronounced as would be expected owing to the allometric growth pattern of fish (Figure 3). Herring aged 6 and 8 in subdivision 32 were approximately 55 mm shorter in the late 1990s than at the peak in growth during the early 1980s. The relative length-at-age in the late 1990s was about 66% of its maximum level.
Mean length-at-age of herring of age groups 1–4, 6, and 8 in ICES subdivisions 30, 29, and 32 in the years 1974–1997. Vertical bars indicate one half of the 95% confidence interval.
Year-to-year variation in weight-at-age is reflected in the year effects of the linear growth model (Table 1). The main effects model is capable of explaining more than 80% of the variation in weight-at-age in spite of an apparent year × age interaction in the data. The relationship of annual variation in weight-at-age and the reference points was best represented in the main effects model while an optimal fit to data was of secondary importance to investigation.
Analysis of variance table for loge-transformed weight (g) with factors of year and age. The dependent variable is attained weight in 1–9-year-old herring in subdivision 32 during the years 1982–1997. The r2 of the model is 0.82.
| Source . | d.f. . | Sum of squares . | Mean square . | F . | p . |
|---|---|---|---|---|---|
| Model | 23 | 6 847.1 | 297.7 | 4 155.0 | <0.0001 |
| Year | 15 | 1 161.2 | 77.4 | 1 080.5 | <0.0001 |
| Age | 8 | 5 743.3 | 717.9 | 10 020.0 | <0.0001 |
| Error | 20 700 | 1 483.1 | 0.071 | ||
| Corrected total | 20 723 | 8 330.2 |
3.2 Reference points
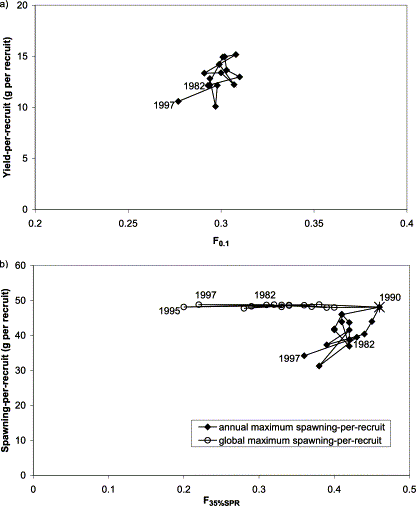
The estimated F0.1 for herring in subdivision 30 was very stable over the observed range in weight-at-age at about F=0.3 (range 0.28–0.31; Figure 4a). The stability of the calculation of F0.1 for subdivision 30 was as expected, because there was no marked change in growth, and M was assumed constant. The variability in yield-per-recruit in the same subdivision was higher, ranging from 10 to 15 g per recruit, implying a larger fluctuation in potential landings than in reference harvest rate.
Relationship between (a) F0.1 and yield-per-recruit, and (b) F35%SPR and spawning-per-recruit for herring in ICES subdivision 30. The first and the last years of the series, as well as the year of overlapping estimates, are indicated. The asterisk in panel (b) indicates an overlap in annual and global maxSPR estimates.
The Fx%SPR reference point estimates for herring in subdivision 30 were more variable than F0.1. Further, reference F values differed substantially, depending on the definition (method of calculation) of maximum spawning-per-recruit (Figure 4b). F35%SPR was relatively stable, the range being 0.36–0.46 year−1 when calculated using an annual maximum SPR. Spawning-per-recruit varied considerably as a function of F35%SPR. However, when global maximum spawning-per-recruit, “maximum maxSPR”, was applied, this reference point was markedly variable (range 0.20–0.46 year−1). The variability is due to changes in both weight- and maturity-at-age. A substantial increase in the fraction mature at age 2 contributed to the peak in 1990. Spawning-per-recruit was constant under this definition of maxSPR, and the minor variation was a result of the numerical approximation method used.
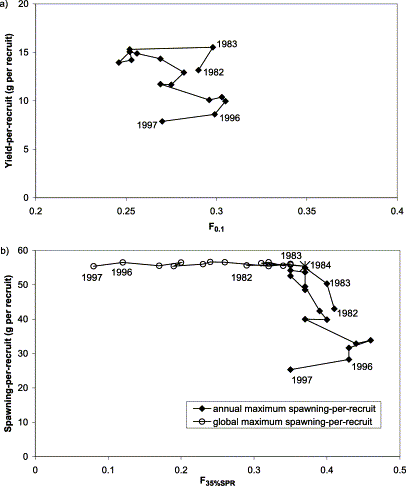
Estimates of F0.1 for subdivision 32 herring, which experienced the largest variation in growth, were also stable in the range 0.25–0.31 year−1 (Figure 5a), except for 2 years (1982 and 1983), when a higher M (derived from MSVPA) was used in the calculations. Although F0.1 increased with decreasing growth from 1984 through 1996, the change was small, especially in comparison with the overall uncertainty in the whole assessment process. The low F0.1 for 1997 was caused by a large weight-at-age of herring aged 7 in that year. This demonstrates that the reliability of growth estimates in older ages is a matter of concern when mean weight-at-age is not estimated by any growth model (von Bertalanffy, for instance), which would smooth random variation in the growth estimates. The difference between the highest and the lowest yield-per-recruit was 50%, and proportional to change in mean weight-at-age used in the model.
Relationship between (a) F0.1 and yield-per-recruit, and (b) F35%SPR and spawning-per-recruit for herring in ICES subdivision 32. The first and the last 2 years of the series, as well as the year of overlapping estimates, are indicated. The asterisk in panel (b) indicates an overlap in annual and global maxSPR estimates.
As observed for subdivision 30, variation in F35%SPR in subdivision 32 was small (range 0.35–0.46 year−1), when annual estimates of maxSPR were used, but spawning-per-recruit declined by 55% (Figure 5b) in accordance with reduced growth. Applying a global maxSPR had an effect of stabilizing spawning-per-recruit, and also tended to stabilize SSB and recruitment. The global maxSPR option resulted in very low reference Fs for the 1990s. As a consequence, associated landings would be low.
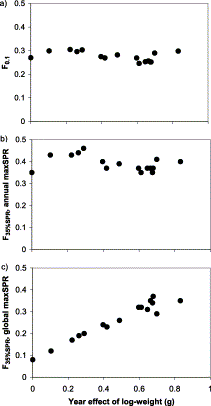
F0.1 and F35%SPR with annual maxSPR were robust reference points as a function of the changing weight of herring (Figure 6). The scatter plots are nearly identical, and only the level of reference Fs differs. Choice of a higher fraction of maximum spawning-per-recruit as a criterion would result in a value of F35%SPR closer to F0.1. F35%SPR with global maxSPR, however, had a strongly positive correlation with growth rate, suggesting the need for a reduced harvest rate when growth is slow.
Biological reference points for herring in ICES subdivision 32 as a function of growth rate (a) F0.1; (b) F35%SPR, using annual maxSPR; (c) F35%SPR, using global maxSPR.
4 Discussion
4.1 Variation in growth
Observations from the Finnish fishery confirm and extend the unusually large temporal growth variation in Baltic herring noted by others, and demonstrate that there is also substantial spatial variation in growth. Consideration of growth over the full study period confirms that the recent change is part of a fluctuation over three decades. Growth was slow at the beginning (1970s) and end of the study period (late 1990s), but rapid in the middle. Although some other Atlantic and Pacific herring stocks have demonstrated detectable changes in growth accompanying major changes in the environment or in stock size (Hay et al., 2001), and Toresen (1990) showed considerable changes in length-at-age of Norwegian spring-spawning herring, Baltic herring stocks are unique in the magnitude of temporal and spatial variation in growth.
There appears to have been little change in weight-at-age of immature (ages 1 and 2) herring. This may be due to a difference in feeding regime between juvenile and adult fish (Ojaveer, 1981a, b; Arrhenius and Hansson, 1993; Flinkman, 1999). It may also be partly a consequence of mechanical trawl codend selectivity. We estimated the degree of gear selectivity by applying the most commonly used mathematical description of towed gear selection curves (a logistic curve, e.g. Millar and Fryer, 1999), and selectivity data for trawls deployed in the herring fishery (Suuronen and Millar, 1992; Millar and Suuronen, unpublished data). For age 1 herring (observed grand mean length 98 mm) the difference in observed and population mean length is 2–6 mm, depending on codend mesh size. The bias is estimated to be a maximum of 2 mm for age 2 herring (observed grand mean length 140 mm).
Although climate signals are highly correlated in the Baltic proper and Gulf of Finland (subdivision 32), the decrease in weight-at-age in recent years has been greatest in the northern part of the Baltic proper (Cardinale and Arrhenius, 2000). Baltic herring are selective planktivores, but they may feed periodically on energy-rich nektobenthos (Raid and Lankov, 1995). The diet of herring changes from south to north in the Baltic, as the plankton communities differ in tandem with hydrographic conditions such as salinity gradient (Flinkman, 1999). The growth of herring apparently reflects this gradient: fish are generally smaller in the northern than in the southern parts of the Baltic (Anon., 1994; ICES, 2001b). In the Bothnian Sea and Bothnian Bay, stratification of the water is weak (no halocline), in contrast to the situation in the Main Basin and Gulf of Finland, and spring and autumn turnovers keep the bottom layer well-oxygenated at all times (Melvasalo, 1980). Also, zooplankton species composition differs from that in the Baltic proper because of the lower salinity (Flinkman et al., 1992).
4.2 Perceived stock structure and management units
Temporal variation in herring growth undoubtedly reflects temporal biotic and abiotic changes in the Baltic ecosystem. Spatial variation in growth, however, suggests not only spatial differences in the Baltic ecosystem, but also spatial complexity in herring stock structure. Herring growth in subdivision 30 is very different from that in subdivision 32, and growth in subdivision 29 is intermediate between the two.
Herring stock structure in the Baltic is complex, and this is manifest in different growth and other biological characteristics around the Baltic Sea (ICES, 2001c), uncertainty about herring migrations (for a review, see Aro, 1989), and uncertainty in stock assessment (ICES, 1999). Since the early stock studies of Baltic herring using morphological characters, some authors have argued for (Rauck, 1965; Ojaveer, 1980, 1989) and others against (Parmanne, 1990) the existence of different populations. Previous authors have suggested that there is a high degree of “homing” of herring to specific spawning grounds widely distributed along the coast and archipelago of Finland and neighbouring countries (Rajasilta et al., 1986). Notwithstanding, molecular genetic studies have failed to demonstrate genetic divergence within the Baltic Sea (Ryman et al., 1984; Rajasilta et al., 2000), or between the Baltic and Skagerrak and Kattegat (Andersson et al., 1981), and there is apparently no association between the variation of morphological and genetic characters (Ryman et al., 1984). While the literature on herring continues to contain studies in which stock structure is found with one approach but not with others, or where approaches are conflicting in their conclusion regarding stock structure (Waldman, 1999), it seems that herring, in general, have a more complex stock structure than recognized in stock assessment and management (Smedbol and Stephenson, 2001; Stephenson et al., 2001b; Stephenson, 2002).
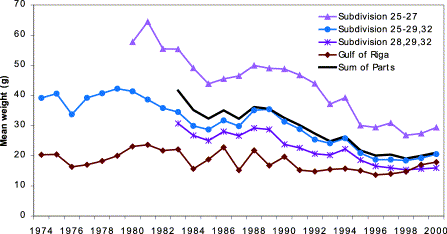
Complex stock structure could certainly account for the differences in growth noted here. Alternatively, growth patterns of herring of a single stock could differ if isolation between groups was persistent, and those groups experienced different conditions. Such areas, then, may represent separate populations (i.e. reproductively isolated), or groups of the same population (i.e. the same genetic composition), but isolated enough in their life history to cause area/time interaction in growth. In either case, there are groups of herring with different growth rates that persist for time scales of relevance to assessment and management, and there seems to be a compelling case to reconsider the spatial scales of assessment and management. Currently, there are no separate assessments for herring in subdivisions 29 or 32. The recent assessment for Baltic proper and northern Baltic proper herring was a pooled population analysis (VPA) for the area containing subdivisions 25–29 and 32. Although there have been recent attempts to assess smaller areas (ICES, 2001b), the latest management advice was based on a large area likely including several stock components. This large assessment unit is explicitly considered to be a compromise between assessment of biologically relevant unit stocks and practical management purposes (ICES, 1999). Separate assessments have been undertaken for Bothnian Sea (subdivision 30) and the Bothnian Bay (subdivision 31; ICES, 2001b). Further, herring are currently managed under two quotas (subdivisions 22–29S and 32, and subdivisions 29N, 30, and 31; ICES, 2001a), so there is a mismatch between assessment and management areas. The spatial differences in herring growth presented in this paper (Figures 2 and 3) and by the assessment working group (ICES, 2001b), indicate persistent differences in stock structure on a scale smaller than that of current assessment. Dividing large assessment units into smaller ones, as has been attempted in the recent assessment of Baltic herring stocks by ICES, reveals that the smaller “trial unit stocks” display different dynamics in growth, recruitment, and fishing mortality (Figure 7; ICES, 2001b). Use of the scale of subdivision should not only reduce the variability found by differences in growth and biological characteristics, but also allow assessment and management of stock components that are important aspects of stock structure and within-species diversity.
Mean weight (in the stock) of Baltic herring in the years 1974–2000 using trial assessment units (redrawn from Figure 11.6.1 of ICES, 2001b).
4.3 Growth variation and reference points
One obvious impact of growth variation in relation to the analytical assessment is in the calculation of biological reference points. ICES (2001d) listed some regularly used reference points. Most require weight-at-age, and therefore large changes in weight-at-age will imply that reference points will change (Sinclair, 1997). While scientists have been warning that reference points may change, managers have tended to hope for something stable. Changes in growth of Baltic herring provided an interesting context in which to examine the impact of growth on common reference points.
An assumption about M is involved in all reference point estimates. Almost all also require stock size and recruitment data, but in the northern Baltic proper, that information is not available by subdivision. The reference points that do not require stock/recruitment relationship or spawning-stock size information include F0.1, Fmax, Fx%SPR, and Zmbp (ICES, 2001d). The first two rely mostly on growth data, and the SPR reference point also on a more general knowledge of the resilience of other stocks having similar life history or taxonomic status to the stock under evaluation (Mace and Sissenwine, 1993; Myers et al., 1995).
F0.1 was relatively stable over a range in growth, even for a dynamic stock such as herring in subdivision 32, implying a nearly constant exploitation rate. Consequently, if the fishery is to be managed according to an F0.1 strategy, the quota would vary mainly as a function of stock biomass. The increase in calculated F0.1 connected with decreasing growth implies that, under a slow growth regime (and with assumed M), the stock should be fished harder owing to the trade-off against natural mortality.
Consideration of the stock/recruitment relationship can result in very different conclusions about sustainable F than if yield-per-recruit alone is considered (Winters and Wheeler, 1987; Sinclair, 1997). This is because reference points from yield-per-recruit analyses (F0.1, Fmax) do not take into account whether sufficient spawning-stock biomass is conserved to maintain recruitment in the future. On the other hand, a biomass reference point associated with a stock/recruitment constraint (Fmed) resulted in a lower F than a reference point without that constraint (Fmax) in 50% of the stocks considered by Maguire and Mace (1993). Consequently, it is reasonable to assume that, in any given application, it cannot be known whether F0.1 will be greater or less than a sustainable or optimal long-term F. Clark (1991) argued that it would be possible to calculate an exploitation rate from life history parameters that would provide a large fraction of maximum sustainable yield (MSY) for any likely stock/recruit relationship. Moreover, he found that F0.1 gives a good approximation of that rate. There were two exceptions from this rule, linked to changes in partial recruitment and maturation schedules.
Our evaluation of herring in subdivision 32 shows that the reference point calculated from an SPR analysis is dependent on the definition of maximum SPR (Figure 5). With the exception of Rochet (2000), life history parameters (growth, maturity) have been treated as fixed factors in the literature defining and developing the SPR analysis conceptually or computationally (Shepherd, 1982; Sissenwine and Shepherd, 1987; Gabriel et al., 1989; Goodyear, 1993; Mace and Sissenwine, 1993). The impact of defining and deriving maximum SPR was not an issue in any of those studies. In the case of the highly dynamic Baltic herring stocks, however, it does make a difference to the result of the SPR analysis. Defining %SPR as a fraction of global maximum SPR tends to stabilize the stock biomass, resulting in lower fishing mortality reference points as growth rate decreases. There is a potential risk in this global maxSPR approach related to the density-dependent dynamics of a population. Maintaining high abundance may cause a density-dependent decrease in growth and potential yield. Therefore, assumptions about density-dependent processes may be critical, and understanding the causal relationships of growth reduction in the northern Baltic herring stock is important. The reference points derived from annual maximum SPR, in turn, work in practice as ratio reference points, suggesting reasonably constant harvesting rates despite changes in life history parameters (Figure 6). This de facto constant harvest rate implies that SSB would decrease and potentially affect recruitment.
Clearly, care is required in defining maximum SPR. The annual and global maxSPR approaches are two sides of a coin, and must be used with knowledge of the implications in terms of risk of growth reduction vs. impaired reproduction. Global maxSPR is a highly conservative approach, but a potential solution to overcome the overly conservative output resulting from its use would be to employ an appropriate maxSPR from the distribution of maxSPRs as they vary as a function of growth. This procedure would be analogous to the concept of Flow, i.e. using a maxSPR that is the tenth percentile.
Clark (1991) proposed that a strategy of fixed exploitation rate performs reasonably well through large fluctuations in life history parameters and equilibrium abundance. According to his findings, the herring stock in subdivision 32 would be an obvious candidate for that strategy. The practical problem for any management is of course the lack of estimates of stock size and F from an analytical stock assessment for the stock. Lacking data on variation in stock size, the link between change in weight-at-age and carrying capacity (i.e. equilibrium abundance) is unclear. Changes in weight-at-age do not necessarily imply corresponding changes in carrying capacity, but it would seem reasonable to assume a positive correlation between the two parameters. If carrying capacity were to change along with weight-at-age, it would clearly not be practical or rational to attempt to maintain a certain spawning biomass level. This would mean that biomass reference points would have to vary with growth rate in order to set a limit where a fishery should be restricted to allow sufficient recruitment with respect to carrying capacity. Therefore, ratio reference points such as F0.1 and F35%SPR (for annual maxSPR) would be attractive for this herring stock. Further, following the reasoning of Clark (1991), the herring stock in subdivision 30 would be a candidate for a biomass-based harvesting strategy. That stock has exhibited only small changes in abundance (ICES, 2001b) and growth rate, and consequently there is no indication that the carrying capacity has changed markedly.
4.4 Stock assessment and projection
Growth assumptions are critical to projections of future yield, and clearly this is a problem in a situation beset with temporal changes in growth rate. Typical medium-term projections of 5 years or longer would seem inappropriate for Baltic herring because changes in growth are not predictable for the stock. Recent medium-term projections by ICES (2001b) for a 10-year period are essentially uncertain in the Baltic environment. The rationale for medium-term projections has been to evaluate the trade-off between long-term gain and short-term loss, but this assumes stability or predictability in parameters of growth, recruitment, etc. Unpredictable changes in growth of the magnitude seen in this population undermine the validity of projections beyond just a few years. Understanding the causal mechanisms underlying growth variation could reduce this uncertainty. For example, if growth variation was related to clupeid abundance, then knowledge of management goals and harvest strategies would give some information about how stock abundance and hence growth rate might develop in coming years. However, if the variation was related to the hydrography, predictions would be highly uncertain, given our inability to forecast large-scale environmental processes.
Biological reference points, by definition, are useless unless they can be compared with stock status. F0.1 and F35%SPR are of limited use if the actual F is unknown. Moreover, biomass reference points have to be operationalized (to landing quotas, for example), which is not possible without an estimate of stock biomass. An analytical assessment for herring in subdivision 32 has not been conducted since 1990, in part because the fish migrate out of the area in winter. Of course, this option could be explored with an assumption of constant rate of emigration, and in the assessment, this could be undertaken by altering M to account for it. Commercial catch rate data are available for herring in subdivision 32, but these data are generally regarded as potentially biased estimators of stock abundance, especially for schooling pelagic species (Hilborn and Ledbetter, 1985; Hilborn and Walters, 1992; Gillis et al., 1993; Gillis and Peterman, 1998). There would therefore be severe problems in matching estimates from the commercial fishery to reference points.
Weight-at-age is necessary for calculating catch-at-age from landings data and catch samples, but spatial differences could be overcome through proper matching of samples with catches on a spatial and temporal basis. Therefore, differences in growth need not preclude input of the data to VPA.
5 Conclusions
Baltic herring growth rate varies greatly, both spatially and temporally, and the implications of this for assessment and management are marked. Our analyses were intended primarily to illustrate the potential impacts of growth variability on biological reference points, and to encourage improved assessment and management of northern Baltic herring. Whether growth differences are the result of stock complexity or spatial variation in environmental parameters, it is clear that spatial patterns do need to be considered in management. The scale of assessment and management needs to be reviewed. The spatial variability in growth suggests that the assessment should be on a smaller spatial scale (e.g. ICES subdivision) than has been the case until now.
Spatial complexity is a problem if the components have differing levels of productivity (National Research Council, 1996) or are subject to disproportional fishing mortality (Stephenson et al., 2001b). The assessment problem is that migrations of herring and mixing in the fishing areas could induce spurious trends and severely bias assessment outputs if the catches cannot be allocated accurately to the corresponding unit stocks. The management problem is that populations within a large assessment unit could have different dynamics, which are masked under a pooled assessment strategy. Management of mixed stocks requires specific attention to maintenance of population richness, through such considerations as monitoring the subunits, and to maintaining the historical spatial and temporal distribution of spawning (Smedbol and Stephenson, 2001). While disaggregating management is difficult, it does seem important given the apparent differences in characteristics of northern Baltic Sea herring stocks.
Most reference points cannot be calculated for separate units currently, because analytical assessment outputs regarding stock size and recruitment are not available for groups of fish in “small” spatial units. F0.1 and F35%SPR for annual maxSPR give steady estimates of reference fishing mortality over a wide range of growth rates, but the properties of these reference points have not been adequately considered. Using annual maxSPR to calculate Fx%SPR suggests a constant harvest rate, whereas the use of a global maxSPR results in variable harvest rate and stable stock biomass. Therefore, the actual utility of these reference points for the Baltic herring fishery is still an open question.
Different areas probably require different reference points, but the most appropriate management strategies could also be different. For subdivision 30, a biomass-based strategy would seem most appropriate, whereas a ratio-based strategy would seem more appropriate for subdivision 32. Analytical assessment is perhaps not feasible for all separate units, which then should be monitored using other biological indicators, such as age structure and extent of spawning locations. The large temporal growth variation implies that projections beyond the short term remain very uncertain.
The overall management approach should be reviewed to evaluate the validity of the goals, which are currently to maintain a biologically sustainable fishery by avoiding risky harvesting rates. Maximizing sustainable landings may require a different formulation of these goals.
We are grateful for the helpful comments made by Henrik Sparholt, Sakari Kuikka, and Raimo Parmanne on earlier versions of the manuscript, and for the penetrating reviews of two anonymous referees. Finally, we thank Raimo Parmanne for authorizing the use of herring growth and maturation data.


