


Abstract
The European eel (Anguilla anguilla L.) is in severe decline: landings from and recruitment to the stock have fallen off since the mid-1960s and the early 1980s, respectively. Several hypotheses on the causes of the decline in recruitment have been advanced, some predicting an earlier decline of the adult stock. In order to narrow the range of potential hypotheses, this paper contrasts current ones with trends in abundance and length distribution of the local stock in Lake IJsselmeer (the Netherlands) over the period of the decline. The data set consists of research surveys, market sampling, gear development experiments, etc., since 1904, and is uninterrupted since 1950. A statistical analysis is designed in which sampling characteristics (length selectivity of gears and of mesh sizes, and sample selection procedures) are separated out of trends in the local stock over the years (abundance, length composition). The decline of the Lake IJsselmeer stock started in 1960, affected exploited and undersized eels, and was steeper for larger eels. The abundance of the smallest size class in the lake matches the independently recorded recruitment strength, which did not decline before 1980. Excessive exploitation, habitat loss, barriers to migration, introduced parasites, and changes in ocean climate cannot explain the observed trends when taken individually. Therefore, the cause of the decline of the local stock in Lake IJsselmeer is still a mystery and, because the historical information is limited and cannot be added to, is likely to remain so.
1 Introduction
During the second half of the 20th century, the yield of European eel (Anguilla anguilla L.) has declined severely (Figure 1a), and this decline preceded a sharp drop in recruitment (Figure 1b). There are several hypotheses for the decline (e.g. Castonguay et al., 1994; Moriarty and Dekker, 1997; ICES, 2002; Robinet and Feunteun, 2002), but without evidence of the state of the population during the period of decline, speculation is all there is. It is assumed that the decline in fishing yield since about 1965 represents a decrease in spawning stock biomass (Dekker, 2003c). Ultimately, the small spawning stock may well have been the cause for recruitment failure, possibly in combination with incidental adverse environmental conditions, but why the yield declined over several decades despite consistently good recruitment in the 1960s and 1970s is still unclear. Data series on eel fisheries are scarce, and only rarely cover more than a few years (Moriarty and Dekker, 1997). For Lake IJsselmeer (the Netherlands), data were collected in isolated years before 1950 (Redeke, 1907; Havinga, 1945), and more or less consistently since 1950. Although spawner production of Lake IJsselmeer is almost absent as a consequence of excessive exploitation (Dekker, 2000c), the data set does provide an unique opportunity to analyse the decline of the local stock in detail.
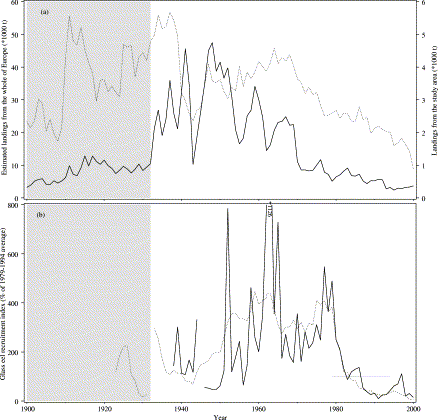
(a) Estimated landings and (b) indices of recruitment of glass eel, for the total population (dotted line), and for the study area (solid line), during the 20th century. In 1932, the estuarine study area was transformed into a freshwater lake. Data from Dekker (2002, 2003c) and original.
The gradual decline of the eel stock in inland waters was hardly noticed (Dekker, 2003b), whereas the later decline in recruitment was noted almost immediately (EIFAC, 1985). The latter elicited several explanatory hypotheses (Castonguay et al., 1994; Moriarty and Dekker, 1997), including pollution, habitat loss as a result of barrages and dams, climate change in the ocean, overexploitation, and man-made transfers of parasites and diseases. Some of these would indeed result in earlier decline of the adult stock while recruitment was still good, but others would not. This work focuses on statistical analysis of the trends in the IJsselmeer stock, and contrasts the results with proposed hypotheses.
The analysis presented covers half a century of uninterrupted sampling, and spans a full century in total. Characteristics of the estuary/lake changed considerably over the 20th century, as has the eel stock, the fishery, the aim of the sampling, the sampling gears, the selection and recording procedures, etc. Hardly any single experimental setup has been preserved for more than 10 years, while the trends in recruitment and yield typically run for several decades. In order to assess trends in the local stock over the whole time span, a composite statistical model is developed in which sampling characteristics and trends in the stock are disentangled. Through all sampling setups, the length composition of the catch has been recorded almost consistently; other biological measurements are recorded less frequently. Consequently, the analysis focuses on abundance and length composition of the local stock.
2 Material and methods
2.1 Study site, eel stock, and fisheries
Lake IJsselmeer (52°40′N 5°25′E) is a shallow, eutrophic freshwater lake, which was reclaimed from the Wadden Sea (53°N 5°E) in 1932 by a dike (Afsluitdijk, Figure 2), substituting the estuarine area known as the Zuiderzee. The surface of the lake was stepwise reduced by land reclamation, from an original 3470 km2 in 1932, to just 1820 km2 since 1967. In preparation for further land reclamation, a dam was built in 1976, dividing the lake into two compartments of 1200 and 620 km2, respectively, but no further reclamation has actually taken place. In managing the fisheries, the two lake compartments have been treated as a single management unit. The discharge of the River IJssel into the larger compartment (at 52°35′N 5°50′E, average 7 km3 per annum, coming from the River Rhine) is sluiced through the Afsluitdijk into the Wadden Sea at low tide, by passive fall.
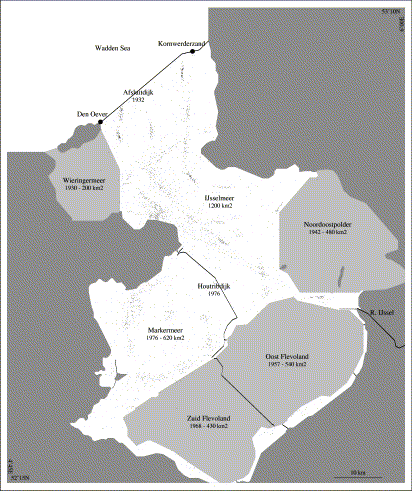
Map of the study area. Major polders and dikes are indicated, with name, year of construction, and surface area. Before 1932, the area constituted an estuary, known as Zuiderzee. Confusingly, since 1976, the name IJsselmeer applies to the northern portion and to the lake as a whole. Data points indicate the position of individual samples. Those located inside polders were taken prior to reclamation.
Freshwater fisheries developed since the closure have been and are still dominated by eel. Glass eels recruit through the sluices in the dike towards the Wadden Sea, at Den Oever (52°56′N 5°03′E), and Kornwerderzand (53°05′N 5°20′E). The abundance of glass eels in front of the sluices in Den Oever has been monitored since 1938, using a lift net (Dekker, 1998, 2002). Recruitment was low in the late 1950s, remained high until 1980, but then declined to an all-time low in 2001 (Figure 1b). Immigration of glass eels is facilitated by slightly opening the sluices during the season. Silver eels migrate through the sluices towards the Wadden Sea. There has been no artificial re-stocking of the lake with glass eels or young yellow eels.
Trawls, fykenets, eel boxes, and longlines have been used to exploit the local stock (van Densen et al., 1990). Landings of eel were <1000 t before the construction of the Afsluitdijk, rose to a peak of 4750 t in 1948, then declined in several steps to <1000 t from 1970. Since the recruitment failure in the late 1980s, the yield has never exceeded 400 t (Figure 1a). Commercial trawling was the dominant fishing technique until trawling was banned in 1970. Commercial fykenets have been used along the Afsluitdijk, for silver eels mainly. Since the mid-1970s the number of fykenets fishing for both yellow and silver eels has risen sharply (Dekker, 1991), 90% being smaller fykenets set in trains, and the balance being larger fykenets set on poles near the shore. Eel boxes were developed following the ban on trawling. A minimum legal size limit of 25 cm was established on 26 June 1911, but on 23 October 1937, it was raised to 28 cm.
2.2 Data
Data from various sources have been combined.
Samples from the commercial fishery, consisting of landings from trawls, fykenets, boxes, and longlines. Often, information on the few eels below the minimum legal size in the catch is completely lost. In most cases, sample size was fixed, and the associated effort data are not available. Before 1989, samples were collected irregularly and did not cover all gear types. Subsequently, all gear types have been sampled consistently and regularly, several times a year. Silver eels are usually distinguished from yellow eels in the catches. Although a large number of samples from the silver eel landings are available, all silver eel samples have been excluded from the current analysis, for the following reasons. First, silver eels may have been caught while migrating from higher up the River Rhine towards the sea. Second, the silvering process in itself is highly length-selective, masking information on the stock contained in the samples.
Samples from the commercial fishery before undersized eels were discarded. In such cases, the associated effort is mostly known. The objective of taking the samples varied, including for stock monitoring in support of fisheries management, and for collecting information on discards.
Research vessel survey samples. Until 1980, most research surveys for eels deployed an 8-m beam trawl with 2-mm mesh net, whereas in later years a 3-m beam electrified trawl (Deelder, 1974) has been deployed with the same mesh size. In a gear comparison experiment, both nets were fished in parallel during the late 1980s. An 8-m beam trawl with 18-mm mesh used for coarse fish surveys yielded additional information on eels, and research vessels have often collected incidental data. Most data are complete and well documented, but for many samples from the 1950s and 1960s, information is restricted to length classes below the minimal legal size of 28 cm.
In the 1950s, a series of experiments was conducted testing different mesh sizes, to adapt the herring and anchovy trawl used in the former Zuiderzee estuary to freshwater eel fisheries.
Recorded information includes gear type, number of nets, duration of fishing operation, mesh size (hook size for longlines), place and date of operation, and the number of eels per length class of either 1 cm or 1 mm. Measurements have been rounded down to 1-cm length classes, but lengths >40 cm have been lumped. Gear types were classified as: 8-m beam trawl (using dan lenoes); 3-m beam trawl (using sledges); electrified 3-m beam trawl (sledges); fykenets of any type; pots and boxes; and longlines. Samples were classified with respect to selection procedures as: unrestrained; undersized (after legal-size eels were removed); legal-size eels only; presumably unrestrained; and presumably legal-size eels only. The last two categories apply when explicit information is absent, but the length distribution definitely suggests so. Missing information on mesh size or selection procedure could often be restored, based on written notes, background knowledge of the personnel involved in the original sampling, or circumstantial evidence. For instance, while the smallest eels (<15 cm) are only caught in gear with mesh sizes ≪10 mm, and trawl mesh sizes are known to equal 2 mm or >10 mm, the presence of many small eels indicates use of a 2-mm mesh.
The abundance of glass eels in front of the sluices in the Afsluitdijk has been monitored annually since 1938 using a small lift net (Dekker, 2002). The (logarithmic) index of such recruitment (Dekker, 1998) has been used in the analysis.
All data were computerized and stored in a database. Since 1989, data entry has been completed within a few days following the field trip; older data were computerized recently from stored paper recordings. An overview of the number, size, and characteristics of the samples is given in Figure 3. In all, 5878 samples have been analysed, a total of 606 210 eels weighing 15.5 t, 0.1‰ of the commercial landings.
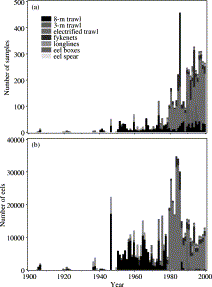
(a) Number of samples and (b) number of eels analysed by year and gear type.
Prior to 1950, data are only available for a few short ranges of years (Figure 3); from 1950 onwards, an uninterrupted data series exists, with initially an approximately exponentially rising number of samples per year. Following a brief period in the 1970s and 1980s when large numbers of eels were sampled annually, the total has stabilized at some 10 000 per year. In later years, most data are from research surveys, using an 8-m beam trawl prior to 1980, and an electrified trawl after 1980, both with 2-mm mesh. Market samples (no effort information) involved an approximately constant number of eels since 1950, but recently, many small samples have been collected rather than a few very big ones. Before 1970, it is often not certain whether or not samples were restricted to legal-size eels.
2.3 Analytical model

For each factor E, S, and N, a separate submodel is developed, selecting from the class of generalized linear models (McCullagh and Nelder, 1989). Starting from an initial best guess for all parameters, each submodel is estimated in turn, iterating until the model fit (deviance) changes by <1‰. Depending on initial parameters, this required five to ten iterations.
Because true abundance is unknown, S and N are expressed in relative terms. For S, this relates to the total catch of legal-size eels, for N to the catch of a 2-mm mesh 8-m beam trawl per hour fishing.
Explanatory class variables are gear type and selection procedure, whereas square root of mesh size serves as a continuous covariate, assumed proportional to the length of the fish being selected.

Explanatory variables include:
Gear type as a class variate, covers the relative catchability (ratio of catch rates between gears).
A series expansion of length and year, covers overall trends in abundance. In principle, higher orders in a series expansion can model details in trends, but these are not likely to be easily estimable, and are therefore excluded. The first order of length is not included, because that would alias the selectivity submodel.
Using a categorical time-series approach (Fahrmeir and Tutz, 1994), the abundance in year y−1 is included as an autoregressive variable in year y. The previous year's length class l is matched to the current year's length class l+g, to allow for g centimetres of growth. For the parameter g, a fixed value of 4 cm per year was assumed (Berg, 1990). For each y and l, abundance is calculated as the relative abundance (see below) enlarged by the mean of the residuals observed for y and l in the previous model fit. This in itself requires an iterative fitting procedure, which is integrated in the overall iteration. In contrast to the series expansion of length and year, this autoregression easily models trends observed in few length classes, for a small range of consecutive years, if they match the (assumed) growth rate.
For the smallest length class (7 cm), no autoregressive observations are available, and the recruitment index developed in Dekker (1998, 2002) is substituted. For larger size classes, this explanatory variable is always set to zero.

Effort is modelled by a generalized linear model of the number per length class in each sample, using a log link and a Poisson error distribution.

Explanatory variables include only year×sample, representing the effort per sample. In principle, this analysis does not differ from the abundance model above, and could therefore have been integrated there. However, the number of effort parameters to be estimated exceeds 1000. Solving the combined model would require computing times proportional to the square of the number of samples. Because each parameter estimate is determined by the specified offset and the data of one sample only, each parameter is estimated in turn, requiring computing times proportional to the number of samples.
For each sample, estimated effort Ê is calculated, but known effort is not replaced by an estimated value.
Each of the submodels was implemented in SAS (SAS Institute Inc., 1999), using “proc genmod”; macro-code controlled the overall iteration of the model.
3 Results
Owing to the large number of observations (191 892), even tiny correlations are statistically significant and all model terms contribute significantly to the overall model (Table 1). For the selectivity submodel, major contributions relate to gear type, mesh size, and selection procedure. For the abundance submodel, the prime explanatory variables are gear type, the autoregression, year2, and year×length. Inclusion of the recruitment index improves the model only marginally, but the regression coefficient is 0.76, indicating a rather strong relationship between the recruitment index and the few length classes directly affected by recruitment. The first and second terms of the series expansion in year are significant, but the third term is not estimable. Year2×length and year×length2 contribute little to the model. Overall, the selectivity submodel explains 25% of the variance, whereas the abundance submodel explains 84%. However, the gear effect in the abundance submodel is related to the units of effort chosen for each gear type. Subtracting the gear effect, only 24% of the remaining variation is explained.
Analysis of variance (type 1) for the selectivity and abundance submodels.
| Source | Deviance | d.f. | Mean square | F | p |
|---|---|---|---|---|---|
| Selectivity submodel: multinomial model of the length frequency distribution | |||||
| Gear type | 14 141 | 6 | 2 357 | 10 810 | <0.0001 |
| Selection | 4 140 | 4 | 1 035 | 4 748 | <0.0001 |
 | 3 342 | 1 | 3 342 | 15 328 | <0.0001 |
| Residual | 41 029 | 187 495 | 0.218 | ||
| Total | 62 652 | 187 506 | 0.334 | ||
| Abundance submodel: log-linear model of the abundance per length class and year | |||||
| Gear type | 4 716 922 | 6 | 786 154 | 153 906 | <0.0001 |
| Autoregression | 150 657 | 1 | 150 657 | 29 494 | <0.0001 |
| Recruitment index | 7 401 | 1 | 7 401 | 1 449 | <0.0001 |
| Year | 8 893 | 1 | 8 893 | 1 741 | <0.0001 |
| Year2 | 43 088 | 1 | 43 088 | 8 435 | <0.0001 |
| Year3 | No fit | 0 | |||
| Year×length | 99 726 | 1 | 99 726 | 19 523 | <0.0001 |
| Year2×length | 1 939 | 1 | 1 939 | 380 | <0.0001 |
| Year×length2 | 2 878 | 1 | 2 878 | 564 | <0.0001 |
| Residual | 979 944 | 191 844 | 5.11 | ||
| Total | 6 011 449 | 191 857 | 31.33 | ||
| Source | Deviance | d.f. | Mean square | F | p |
|---|---|---|---|---|---|
| Selectivity submodel: multinomial model of the length frequency distribution | |||||
| Gear type | 14 141 | 6 | 2 357 | 10 810 | <0.0001 |
| Selection | 4 140 | 4 | 1 035 | 4 748 | <0.0001 |
| 3 342 | 1 | 3 342 | 15 328 | <0.0001 |
| Residual | 41 029 | 187 495 | 0.218 | ||
| Total | 62 652 | 187 506 | 0.334 | ||
| Abundance submodel: log-linear model of the abundance per length class and year | |||||
| Gear type | 4 716 922 | 6 | 786 154 | 153 906 | <0.0001 |
| Autoregression | 150 657 | 1 | 150 657 | 29 494 | <0.0001 |
| Recruitment index | 7 401 | 1 | 7 401 | 1 449 | <0.0001 |
| Year | 8 893 | 1 | 8 893 | 1 741 | <0.0001 |
| Year2 | 43 088 | 1 | 43 088 | 8 435 | <0.0001 |
| Year3 | No fit | 0 | |||
| Year×length | 99 726 | 1 | 99 726 | 19 523 | <0.0001 |
| Year2×length | 1 939 | 1 | 1 939 | 380 | <0.0001 |
| Year×length2 | 2 878 | 1 | 2 878 | 564 | <0.0001 |
| Residual | 979 944 | 191 844 | 5.11 | ||
| Total | 6 011 449 | 191 857 | 31.33 | ||
Analysis of variance (type 1) for the selectivity and abundance submodels.
| Source | Deviance | d.f. | Mean square | F | p |
|---|---|---|---|---|---|
| Selectivity submodel: multinomial model of the length frequency distribution | |||||
| Gear type | 14 141 | 6 | 2 357 | 10 810 | <0.0001 |
| Selection | 4 140 | 4 | 1 035 | 4 748 | <0.0001 |
| 3 342 | 1 | 3 342 | 15 328 | <0.0001 |
| Residual | 41 029 | 187 495 | 0.218 | ||
| Total | 62 652 | 187 506 | 0.334 | ||
| Abundance submodel: log-linear model of the abundance per length class and year | |||||
| Gear type | 4 716 922 | 6 | 786 154 | 153 906 | <0.0001 |
| Autoregression | 150 657 | 1 | 150 657 | 29 494 | <0.0001 |
| Recruitment index | 7 401 | 1 | 7 401 | 1 449 | <0.0001 |
| Year | 8 893 | 1 | 8 893 | 1 741 | <0.0001 |
| Year2 | 43 088 | 1 | 43 088 | 8 435 | <0.0001 |
| Year3 | No fit | 0 | |||
| Year×length | 99 726 | 1 | 99 726 | 19 523 | <0.0001 |
| Year2×length | 1 939 | 1 | 1 939 | 380 | <0.0001 |
| Year×length2 | 2 878 | 1 | 2 878 | 564 | <0.0001 |
| Residual | 979 944 | 191 844 | 5.11 | ||
| Total | 6 011 449 | 191 857 | 31.33 | ||
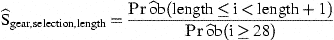
Figure 4 shows the effect of differences in gear type, mesh size, and selection procedure for the selectivity submodel. The three trawl types (3-m beam trawl, 8-m beam trawl, and electrified trawl) result in comparable length distributions; fykenets and eel boxes select larger sizes; and longlines select the largest eels. The difference in modal length among gears is never more than 1 cm. Comparison of mesh sizes of 2, 10, and 20 mm (Figure 4b) reveals larger discrepancies. Over the range 28–40 cm, the length distributions are identical. For a 20-mm mesh size, the distribution falls below 28 cm, and for a 10-mm mesh size, it falls below 24 cm. The distribution of the different selection procedures reveals a close match between known and presumed procedures. Samples selected for legal-size eels (>28 cm) do contain some undersized eels, even as small as 20 cm, and the selection for undersized eels contains a few legal-size eels, up to the top of the size range.
Length frequency distributions estimated by the model for 1980. (a) Unrestrained catch of different gear types. Nets and eel boxes with a mesh size of 20 mm, longlines with hooks of 10-mm gape width. (b) Unrestrained catch of an 8-m beam trawl, with different mesh sizes (mm). (c) Selections of the catch of an 8-m beam trawl with 10-mm mesh.
During the 20th century, the abundance and the length composition of Lake IJsselmeer eels have changed considerably. Until the 1950s (Figure 5), the abundance increased, initially most obviously at lengths ≥10 cm, but following the closure from the Wadden Sea in 1932, it increased also in the smaller length classes. Although there is great variation in the estimated densities in adjacent years, the overall trend indicates a rise in abundance of the smallest length classes (⩽10 cm) from 1900 to 1950, followed by a stable period up to 1980, but then a drastic decline in the 1980s and 1990s. Individual years track exceptionally strong (1952 and 1958) and weak (1956, years after 1980) year classes (Figure 1a); i.e. the trend in the smallest length classes largely matches the trend in recruitment. The next length class up (10–15 cm) follows the same trends, often one or two years later. Densities were high from 1950 to the early 1980s. For the 15–20 cm length class, however, densities peaked in 1960, then declined gradually until 1980, whereafter the decline was faster. The 20–25 and 25–30 cm length classes followed similar trends, but the rapid decline in the 1980s was somewhat later for the 25–30 cm length class. For that length class, an isolated peak in abundance is estimated for 1958. The abundance of the 30–35 cm length class increased until 1940, varied at a high level until the mid-1960s, and then declined gradually. Finally, length classes 35+ cm have never been abundant, though they were relatively good through the 1940s and 1950s, before declining gradually and consistently. The lowest value in the record is for 2000.
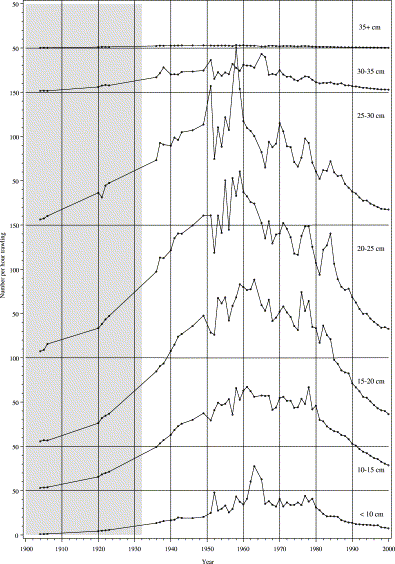
Trends in abundance over the 20th century: estimated catch of an 8-mm beam trawl with 2-mm mesh operated for 1 h, summed over 5-cm length intervals. In 1932, the estuarine area was transformed into a freshwater lake. Since 1937, the minimum legal landing size has been 28 cm.
4 Discussion
The population of the European eel is clearly in severe decline. Current results suggest that the Lake IJsselmeer stock began to decline in about 1960, affecting legal-size (≥28 cm) and undersized eels, but also that the smallest size classes remained unaffected until the recruitment failure in the 1980s (Figure 5).
To my knowledge, no previous studies on long-term trends in yellow eel stocks have been published. For the Baltic, Svärdson (1976) reported a consistent decline in catches of young eels in traps at river mouths after the 1960s, but interpreted this as a drop in recruitment from the open ocean into the Baltic.
The analytical model has largely been driven by the amount of detail available in the historical data. Details of the gear, the time of the day, the exact location being fished, and the speed of towing are simply not available for most samples. However, because eels were the target species for almost all sampling, optimal fishing conditions will have been aimed for consistently throughout the century. As the main fishing trawls have remained virtually unmodified over the decades, modern motor vessels still trawl at speeds comparable with that of old-time sailing ships. Consequently, the observed trends in catch per unit effort likely reflect variation in abundance rather than changing fishing practice. Indeed, the estimated trend for the 25–30 cm length class (Figure 5) is well correlated with the yield (Figure 1a) of the commercial fisheries (r2=0.68 for the period since the last polder construction in 1968; n=33). There are major irregularities in the results for the 1950s and early 1960s, during a period of low sampling intensity. Although uncertainties in the interpretation of historical records might have caused some of the variation in the results (Figure 5), it seems more likely that the number of samples was insufficient for averaging out stochastic variation. High stochastic variation is a recurring theme in the analysis of trends in eel abundance, and explained variance is typically less than 25% of the total variation (Dekker, 1998, 2000a, 2003a, c).
Production in continental waters is the net result of recruitment from the ocean, individual growth, fishing mortality, and other causes of death. Each of these processes might have changed over the decades, and could have caused the observed decline in production. Recruitment of glass eels to Lake IJsselmeer has been studied extensively (Deelder, 1958; Dekker, 1998, 2002), revealing a major drop in recruitment from 1980 onwards only. Growth of eel in Lake IJsselmeer has been analysed (Deelder, 1957) through the conventional reading of the age from whole otoliths, but this time-series has been discontinued (Deelder, 1976) in favour of an incorrect (Dekker, 1986) technique, and has not yet been restarted. Finally, fishing mortality has been estimated for only a few years (Deelder and de Veen, 1958; Dekker, 2000c). Consequently, the processes determining the production are poorly known, and the current analysis therefore focuses on the state of the local stock, which is assumed to reflect changes in the production processes. In other words, state variables are analysed to derive insight into changes in rate variables. Admittedly this is an indirect approach, but presumably it is the only achievable one covering such a long time span.
What process might have caused the observed decline in recruitment and abundance, reduced growth, or increased mortality? Over the period 1960–1985, the abundance of the eel length class 20–25 cm was reduced by ca. 50%. Natural mortality from the glass eel stage to the 20–25 cm length class is unknown, but could be of the order of 50% (Moriarty and Dekker, 1997; Dekker, 2000b). If a change in growth rate caused the observed decline in abundance, it should have increased to about double the former value and would have led to an increase instead of a decrease in commercial yield. Estimates of the annual growth rate of Lake IJsselmeer eels were 4.5 cm in the 1940s (Havinga, 1945) and 4.2 cm in the 1950s (Deelder and de Veen, 1958). The rate at which the recruitment failure since 1980 showed up in consecutive 5-cm length classes broadly corresponds to an annual growth rate of 4 cm (Figure 5), so there has been no obvious change. Therefore, although growth variation may not be ruled out completely, it is unlikely to have been the main cause of the decline, and by exclusion, increased mortality seems a more plausible explanation. An increase in annual (non-fisheries) mortality from 10 to 20% could have achieved the observed effect, and both these levels are within the observed range, and within confidence limits of most estimates of natural mortality of eels in inland waters (Moriarty and Dekker, 1997; Dekker, 2000b).
During the study period, nearly half the surface of the original lake was reclaimed (Figure 2), reducing the productive area for the local stock (in 1930, 1942, 1957, and 1968, respectively). According to (retired) fishers, eels inside a polder under construction are easily trapped while moving into open water. Consequently, one would expect a temporary rise in landings (if legally recorded), followed by a period of higher density in the remaining open water, where the escapees and the newly recruiting glass eels are confined to a smaller area. Landings did peak following the 1957 polder construction, but they declined following the 1968 one. However, in neither case was there a corresponding rise in stock density in the remaining area. Density-dependent mechanisms might have limited the abundance in the remaining area, but that density steadily declined either indicates that the carrying capacity was not reached, or that it dropped steadily over the years for some unknown reason. The recruitment failure in the 1980s resulted immediately in a decline in the local stock, which would be highly improbable if the stock was regulated by density-dependent mechanisms. Without density-dependent regulation, habitat loss would have had minor consequences for the dynamics of the stock.
Before the closure of the Zuiderzee from the Wadden Sea in 1932, smaller eels (<15 cm) were relatively scarce. Glass eels arriving at the continental coasts use selective tidal transport to migrate into estuaries and rivers (Creutzberg, 1961; McCleave and Wippelhauser, 1987; Dekker and van Willigen, 2000). Before the closure of the Zuiderzee, tidal currents could have transported glass eels into the River IJssel, presumably as far up as Deventer (52°15′N 6°10′E), more than 50 km upstream of the river mouth. Most of the few glass eels caught in the Zuiderzee were taken near the mouth of the River IJssel (Plate 29 of Redeke, 1907), at a time of year (March, April) indicative of subsequent further migration upriver. The yellow eel stock in the Zuiderzee presumably consisted largely of re-migrants from freshwater, immigration and re-migration being frequent phenomena at the brackish/freshwater interface (Limburg et al., 2003). Closing of the Afsluitdijk will have changed the opportunity for upriver migration completely, the dike and sluices now being the effective tidal limit (Dekker and van Willigen, 2000). Lake IJsselmeer, a large freshwater lake just upstream of the tidal limit, would therefore operate as a trap for incoming recruits, presumably bereaving upstream areas of any substantial recruitment. It is consequently most likely that the sharp rise in eel fisheries in 1932 is a direct result of man-made changes to the habitat and fisheries, not a reflection of changes in the local stock dynamics. The gradual increase before 1932, from 450 to 900 t per year, was attributed to an increase in the market price for eel (Redeke, 1907; Havinga, 1945).
Following the closure of the Afsluitdijk, the abundance of small eels (<10 cm) in the lake tracks the abundance of glass eels in front of the sluices reasonably well (Figures 1b and 5). Apparently, immigration through the sluices is not a major obstacle.
The bottom line is therefore that the current analysis does not reveal the causes of the decline of the population, but it does narrow the range of hypotheses. The decline in Lake IJsselmeer pre-dates the recruitment failure, is not predominantly caused by loss of habitat, is not a consequence of (altered) barriers in the route of immigrating glass eel, did not phase with eutrophication, peaking in the 1970s, is not related to the excessive but constant exploitation of the local stock, has no relation to apparent changes in ocean climate in the 1980s, began long before the introduction of Anguillicola in the mid-1980s (Haenen et al., 1994), and bears no relationship to the effects of pollutants on spawner fecundity. None of the individual hypotheses being an obvious explanation, a parallel, successive, or synergistic effect of multiple causes is plausible (Dekker, 2003b); but without quantitative analysis of the contributions by the individual causes, the multiple-cause hypothesis is just a replacement for unsolved mysteries. For the crucial decades of the decline, the historical information is limited, so for Lake IJsselmeer and perhaps even more relevantly elsewhere, it is unlikely that we will ever solve the mystery of the decline of the European eel population.
I thank Niels Daan for his critical review of my analyses, and Håkan Westerberg for the valuable comments on the submitted manuscript.
