-
PDF
- Split View
-
Views
-
Cite
Cite
Erik Muxagata, John A Williams, Martin Sheader, Composition and temporal distribution of cirripede larvae in Southampton Water, England, with particular reference to the secondary production of Elminius modestus, ICES Journal of Marine Science, Volume 61, Issue 4, 2004, Pages 585–595, https://doi.org/10.1016/j.icesjms.2004.03.015
Close - Share Icon Share
Abstract
Southampton Water, an estuary on the south coast of England, has been the focus of a number of studies to determine the seasonality and productivity of its pelagic community. Although recognized as important in previous studies, the meroplankton component and, in particular, the cirripedes have been largely ignored, though they rank second to the Copepoda in abundance. In order to estimate the contribution of barnacle larvae to the pelagic community, 42 quantitative zooplankton samples were collected from a fixed station within the estuary during a period of 19 months (from 12 January 2001 until 16 July 2002). As expected, barnacles were the second most abundant group averaging 13% of the total population, and accounting for up to 60% on some occasions. Eight barnacle species were identified: Elminius modestus, Balanus improvisus, Balanus crenatus, Semibalanus balanoides, Verruca stroemia, Chthamalus stellatus, Sacculina carcini, and Peltogaster paguri. Of these E. modestus was the most abundant and frequent, dominating the Cirripedia fraction throughout the year, but being outnumbered by B. crenatus from February to May. Secondary production was calculated for E. modestus and mean daily rates of 0.077 mg C m−3 d−1 (28.08 mg C m−3 yr−1) were found.
Introduction
It is widely accepted that in aquatic communities zooplankton play a critical role representing the main link between phytoplankton and bacterioplankton and the higher trophic levels (Buskey, 1993; Banse, 1995), and so the measurement of secondary production has been one of the primary goals of zooplankton research (Runge and Roff, 2000). This importance is reflected in the numerous reviews concerning the methodologies of zooplankton secondary production (Pechen et al., 1971; Winberg et al., 1971; Yablonskaya et al., 1971; Rigler and Downing, 1984; Kimmerer, 1987; Omori and Ikeda, 1992).
Copepods generally form the largest component of zooplankton biomass present in estuarine, neritic, and oceanic areas and, as such, almost all zooplankton production refers only to the copepod component. Although organisms such as polychaete larvae, cladocerans, barnacles, and decapod larvae are also seasonally important in estuarine and neritic waters (Raymont, 1983), it is surprising that there is a lack of data on the secondary production of these components.
The zooplankton community structure of Southampton Water offers a scenario for the evaluation of a non-copepod component, as all the studies that have monitored the composition, distribution, and abundance of the micro-mesozooplankton population of this estuary (Conover, 1957; Soares, 1958; Lance and Raymont, 1964; Raymont and Carrie, 1964; Zinger, 1989; Williams and Reubold, 1990; Geary, 1991; Lucas, 1993; Lucas and Williams, 1994; Castro-Longoria and Williams, 1996; Hirst, 1996; Lucas et al., 1997; Castro-Longoria, 1998; Hirst et al., 1999) have indicated that the larvae of barnacles constitute the major element within the meroplankton. Hirst et al. (1999) even suggested that this component could be expected to account for at least as much secondary production as calanoid copepods. Unfortunately, despite the number of zooplankton studies, only unpublished MSc dissertations (Soares, 1958; Geary, 1991) are available on barnacle larvae in this estuary.
Soares (1958) recorded the dominance of three species of barnacle larvae within the cirripedes at a station towards the mouth of Southampton Water. The nauplii of both Semibalanus balanoides and Balanus crenatus were most abundant during late February throughout early April, with the cypris larvae only appearing after late March. On the other hand, Elminius modestus were the most abundant barnacle larvae during the summer months being commonly found throughout the year, and even during the zooplankton winter minimum. The occasional appearance of Balanus improvisus, Verruca stroemia, Sacculina carcini, and Peltogaster paguri nauplii, always in very low numbers, was also noted (Soares, 1958). Geary (1991) also working in this region recorded the summer dominance of E. modestus.
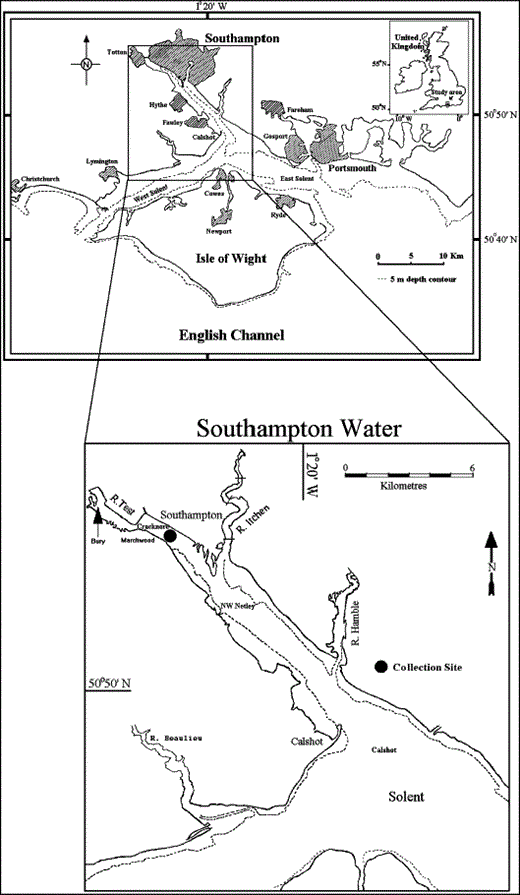
Although the meroplankton component is undescribed in detail, a number of authors have reported the seasonal cycle of abundance, biomass, and production rates for several components of the pelagic community of the Southampton Water and Solent ecosystem on the south coast of the UK (Figure 1). Ciliates (Leakey et al., 1992), bacteria (Antai, 1989), size-fractionated primary production (Iriarte and Purdie, 1994), gelatinous predators (Lucas and Williams, 1994; Lucas et al., 1997), and calanoid copepods (Hirst, 1996; Hirst et al., 1999) have been highlighted in particular.
The study area with detail showing the position of the Cracknore sampling site and sites sampled in previous studies.
The present study, by giving a first estimation of the density and secondary production of barnacle larvae, will add the contribution of this meroplanktonic component to the body of information on pelagic carbon flux within Southampton Water.
Material and methods
Southampton Water is a coastal plain estuary (Dyer, 1973) located on the south coast of England (Figure 1). It is shallow, depths usually between 1 and 8 m, and is essentially marine in character, with little salinity variation near the mouth and some stratification based on the state of the tide and the freshwater inflow at the head of the estuary (Raymont and Carrie, 1964; Webber, 1980). Water temperature varies with a winter minimum (T<7°C on December–February) and maximum during the summer (T>17°C June–August) (Raymont and Carrie, 1964; Leakey et al., 1992; Howard et al., 1995; Hirst, 1996). The tidal features of the Solent area are characterized by a “stand” of high water (double high water), a period of 2–3 h where little tidal water movement occurs. The consequence of this is to make the ebb currents faster than the corresponding flood.
During a 19-month period between 12 January 2001 and 16 July 2002, 42 samples were collected at a fixed site, marked by the Cracknore shipping buoy (50°53′93″N 01°25′12″W) within Southampton Water (Figure 1). This site was sampled on a time scale that was comparable to the breeding and recruitment phases of the target species and also associated with tide conditions. In barnacle larvae, moulting occurs at regular intervals and the metanauplius stage is usually reached within 3–4 weeks (Bassindale, 1936; Pyefinch, 1948, Harms, 1984), followed by the cyprid stage. Because of this, a bimonthly sampling programme was carried out during the barnacle's non-breeding season. During the breeding season, a more focused and intensive sampling programme involving a shorter sample frequency, three to four times a month, was carried out.
Samples were collected in the extended period of “slack water” during the high tide from 5-m double oblique tows using conventional cod end plankton nets of 50-cm mouth diameter and 120-μm mesh with a calibrated flowmeter (TSK). Towing times varied according to season, but sampled on average 39 m−3 in each tow. Samples were preserved in approximately 4% formaldehyde–seawater solution buffered with borax until processing. Temperature and salinity measurements were obtained at 1-m depth intervals. Samples of water were collected with a 5-l Niskin water bottle from surface, 2- and 8-m depth for Chl a analysis.
Subsamples between 0.39% and 12.1% of the original sample were taken and all individuals were counted and identified, with an average counting error of ±10%, based on all specimens counted following a Poisson distribution (Postel et al., 2000).
The Cirripedia were identified to species level based on the following: Hoek (1909); Bassindale (1936); Pyefinch (1948, 1949); Knight-Jones and Waugh (1949); Jones and Crisp (1954); Crisp (1962); Lang (1980), and Branscomb and Vedder (1982). They were also sorted to larval stage in accordance with the definitions presented by Lang (1979) for the production estimates. The results are expressed as number of organisms per cubic meter or as percentages during the period of study.
The fluorimetric technique of Welschmeyer (1994) was used to determine Chl a concentration. The final Chl a concentration (mg m−3) for each stratum on each sample date was obtained by averaging the duplicate results. Replica error was calculated as a percentage of the mean averaged for all measurements; during this work replica error was around ±5.7%.


Weights of each larval stage of E. modestus were obtained from Harms (1987) for cultured nauplii at 12, 18, and 24°C. The average weight of each larval stage (at those temperatures) was then considered in the production calculations (Table 1).
Elminius modestus weights used in the production calculations. Also shown is the carbon:dry weight ratio for each larval stage (data from Harms, 1987).
| Stage . | Dry weight, μg (average) . | Average C as % of dry weight . |
|---|---|---|
| I | Not considered | Not considered |
| II | 0.39–0.41 (0.397) | 43.31 |
| III | 0.70–0.75 (0.72) | 44.17 |
| IV | 1.06–1.47 (1.243) | 40.40 |
| V | 2.33–2.62 (2.467) | 39.37 |
| VI | 4.27–5.19 (4.617) | 44.69 |
| Cypris | 4.38–5.81 (4.916) | 51.94 |

Constant values needed in the power function to obtain growth rates of E. modestus in the field with salinities around 30 (data from Harms, 1986).
| Stage . | b . | m . |
|---|---|---|
| II to III | 158 | −1.51 |
| III to IV | 176 | −1.65 |
| IV to V | 147 | −1.52 |
| V to VI | 235 | −1.61 |
| VI to Cypris | 433 | −1.63 |
| Stage . | b . | m . |
|---|---|---|
| II to III | 158 | −1.51 |
| III to IV | 176 | −1.65 |
| IV to V | 147 | −1.52 |
| V to VI | 235 | −1.61 |
| VI to Cypris | 433 | −1.63 |
Using the most recent equations of Harms (1986) it was possible to calculate the approximate duration of each larval stage for each sampling day based on field temperatures ranging from 6°C to 24°C and salinities around 30.
For the final annual production estimates, the calculated daily production of a particular larval stage for a sampling day was assumed to represent the mean daily production over a time interval between two successive midpoints of the inter-sample period, and converted to carbon assuming the average conversion ratio from each larval stage (Table 1). Total annual production of a population will be equal to the sum of weight increments for all the stages throughout the year, excluding the non-feeding nauplius 1 (NI) and cypris.
Due to the oblique nature of the zooplankton sampling, temperature, salinity, and Chl a data from each stratum of each station had to be averaged before any analysis could be made. The Pearson's product-moment correlation coefficient r was used in order to measure the intensity of the association between the biotic and abiotic variables. To stabilize the variance of the data, zooplankton abundances were log10(x+1) transformed and the average Chl a concentrations were log10(x) transformed before analysis (Prepas, 1984).
Results
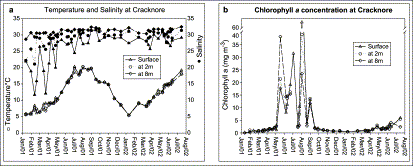
The temporal variability of the water temperature, salinity, and Chl a at three depths at the Cracknore buoy site during the period of study can be seen in Figure 2. Temperature (Figure 2a) varied according to season with the minimum temperature recorded during this investigation being 5.4°C in January 2002, and the maximum 20.4°C in August 2001. No pattern of temperature difference with depth was evident, but on some occasions slight differences of temperature at the surface were observed but these never exceeded 2.3°C. Salinity (Figure 2a) did not have any clear seasonal variation, but presented some vertical stratification with minimum values in the surface layer and gradually increasing with depth. The minimum recorded was 11.7 and the maximum 32.5.
Temporal variability of (a) temperature, salinity, and (b) Chl a at three depths at Cracknore during 2001–2002.
Concentration of Chl a at Cracknore during the 2001–2002 season is illustrated in Figure 2b. At the beginning of 2001, Chl a was low, <2 mg m−3, increasing to an average of 14 mg m−3 from May through August 2001, with successive peaks occurring in May (38 mg m−3), June–July (31 mg m−3), July–August (63 mg m−3), and August–September (13 mg m−3). During autumn the concentration returned to low values of <2 mg m−3 until July 2002, apart from two minor increases in April (3 mg m−3) and July (5 mg m−3) of 2002 (Figure 2). Chl a was uniform with depth during the low concentration period. During May through September the surface layer usually had higher concentrations.
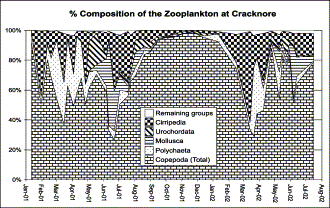
After copepods, barnacles were the second most abundant mesozooplankton group at Cracknore during 2001–2002 (Figure 3). They averaged 13% of the total population and contributed up to 60% on some occasions.
Total composition of the mesozooplankton at Cracknore during 2001–2002.
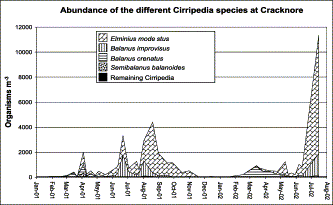
During this investigation, eight Cirripedia species were identified, and the temporal density distribution of the most abundant ones at the Cracknore site can be seen in Figure 4. E. modestus was the most abundant, occurring in the plankton throughout the year with a frequency of occurrence (FO) of 100%. Generally, this species had the lowest densities in winter, with an average of 57 org. m−3 in 2001 and 16 org. m−3 in 2002. In spring, its density starts to increase with averages of 326 org. m−3 in 2001 and 376 org. m−3 in 2002. Maximum density is reached during the summer–autumn months, with an average of 1053 org. m−3 in 2001. From autumn its density gradually declined towards the winter values.
Density of the different Cirripedia species present in the zooplankton of Cracknore during 2001–2002.
The second most abundant species was B. improvisus (FO=83%), with a very marked seasonal pattern of abundance and with a summer–autumn average of 339 org. m−3 in 2001. This species was also present in very low numbers during the winter, with an average of 0.4 org. m−3 in 2001 and 0.5 org. m−3 in 2002, and spring with averages of 55 org. m−3 in 2001 and 49 org. m−3 in 2002. This species was absent from samples from mid-autumn to early winter (October–February).
Marked seasonality was also shown by B. crenatus (FO=71%), which was most abundant during late winter and early spring, with winter–spring averages of 121 org. m−3 in 2001 and 229 org. m−3 in 2002. This species was very rarely found during the summer–autumn months. S. balanoides (FO=45%) presents the same pattern of distribution as B. crenatus, but with much lower densities, and completely disappears from the plankton from June to February. V. stroemia (FO=24%), P. paguri (FO=26%), S. carcini (FO=86%), and Chthamalus stellatus (FO=2%) were present at very low densities, and in Figure 4 are pooled under the heading “remaining Cirripedia”. V. stroemia occurred in the same winter–spring period as S. balanoides, and a maximum density of 41 org. m−3 in April 2001 and 4 org. m−3 in March 2002 was observed. C. stellatus was only present in one sample in March 2001.
The parasitic species P. paguri was present sporadically, with a maximum of 11 org. m−3 detected in October 2001, and was more frequent during the winter–early spring of 2001. S. carcini was present throughout the year, with a maximum density of 106 org. m−3 observed in August 2001.
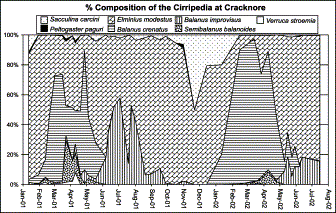
Figure 5 shows the general seasonal pattern presented by the different Cirripedia species. At the beginning of the year, E. modestus generally dominates the composition of Cirripedia, and is then replaced in dominance by B. crenatus from February to May, with S. balanoides and some V. stroemia also occurring. From May, B. improvisus begins to replace B. crenatus and co-dominates along with E. modestus. From September to January E. modestus is again the dominant barnacle species at Cracknore. A remarkable feature is the strong peak of S. carcini during late autumn, but this is also a reflection of the low total numbers found.
Temporal variability of the different Cirripedia species present in the zooplankton of Cracknore during 2001–2002.
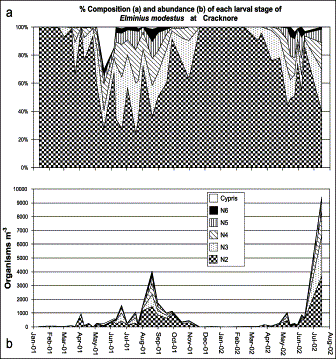
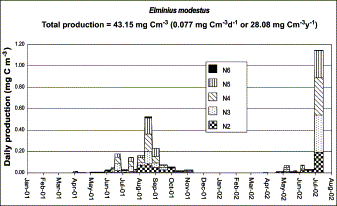
Within the annual pattern, E. modestus alone contributes an average of 60% of the total barnacle population, and its larval stage composition can be seen in Figure 6a. The daily secondary production of this species was estimated (Figure 7) based on this larval density (Figure 6b). For the 2001–2002 period, production was estimated as 0.077 mg C m−3 d−1 or 43.15 mg C m−3 over the whole period, which represents an average annual production of 28.08 mg C m−3 yr−1. In 2001 production was calculated as 21.21 mg C m−3 yr−1.
Temporal variability of the larval stages of Elminius modestus present in the zooplankton of Cracknore during 2001–2002.
Seasonal production of the larval stages of Elminius modestus present in the zooplankton of Cracknore during 2001–2002.
Based on the seasonal distribution of the different barnacle species found, correlations with the environmental variables measured were made in order to identify any pattern (Table 3). Within the barnacle species, the correlations confirmed the seasonality of occurrence, being positive for those most abundant during summer (E. modestus, B. improvisus, and S. carcini) and negative for those peaking during winter–spring (S. balanoides, B. crenatus, and V. stroemia). Chlorophyll was positively correlated with those species, with a very marked spring–summer occurrence.
Pearson's product-moment correlation of biotic and abiotic parameters from data collected at Cracknore (marked correlations * are significant at p<0.05 and ** at p<0.01).
| . | T°C . | Salinity . | Chl a . |
|---|---|---|---|
| Temperature | 1.00 | ||
| Salinity | 0.58** | 1.00 | |
| Chlorophyll a | 0.77** | 0.38* | 1.00 |
| E. modestus (total) | 0.79** | 0.41** | 0.61** |
| B. crenatus (total) | −0.48** | −0.16 | −0.27 |
| B. improvisus (total) | 0.86** | 0.46** | 0.78** |
| S. balanoides (total) | −0.48** | −0.25 | −0.22 |
| V. stroemia (total) | −0.39** | −0.32* | −0.23 |
| P. paguri (total) | −0.09 | −0.06 | −0.17 |
| S. carcini (total) | 0.69** | 0.48** | 0.49** |
| C. stellatus (total) | −0.17 | −0.19 | −0.11 |
Discussion
The temperature and salinity profiles agree with the patterns reported from other studies at this station (Zinger, 1989; Lucas, 1993, Hirst, 1996) and neighbouring areas (Raymont and Carrie, 1964; Castro-Longoria, 1998). Similarly, the Chl a values measured at Cracknore concur with most Chl a data reported for this estuary (Williams, 1980; Leakey et al., 1992; Kifle and Purdie, 1993; Iriarte and Purdie, 1994; Howard et al., 1995), which corresponds to primary production values of 130–177 g C m−2 yr−1 (Iriarte and Purdie, 1994).
Several authors have described the basic spatial and temporal pattern of the micro-mesozooplankton populations of Southampton Water. Recently, Hirst (1996) and others (Zinger, 1989; Lucas, 1993; Castro-Longoria, 1998) have reported that the zooplankton was primarily dominated by calanoid copepods, with barnacle nauplii being more numerous mainly during early spring (February–March) and summer (June–September). This reflects the generally accepted view that, in estuaries, copepods, mainly from the genus Acartia, Eurytemora, and Oithona, are dominant (Jeffries, 1967; Conover, 1979; Miller, 1983; Escaravage and Soetaert, 1995; Irigoien and Castel, 1995), with meroplanktonic larvae being only seasonally abundant. In terms of general community composition the present results agree with earlier ones, identifying Copepoda as dominant followed by Cirripedia, with some seasonal contribution by other meroplankton (Zinger, 1989; Lucas, 1993; Hirst, 1996; Castro-Longoria, 1998).
As with most meroplankton, barnacle nauplii usually have a very short planktonic life, although they can represent a large proportion of the zooplankton on a seasonal time scale. In terms of species composition, only Soares (1958), Raymont and Carrie (1964), and Geary (1991) have studied cirripede larvae within Southampton Water. Soares (1958) described a station at the mouth of Southampton Water, with the nauplii of both S. balanoides and B. crenatus being the most abundant forms during spring and those of E. modestus during the summer; Raymont and Carrie (1964) offered a very general picture of the distribution of the dominant species over the entire estuary. Geary's (1991) results from Cracknore should be compared cautiously with the present study, since only summer–autumn samples were available, and all individuals found in the summer were assumed to be E. modestus.
In terms of total Cirripedia density, the values reported here concur with those presented by Zinger (1989) for the same station. However, Zinger (1989) found that barnacles and calanoids represent on average 30.2% and 35.4% of the total zooplankton composition, whereas in the present study barnacles and calanoids represented on average only 13.6% and 17.5%, respectively, of the total zooplankton. This difference is mainly because of the large number of cyclopoids recorded in the present study and due to the fact that Zinger (1989) did not include copepod nauplii in the data. The species recorded at Cracknore are the same and show the same seasonal pattern as in the study of Soares (1958), although densities of S. balanoides and B. crenatus were higher compared with the present study. In contrast, E. modestus and B. improvisus occurred in higher densities in this survey. These differences could, in part, be due to the different location. Raymont and Carrie (1964) reported that higher densities of both S. balanoides and B. crenatus were commonly found at Calshot in the spring when compared to Marchwood (Figure 1), with the opposite occurring with E. modestus during the summer. Supporting this is the idea that both E. modestus and B. improvisus could be more salinity tolerant than the other two, as they are common inhabitants of brackish water regions in several British estuaries (Jones and Crisp, 1954). P. paguri and S. carcini are nauplii of parasitic forms that infect hermit crabs and crabs, respectively, and their occurrence is linked with the presence of the infected benthic host organism within the estuary.
Laboratory-defined growth rates for field production estimates are commonly used for assessments of the secondary production of species with continuous reproduction (Landry, 1978; Durbin and Durbin, 1981; McLaren and Corkett, 1981; McLaren et al., 1989; Huntley and Lopez, 1992; Escaravage and Soetaert, 1995; Irigoien and Castel, 1995). The power function utilized during this study takes into account variation in temperatures (Harms, 1984, 1986), but does not account for food concentration, since it was developed under optimal food conditions. The daily production value of 0.077 mg C m−3 d−1 estimated during this investigation therefore represents potential production, assuming no food limitation.
As a first figure, the averaged value of 28.08 mg C m−3 yr−1 reported here for E. modestus gives an indication of the lowest potential production of barnacles at Cracknore, since it does not include the production values of the remaining barnacle species present. So, accepting that E. modestus grossly averages 60% of the barnacles at this station, the remaining 40% could probably contribute an additional 20–30 mg C m−3 yr−1, or more, considering that E. modestus has the smallest larvae.
Previous zooplankton production studies within this estuary suggested that barnacles might contribute as much secondary production as calanoid copepods (Hirst, 1996; Hirst et al., 1999), and the present results could be taken to corroborate this assumption. However, the published value of 32.2 mg C m−3 yr−1 (36.2 mg C m−3 yr−1 assuming C as 45% of DW; Table 4) for calanoids at Calshot (1993–1994) (Hirst et al., 1999) is not directly comparable with the present study. This is because Calshot usually has significantly lower zooplankton densities compared with those of the inner stations (e.g. Cracknore), as well as a different community (Raymont and Carrie, 1964; Zinger, 1989). The current zooplankton composition and density values of barnacles and calanoids at Cracknore approach those recorded by Zinger (1989) for the same location (Figure 1). Comparing the averaged calanoid copepod production value of 389.1 mg C m−3 yr−1 (1985–1986) (Table 4) estimated from the data of Zinger (1989) by Hirst (1996), the current production of E. modestus represents only 7% of the calanoid production. However, if we add the production of the remaining barnacle species we could expect values approaching to 12–15% of the production of calanoids.
Production estimates of estuarine copepods and cirripedes.
| Species (groups), region . | Daily production . | Interval (days) . | ∼Depth (m) . | Source . |
|---|---|---|---|---|
| Acartia clausi, Jakles Lagoon, Washington, USA | 22–27 mg C m−2 d−1 | 365 | 3 | Landry, 1978 |
| 7.3–9 mg C m−3 d−1 | 365 | 3 | ||
| Acartia hudsonica, Narragansett Bay, Rhode Island, USA | 7.52–12.77 mg C m−3 d−1 | 120 | 6 | Durbin and Durbin, 1981 |
| (2.47–4.19 mg C m−3 d−1)* | (365)* | 6 | ||
| Acartia tonsa, Narragansett Bay, Rhode Island, USA | 18.98–22.91 mg C m−3 d−1 | 103 | 6 | Durbin and Durbin, 1981 |
| (5.35–6.46 mg C m−3 d−1)* | (365)* | 6 | ||
| Acartia tranterti, Westernport Bay, Australia | 0.4 mg C m−3 d−1 | 365 | 5 | Kimmerer and McKinnon, 1987 |
| 365 | ||||
| Eurytemora affinis, Westerschelde, The Netherlands | 2.23 mg C m−3 d−1 | 365 | — | Escaravage and Soetaert, 1993, 1995 |
| Acartia tonsa, Westerschelde, The Netherlands | 1.7 mg C m−3 d−1 | 365 | — | Escaravage and Soetaert, 1995 |
| Acartia spp. (three species), Malaga Harbour, Spain | 13.1 mg C m−3 d−1 | 139 | 7 | Guerrero and Rodríguez, 1997 |
| (4.99 mg C m−3 d−1)* | (365)* | 7 | ||
| Calanoids, Cracknore, Southampton Water, UK | 1.07 mg C m−3 d−1 | 365 | 5 | Hirst, 1996 |
| Calanoids, NW Netley, Southampton Water, UK | 1.62 mg C m−3 d−1 | 365 | 5 | Hirst, 1996 |
| Calanoids, Calshot, Southampton Water, UK | 0.813 mg C m−3 d−1 | 365 | 5 | Hirst, 1996 |
| Calanoids, Calshot, Southampton Water, UK | 0.099 mg C m−3 d−1 | 365 | 5 | Hirst et al., 1999 |
| Elminius modestus, Cracknore, Southampton Water, UK | 0.077 mg C m−3 d−1 | 365 | 5 | Present study |
Dry weight values were converted to carbon using a conversion factor of 45% (original values obtained using a conversion value of 40% where re-calculated and standardized at 45%).
Values in parentheses ( )* are calculated daily rates assuming that there was no production after the examined period.
Looking at the overall value of cirripede production within Southampton Water, the values of 0.077 mg C m−3 d−1 in the current study are low compared with the published literature for calanoids in other European estuaries (Table 4). Escaravage and Soetaert (1993, 1995) reported production rates around 2.23 mg C m−3 d−1 for Eurytemora affinis and 1.7 mg C m−3 d−1 for Acartia tonsa in the Westerschelde, The Netherlands (assuming C as 45% of DW), while Guerrero and Rodríguez (1997) reported values of 4.99 mg C m−3 d−1 for three different species of Acartia in Malaga Harbour, Spain (assuming C as 45% of DW and that no production occurred after the study period). Hirst (1996) calculated the production of calanoids from the data of Zinger (1989) for Southampton Water and it ranged from 0.81 to 1.62 mg C m−3 d−1. We can also speculate that the high numbers of cyclopoids found in the upper part of this estuary (Muxagata et al., unpubl.) would also significantly increase estimated copepod production, and thus the zooplankton production of Southampton Water as a whole. In conclusion, within the main body of Southampton Water, meroplankton production using the production of E. modestus as an example is substantially lower than that of total calanoid copepods.


