


Abstract
Age and growth of longtail tuna (Thunnus tonggol) were assessed by examination of annual growth increments in sectioned sagittal otoliths from 461 fish (238–1250 mm fork length, LF) sampled from tropical and temperate waters in the central Indo-Pacific between February 2003 and April 2005. Edge and microincrement analyses (presumed daily increments) suggest that longtail tuna deposit a single annual growth increment mainly between August and October. Age was, therefore, estimated for all fish by counting assumed annual growth increments. Ages ranged from 154 d to 18.7 years, with most fish being 3–9 years. Five growth models were fitted to length-at-age data, all of which indicated that the species is relatively slow-growing and long-lived. Recaptures of two tagged fish at liberty for 6.2 and 10.5 years support this notion. A bias-corrected form of Akaike's Information Criterion determined that the Schnute–Richards model provided the best fit to length-at-age data, with model parameter estimates (sexes combined) of L∞ = 135.4 cm LF, K = 22.3 year−1, t0 = 0.120 years, δ = 150.0, v = 0.019, and γ = 2.7 × 10⁻⁸. There was no significant difference in growth between sexes. The results suggest that longtail tuna grow more slowly and live longer than other tuna species of similar size. Coupled with their restricted neritic distribution, longtail tuna may be vulnerable to overexploitation by fisheries, and caution needs to be exercised in managing the species until more reliable biological and catch data are collected to assess the status of the population.Griffiths, S. P., Fry, G. C., Manson, F. J., and Lou, D. C. 2010. Age and growth of longtail tuna (Thunnus tonggol) in tropical and temperate waters of the central Indo-Pacific. – ICES Journal of Marine Science, 67: 125–134.
Introduction
The longtail tuna (Thunnus tonggol) is an economically important pelagic species inhabiting tropical to temperate provinces of the Indo-Pacific between 47°N and 33°S (Froese and Pauly, 2009). Its distribution is unique compared with those of other species in the genus Thunnus that generally range across open oceans, in that longtail tuna nearly exclusively occupy neritic areas close to landmasses, and are rarely found offshore (Yesaki, 1994). It is the second smallest of eight species of Thunnus and grows to a maximum size of 142 cm total length and 35.9 kg (IGFA, 2008).
As a result of their coastal distribution, longtail tuna are heavily exploited by small-scale commercial and artisanal fisheries in at least 17 countries throughout the Indo-Pacific. A detailed description of the countries and fisheries that exploit longtail tuna is given by Yesaki (1994). They are mostly targeted by purse-seine, gillnet, and trolling and constitute a significant portion of multispecies fisheries for small neritic tuna, including mackerel tuna (Euthynnus affinis) and frigate tuna (Auxis thazard and A. rochei; Yesaki, 1994). Thailand, Indonesia, Malaysia, and Iran contribute most to reported annual landings, which reached 248 000 t in 2007 (FAO, 2009). As longtail tuna contribute to important artisanal and subsistence fisheries in many countries, these reported landings are likely to be underestimates.
In the central Indo-Pacific, in particular Australia, longtail tuna are abundant in tropical and subtropical coastal waters. In contrast to other countries where longtail tuna are abundant, the species is only lightly exploited by commercial fisheries in Australia, with annual reported landings ranging from 0 to 138 t, but averaging ∼34 t since 1974 (FAO, 2009). However, catches by Taiwanese gillnet fishers in the Arafura Sea between 1974 and 1986 demonstrated the potential for a longtail tuna fishery. The fishery landed up to ∼2000 t of longtail tuna annually, primarily as a bycatch when fishers were targeting sharks and Spanish mackerel (Scomberomorus commerson; Stevens and Davenport, 1991).
Currently in Australia, longtail tuna (often incorrectly referred to by fishers as “northern bluefin tuna”) are an important sportfish, highly regarded for their relatively large size and fighting ability, and because they can be targeted easily from small vessels in relatively sheltered inshore waters or even from shore (Griffiths et al., 2007). All 17 IGFA world gamefishing line-class records for longtail tuna, including the all-tackle world record (i.e. the largest recorded fish regardless of line class), have come from Australian waters, primarily along the east coast (IGFA, 2008). The species has grown in popularity as, in recent years, several annual catch-and-release tournaments have been established to target longtail tuna, particularly involving saltwater flyfishers. As a reflection of their importance to recreational fisheries in Australia, longtail tuna was declared a “recreational only” species by the Commonwealth government in December 2006. However, a combined annual catch limit of 70 t is permitted for Australian Commonwealth commercial fisheries.
Despite the commercial and recreational importance of longtail tuna throughout the Indo-Pacific, surprisingly few studies have investigated their biology. Most studies of age and growth have been undertaken in regions where there are significant commercial longtail tuna fisheries, such as Thailand, India, Malaysia, and Oman, using modal length progressions of cohorts over time (Silas et al., 1986; Supongpan and Saikliang, 1987; Prabhakar and Dudley, 1989; Yesaki, 1989; Khorshidian and Carrara, 1993), or investigation of otolith microstructure from a small sample size (n = 26; Wilson, 1981) or truncated size distribution (13–49 cm LF; Itoh et al., 1999).
In light of its economic importance throughout its range, and the recent requirement for management as a “recreational only” species in Australia, a comprehensive study of the age and growth of the species was initiated to provide biological parameters for future stock assessments. The specific aims of this paper are to (i) estimate age-at-length by quantifying growth increments in sagittal otoliths, and (ii) determine whether growth increments are deposited annually using microincrement (presumed daily increments) and edge analyses.
Material and methods
Collection of specimens
Monthly collections were made from a number of locations in the tropical and temperate waters around Australia, using gillnets and hook and line, between February 2003 and April 2005. Fish were caught in coastal regions throughout the Arafura Sea and Gulf of Carpentaria, and along the entire east coast of Queensland to Iluka, NSW (Figure 1). To obtain monthly samples and fish from the entire size range of the species, collections were made from different regions at particular times of year because of their reputed large-scale seasonal movements throughout Oceania (Wilson, 1981) and Australia (Serventy, 1956). For example, small fish (3–8 kg) were caught in the Arafura Sea and Gulf of Carpentaria during late autumn, winter, and early spring, and larger fish (10+ kg) during summer and autumn off southeast Queensland and northern New South Wales, because they move southwards seasonally with the expanding East Australia Current (Serventy, 1942a, b, 1956).
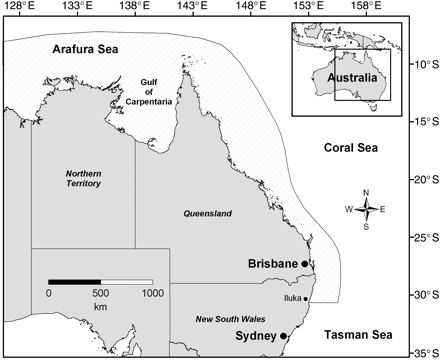
Map of the study region in Australian waters (shaded) shown within the central Indo-Pacific (inset). Gillnet and hook-and-line sampling was conducted throughout the entire study region.
Despite longtail tuna apparently spawning throughout their Australian distribution, based on the presence of ripe females (SPG, unpublished histological data), small juveniles (<3 kg or 50 cm LF) are rarely caught or seen by commercial or recreational fishers. Intensive Taiwanese gillnet operations between 1978 and 1986 captured only a few fish <50 cm LF in the northwest Arafura Sea, reinforcing the notion that that region is most likely a juvenile habitat from which the fish radiate to the southwest and southeast to occupy cooler waters as they grow. Despite efforts to sample off northwest Australia, no juvenile fish were obtained in this study.
Specimens were kept on ice until they could be frozen and freighted back to the laboratory. Fish were weighed (0.1 g), measured for fork and total length (LF and LT, mm), and sexed by visual examination of the gonads and later by histology. Only fork length is used in this paper unless otherwise stated.
Statistical analyses
Sex ratio was calculated by using the number of males and females caught pooled across months for the entire study. A Chi-squared test was used to determine whether the sex ratio was significantly different from the expected ratio of 1:1. A Kolmogorov–Smirnov (K–S) test was used to determine statistical differences in length frequency distributions between sexes. Separate length–weight relationships were constructed for males and females, and an analysis of residual sums of squares (ARSS) method (Chen et al., 1992) was used to determine whether the models differed.
Age determination
Fish were aged by quantifying presumed annual increments in sagittal otoliths. Otoliths were removed from each fish by making a horizontal incision from the snout to the operculum origin, removing the brain, and accessing the otic capsule. One-way analysis of variance indicated no significant difference between the left and right otoliths with respect to mean weight (F = 0.386; d.f. = 829; p = 0.535) or mean length (F = 0.010; d.f. = 388; p = 0.920). Therefore, one otolith was selected randomly from the pair of otoliths from each fish, embedded in an epoxy resin block, and allowed to cure for 10 h at 60°C. A 400-µm transverse section was taken from each block using a Buehler low-speed saw where the otolith core was exposed. Each section was then mounted on a separate glass microscope slide with thermoplastic cement and polished with 1200-grit wet-dry sanding paper. Immersion oil was applied to the polished surface of the section to improve optical resolution. Each section was viewed under a light-transmitted compound microscope at a magnification of ×40–400.
We recorded the number of annual increments along the dorsal axis, because increments were more distinct in that region of the otolith. Annual increments were validated in small (young) fish by first counting microincrements (presumed daily increments) in one sagittal otolith and the corresponding annual increments in the second sagittal otolith of the pair in the same fish. Sagittal otoliths of 15 small longtail tuna (238–622 mm LF) were prepared for microincrement counting using the methods described above.
Edge analysis was a second method used to support the annual formation of growth increments, using a methodology expanded from the general description of Campana (2001). The margin of otolith sections was subjectively assessed and classified into one of three classifications: new (A), intermediate (B), and wide (C) margins. These classifications were based on the relative stage of marginal increment formation, and were defined as: These margin index data were pooled for each month and analysed. If growth increments were deposited annually, a single peak could be expected in the monthly frequency of each margin type over a year.
New margin (A): opaque material visible on the otolith margin, but not necessarily continuous around the entire margin. A narrow layer of translucent material was visible in some area of the otolith margin.
Intermediate margin (B): a continuous increment of translucent material was visible on the outermost margin of the opaque increment. This marginal translucent increment is less than two-thirds completed, compared with the width of the previous increment.
Wide margin (C): marginal translucent increment was more than two-thirds completed, compared with the width of the previous increment.
To improve the subsequent fit of growth curves to the age data, the ages of each fish were converted into absolute decimal age based on a birthdate of 1 October. This was based on the peak period of annual increment formation and spawning (Griffiths et al., 2007), but see the Discussion for detailed justification of the use of this birthdate. Absolute decimal age was calculated as the number of annual bands plus the percentage of the year (from 1 October) that had passed at the date of capture.
Modelling growth


The parameters in each of the five models were estimated using non-linear least-squares regression with an additive normal error structure using JMP version 6 software (SAS Institute Inc., Cary, NC, USA). Models were also fitted using various error structures (e.g. lognormal), which resulted in a <1% variation in any model parameter.
Once the most appropriate model had been selected to characterize growth, separate models were fitted to males and females, and the ARSS method was used to determine whether growth models differed.
Results
Age determination was undertaken on 461 longtail tuna ranging from 238 to 1250 mm LF and 0.258 to 27.800 kg. No differences in external morphology between sexes were identified. Males (n = 201) ranged from 602 to 1250 mm LF and from 3.600 to 27.800 kg, and females (n = 259) from 487 to 1120 mm LF and 2.105 to 19.350 kg. Only one fish (238 mm LF; 0.258 kg) had immature gonads that could not be sexed macroscopically. Length frequency distributions of males and females were not significantly different (K–S test, Z = 0.123; p = 0.065; Figure 2). The length–weight relationship did not differ between sexes (F = 0.117; d.f. = 16; p = 0.948) and was described for the overall sample as body mass (g) = 0.00005 × LF (mm)2.8261 (r2 = 0.9635; n = 283). The sex ratio of 1:1.3 was not significantly different from unity (χ2 = 0.101; d.f. = 1; p = 0.542).
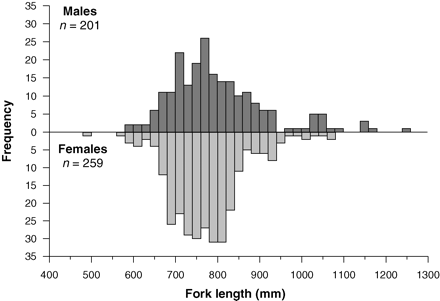
Length frequency distributions (in 20-mm increments) for male and female longtail tuna caught throughout the study region.
Age determination
Otoliths from all 461 longtail tuna were examined. When viewed under transmitted light, otoliths showed a distinct pattern of alternating narrow opaque and wider translucent bands (Figure 3), and microincrements were clearly visible with appropriate magnification. The precision of interpreting assumed annual growth bands was high, with close agreement between the annual counts made by the two readers (r2 = 0.852; p ≤ 0.001; n = 116; Figure 4), resulting in an APE of 3.34%. There was a strong positive relationship between number of annuli and otolith weight (r2 = 0.581; p ≤ 0.001; n = 423; Figure 5), which was best explained by the equation: number of annuli = 188.6726 × otolith weight (g) + 0.7918. This indicates that the number of annual increments increased consistently across the age range of fish sampled.
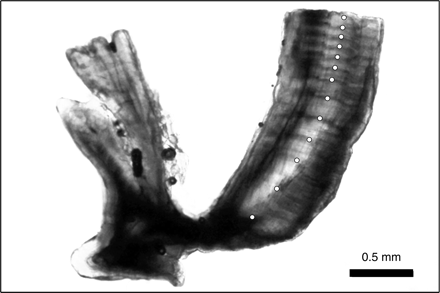
Annotated image of an otolith section from a 1042-mm LF longtail tuna estimated to be 13 years old.
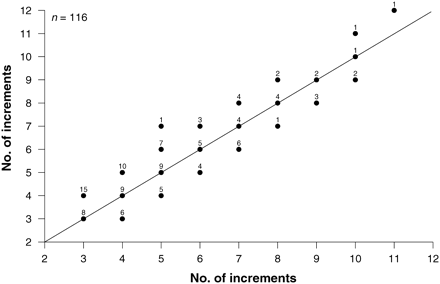
Relationship between counts of assumed annual growth increments from two readers reading a random 25% subsample of the 461 longtail tuna otoliths used for age determination. Sample size for each combination of annuli counts is shown above each point. The solid diagonal line denotes complete agreement of counts between the two readers.
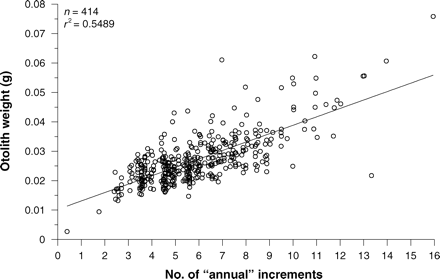
Relationship between otolith weight and the estimated age of longtail tuna (sexes combined).
Microincrement (presumed daily increments) counts of the otoliths of the smallest fish were used to indicate whether primary growth increments were formed annually. The number of microincrements in otoliths from 15 fish (238–622 mm) ranged between 154 and 918. The first annual increment formed after fish reached ∼400 mm. The number of microincrements corresponded to the number of annuli recorded in fish with one (346 d) or two (621–754 d) annual increments (Figure 6). The number of microincrements generally underestimated the expected number of annual increments in fish with three (784–823 d) or four (918 d) annuli (Figure 6), probably because of increased compression and difficulty in identifying microincrements in the marginal area of larger fish.
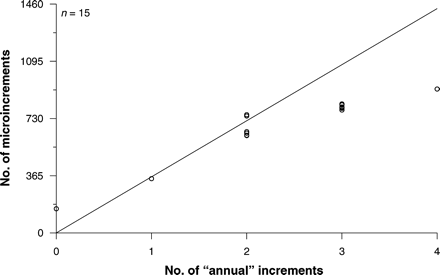
Relationship between number of daily increments (microincrements) and assumed annual increments in the same fish.
Edge analysis indicated that opaque growth increments formed annually, because a single frequency peak was observed for all three margin types (Figure 7). Annual growth increments formed between May and October, peaking between August and October, based on the presence of new margins (A) in otoliths from fish sampled during that period. The frequency of formation of opaque margins, as well as the close agreement of daily increments with annuli (for fish up to age 2), indirectly confirms that opaque bands are annuli and supports the use of sagittal otoliths as structures for age determination.
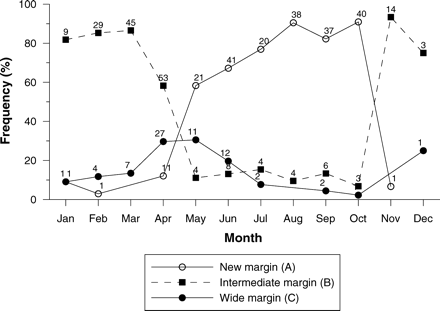
Monthly frequency of longtail tuna otoliths possessing one of three margin types. Data were pooled across age classes, sexes, and years. Sample sizes are given.
Age and growth
Growth of longtail tuna is rapid early in life, and a length of at least 500 mm is reached after 1 year (Figure 8). However, the variability in length-at-age increased rapidly after age 2, with a large number of fish between 600 and 900 mm ranging in age between 3 and 8 years. The youngest and oldest fish were estimated to be 154 d (238 mm) and 18.7 years (1117 mm), respectively. The longest and heaviest fish (1250 mm; 27.8 kg) was estimated to be 13.9 years old.
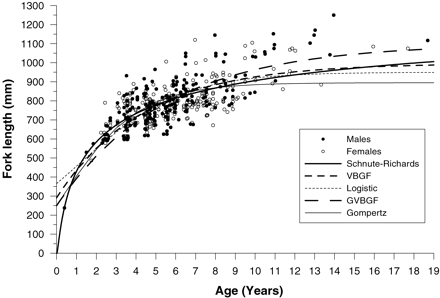
Length-at-age plot for male and female longtail tuna showing the fits of five growth models for sexes combined.
Estimated growth parameters for each of the five models (sexes combined) are listed in Table 1. We also fitted the five models to a truncated dataset with the three fish >14 years removed, because datapoints at the extremities can have a large influence on the estimate of L∞. However, this resulted in a <0.5% change in any growth parameter, so we retained the growth estimates derived from the full dataset.
Parameter estimates (± s.e.) from five growth models fitted to length-at-age data for longtail tuna, and calculated values for the bias-corrected AICc and Akaike's differences (Δi).
| Model | L∞ | K (year−1) | t0 (year−1) | Δ | γ | D | AICc | Δi | L∞/Lmax |
|---|---|---|---|---|---|---|---|---|---|
| Schnute–Richards | 1 354 (6.545) | 0.223a (0.044) | 0.019 (0.0026) | 150.0 (0.019) | 2.7 × 10⁻⁸ (2.1 × 10⁻¹⁰) | — | 4 094.754 | 0 | 0.9956 |
| VBGF | 997 (4.863) | 0.230 (0.010) | −1.50 (0.414) | — | — | — | 4 117.451 | 22.698 | 0.7330 |
| Logistic | 950 (4.782) | 0.390 (0.018) | 1.20 (0.299) | — | — | — | 4 145.466 | 50.712 | 0.6985 |
| GVBGF | 879 (5.375) | 0.243 (0.266) | −1.65 (0.098) | — | — | 0.90 | 4 163.617 | 68.864 | 0.6463 |
| Gompertz | 895 (4.584) | 0.470 (0.025) | −1.10 (0.701) | — | — | — | 4 166.242 | 71.488 | 0.6580 |
| Sex-specific growth functions using the Schnute–Richards model | |||||||||
| Males | 1 369 (6.974) | 0.221a (0.047) | 0.021 (0.0037) | 154.1 (0.022) | 2.8 × 10⁻⁸ (2.4 × 10⁻¹⁰) | — | — | — | 1.0066 |
| Females | 1 317 (5.711) | 0.225a (0.041) | 0.018 (0.0026) | 146.6 (0.016) | 2.5 × 10⁻⁸ (1.9 × 10⁻¹⁰) | — | — | — | 0.9684 |
The ratio of estimated L∞ to Lmax (1360 mm LF) is also given for each model, as are sex-specific growth functions using the Schnute–Richards model.
aReported parameter value for the Schnute–Richards model was derived by K/100 to allow comparisons with other models.
The bias-corrected AICc determined that the Schnute–Richards model provided the best fit to length-at-age data of the five models, as indicated by the lowest value of AICc (Table 1). The other four models provided substantially less support than the candidate model because their values of Δi exceeded 10. The Schnute–Richards model also produced an L∞ estimate within <1% of the maximum recorded length (Lmax = 1360 mm) for this species within the study region. In particular, the model fitted the rapid growth of fish early in life far better than any other model. The VBGF was the second best model, although it produced a relatively low value of L∞ (997 mm), which is probably unrealistic considering that 6% of the fish were 1000–1250 mm LF. The logistic growth model produced a reasonable fit to the length-at-age data, but a low estimate of L∞ and a very high estimate of t0 (Table 1), which resulted in early growth being poorly predicted (Figure 8).
The GVBGF and Gompertz models produced the poorest fits to the data. The GVBGF produced estimates of the K and t0 parameters similar to those produced by the VBGF, although, as expected, it produced a much lower estimate of L∞ of 879 mm. The Gompertz model produced results similar to the GVBGF, although it produced an estimate of K (0.470 year−1) nearly double that of the GVBGF (0.243 year−1).
The Schnute–Richards model was used to characterize growth of longtail tuna with sexes combined because growth parameters did not significantly differ between sexes (ARSS; F = 0.169; d.f. = 32; p = 0.916). However, sex-specific growth functions are provided in Table 1. Longtail tuna were estimated to attain mean lengths of 430, 584, and 673 mm at ages 1, 2, and 3 years, respectively (Figure 8). By extrapolating the growth curve, it is estimated that the age of the largest recorded fish (1360 mm LT) may be near 30 years.
Discussion
Age validation
An important part of estimating fish age using otoliths is to be able to validate the periodicity with which a typical growth increment is deposited. One of the best ways of achieving this goal is by mark–recapture of fish injected with calcium-binding chemicals such as oxytetracycline (OTC) or strontium (Campana, 2001), which allows quantification of the number of growth increments formed during the period the fish was at liberty. Chemical tagging has been successful in validating the rate of increment deposition in bigeye tuna (Thunnus obesus) up to age 4 using OTC (Schaefer and Fuller, 2006) and 2–9 years using strontium chloride (Clear et al., 2000).
For this approach to be successful for highly mobile tuna, the species has to support large-scale fisheries where there is a high probability of tagged fish being recaptured. Unfortunately for longtail tuna in Australia, the probability of recapturing tagged wild fish is low because the species is not a commercial target and the effort by recreational fishing is low in the remote tropical regions where longtail tuna are abundant. As a consequence, direct validation of the periodicity of deposition of growth increments by mark–recapture was not feasible in the present study.
Nonetheless, the indirect validation methods used here suggest that assumed annual growth increments were probably deposited annually. The best evidence is the strong agreement between the number of presumed daily and annual growth increments, at least in fish with two annual bands. Beyond age 2, the number of daily increments was generally underestimated owing to increasing compression and the difficulty in identifying daily increments in the otolith marginal area of older fish. Ideally, the deposition of microincrements also needs validation in longtail tuna using chemical tagging, although it can reasonably be assumed that the microincrements in longtail tuna are deposited daily, as has been confirmed for several other species of tuna that spend a large part of their lives in tropical waters, including bigeye tuna (Farley et al., 2006; Schaefer and Fuller, 2006), albacore (Thunnus alalunga; Laurs et al., 1985), and yellowfin tuna (Thunnus albacares; Wild and Foreman, 1980).
If, in fact, longtail tuna begin to deposit multiple growth increments each year later in life, as has been reported in albacore in the North Atlantic (Ortiz de Zarate et al., 1996; Santiago and Arrizabalaga, 2005) and the Mediterranean (Megalofonou, 2006), the ages for older fish in the present study would be overestimates. However, if this were the case, the relationship between the number of growth increments and otolith weight would be expected to be non-linear, with otolith growth increasing with age, and the growth curve would have a high value of K and reach L∞ rapidly, which was not evident in the data.
Edge analysis was a second indirect validation method that suggested that all age classes of longtail tuna deposited a single annual opaque growth increment. All three margin types formed a single frequency peak and were deposited at different times of the year, as would be expected if growth increments were deposited annually (Campana, 2001). The peak in formation of new opaque margins between August and October corresponded to the peak in reproductive activity during October in Australian waters (Wilson, 1981; Griffiths et al., 2007). Using these two methods, the use of otoliths as structures for determining the age of longtail tuna was indirectly validated and suggests that a birthdate of 1 October from which to measure age is appropriate.
Growth and longevity
Growth of longtail tuna in the present study was best described by the Schnute–Richards model, because it produced a value of L∞ close to that of the largest fish in our sample and within 1% of Lmax. In the absence of significant fishing mortality on a fish population, which is the case for longtail tuna in Australian waters, L∞ should generally be within ± 5% of Lmax (Froese and Binohlan, 2000). The model also described the rapid growth of fish during the first year, which could not be described by the other four models. This was due to the model's flexibility with the possibility of various inflection points, which may have allowed better incorporation of the small number of young fish than the other models. Several other fish growth studies have indicated this model to be useful where growth characteristics vary ontogenetically. For example, the Schnute–Richards model best explained the rapid early growth in a long-lived temperate reef fish (Cheilodactylus spectabilis; Ewing et al., 2007), and a similar earlier version of the model (Schnute, 1981) also explained the slow early growth in a large temperate pelagic fish (Seriola lalandi; Gillanders et al., 1999; Stewart et al., 2004).
The specialized VBGF has been the main model used to describe growth in other species of Thunnus, such as bigeye tuna (Farley et al., 2006), blackfin tuna (Thunnus atlanticus; Doray et al., 2004), yellowfin tuna (Lessa and Duarte-Neto, 2004), Atlantic bluefin (Neilson and Campana, 2008), southern bluefin (Thunnus maccoyii; Gunn et al., 2008), and albacore (Santiago and Arrizabalaga, 2005). Although the specialized VBGF produced the most parsimonious fit to longtail tuna length-at-age data in the present study, it produced low estimates of L∞ and t0, which resulted in a “flat” curve that did not capture apparent rapid early growth. This may have been the result of there being few fish younger than 2 years, which are rare in the waters of Australia and Papua New Guinea (Wilson, 1981); this would have had the greatest effect on the estimate of t0. In contrast, the Schnute–Richards model appeared to be less influenced by the underrepresentation of young fish, and fitted through the small number of datapoints available for young fish.
This study provided no evidence of sexual dimorphism in growth of longtail tuna, or a departure from the expected sex ratio of unity, although fish >1000 mm LF were generally males. Several species of Thunnus appear to display sexual dimorphism in size biased towards males, including yellowfin (Wild et al., 1995; Schaefer, 1998), Atlantic bluefin (Hurley et al., 1981), and southern bluefin (Gunn et al., 2008). Schaefer (1998) suggests that the higher energetic cost of spawning by females and injuries incurred by aggressive courting males around spawning events (Schaefer, 1996) may lead to higher rates of natural mortality in females, rather than sex-related differences in growth or capture probability. In this study, we feel that the bias towards males for fish >1000 mm LF (2:1) probably reflects inadequate sampling of larger fish (just 25 fish, or 5.4% of the sample) rather than a true departure from the 1:1 sex ratio. This underrepresentation of larger fish was primarily attributable to their natural low densities throughout their distribution rather than size selectivity of the sampling methods.
The present results differ from other age and growth studies of longtail tuna in other regions of the world, which have primarily used modal progression analysis and suggest rapid growth and short lifespan (see review by Yesaki, 1994). These studies were either conducted in areas in which only a restricted size range of fish was available, fish were sampled using size-selective gears (e.g. gillnet), or sampling was conducted too infrequently to trace modal progressions through time reliably. Therefore, it is unlikely that these studies can produce reliable growth curves for the entire range of lengths and, therefore, are not discussed in this paper.
Only two previous studies have aged longtail tuna using hard parts (otoliths). These were undertaken in the East China Sea (Itoh et al., 1999) and the waters between northern Australia and Papua New Guinea (Wilson, 1981); both estimated age by counting presumed daily increments and suggested that longtail tuna are fast-growing and short-lived. Itoh et al. (1999) aged 33 fish between 130 and 490 mm LF, and estimated L∞ and maximum age to be 550 mm LF and 434 d, respectively, which indicates inadequate sampling of the adult population. Wilson (1981) aged 26 fish from a greater size range (453–1109 mm LF) and estimated an L∞ of 1318 mm LF, similar to the estimate of 1354 mm LF here. However, Wilson (1981) estimated K to be nearly twice that of the present study (0.395 year−1), suggesting rapid growth and a short lifespan, with the oldest fish estimated to be only 1700 d (4.7 years) old at 1109 mm LF. The age estimates, and hence the growth model parameters, in Wilson's study may be biased as a consequence of the difficulty in interpreting daily increments beyond age 2, as demonstrated in the present study.
The present study suggests that longtail tuna may live more than 18 years, which contrasts strongly with previous work on longtail tuna and closely related species. For example, the smallest species of Thunnus, blackfin tuna, attains a maximum length of 1080 mm LF (Froese and Pauly, 2009) and fish up to 680 mm LF have been aged at 3 years from tropical regions of the South Atlantic (Doray et al., 2004). Yellowfin tuna, the closest relative of longtail tuna (Robertson et al., 2007), have been the subject of many ageing and tagging studies (Yang et al., 1969; Wild et al., 1995; Stéquert et al., 1996; Driggers et al., 1999; Lehodey and Leroy, 1999; Lessa and Duarte-Neto, 2004; Shuford et al., 2007), which suggest that they are fast-growing and relatively short-lived, reaching a maximum age of around 6 years at lengths of more than 2000 mm LF (Lehodey and Leroy, 1999).
Although it was not possible to validate the periodicity of increment deposition in otoliths directly for all age classes using chemical tagging, two long-term recaptures of fish tagged with conventional tags from the New South Wales Department of Primary Industries' Gamefish Tagging Programme support the present ageing data which indicate that longtail tuna are relatively long-lived. The first fish (tag no. 53108) was tagged at an estimated weight of 5 kg (∼680 mm FL) and recaptured at an estimated weight of 20 kg and 1200 mm LT (∼1110 mm LF) after being at liberty for 3833 d (10.5 years). Using our length-at-age curve, this fish was ∼3 years old at release, indicating that it may have been ∼13 years old when recaptured.
A second longtail tuna (tag no. 82327) was tagged at an estimated weight of 6 kg (∼725 mm LF) and recaptured 2261 d (6.2 years) later at a weight of ∼7 kg (∼765 mm LF). Although the release and recapture weights were estimated by recreational anglers and may suffer some inaccuracies, that recapture also suggests greater longevity and slow growth. If it can be assumed that this fish was around 4 years old when released, it would have been ∼10 years old when recaptured.
Age data from the present study, supported by the long-term recaptures of tagged fish, suggest that longtail tuna have growth characteristics more similar to those of larger species of Thunnus rather than those of its closest relatives of similar size (yellowfin and blackfin tuna). For example, Atlantic bluefin live more than 32 years in the West Atlantic (Neilson and Campana, 2008). Similarly, in the Pacific and Indian Oceans, southern bluefin tuna have been shown to live for at least 31 years (Gunn et al., 2008), whereas bigeye tuna can live for at least 18 years (Farley et al., 2006). These larger species attain lengths of more than 2000 mm LF and spend a significant proportion of their lives in cool waters at high latitudes (Schick et al., 2004; Patterson et al., 2008). These fish are, therefore, likely to have lower standard metabolic rates (Brill, 1994; Korsmeyer and Dewar, 2001) and slower rates of gastric evacuation (Temming et al., 2002) and, hence, lower daily feeding rations, which may explain their slower growth and lower rates of natural mortality (Pauly, 1980) than smaller tuna that occupy warmer waters. There is no available information on the physiology of longtail tuna to explain why this relatively small tropical tuna species has growth characteristics so different from those of closely related tropical Thunnus spp. However, Griffiths et al. (2007) showed that longtail tuna have a lower daily feeding ration than other tropical tuna, which may indicate that longtail tuna have a slower metabolism and, hence, may invest less energy in growth.
Implications for management
A lack of understanding of the biology of some tuna species has led to inadequate management and overexploitation in many parts of the world (Fromentin and Powers, 2005; Dankel et al., 2008). For example, after southern bluefin tuna were confirmed to live for at least 32 years (Gunn et al., 2008) and reach sexual maturity at around 12 years (Gunn et al., 1996), fishery managers realized the levels of stock depletion to the extent that the species is now listed on the IUCN Red List of Threatened Species as “critically endangered”.
In light of the similar slow growth of longtail tuna, coupled with its restricted coastal distribution throughout its worldwide distribution (Yesaki, 1994), this species may also be vulnerable to overexploitation if not managed in a precautionary manner until reliable quantitative biological data are collected (e.g. length at sexual maturity). However, commercial and artisanal fisheries in many underdeveloped countries, primarily Indonesia, Thailand, Malaysia, and Iran, are the primary contributors to the dramatically escalating global catch of longtail tuna, which has more than doubled from 117 000 t in 1997 to 248 000 t in 2007 (FAO, 2009). This may contribute to difficulties in implementing management policies if a single stock straddles the jurisdictions of several countries throughout their Indo-Pacific distribution.
Although the Australian government has recently declared longtail tuna a “recreational only” species, because of its importance to recreational anglers, almost no quantitative data exist on recreational catches to assess the extent of exploitation by recreational fisheries. Moreover, the strategy allows an incidental catch of 70 t for Commonwealth commercial fisheries combined, which is double the average annual commercial catch since 1974 (FAO, 2009). Although commercial catches can be monitored through compulsory logbooks on all Australian state and Commonwealth fisheries, catch data from the recreational fishery are urgently required to assess the stock status and to determine whether this management strategy is affording adequate protection to the population to ensure its long-term sustainability.
Acknowledgements
We thank Alan Vickers and the crew of the FV “Kundu”; the Weipa Sportfishing Club and the many sportfishers who helped collect longtail tuna; and K. Davidson, Q. Dell, and R. Pillans for assistance in collecting and processing specimens. NSW Department of Primary Industries is thanked for the use of tagging data from its Gamefish Tagging Programme. S. Blaber (CSIRO), A. Williams (SPC), K. Schaefer, and D. Fuller (IATTC) are acknowledged for their valued critical reviews of earlier drafts of this manuscript. The study was funded by the CSIRO Division of Marine and Atmospheric Research, and the production of this paper was funded through the CSIRO “Julius Career Award” awarded to SPG.
