


Abstract
Fish are often delineated into distinct population or stock units that reflect human institutional borders more than ecological factors. In the Northwest Atlantic, there are many species in the broader Gulf of Maine area (GOMA), yet the area is surveyed and managed for the most part in the south by the United States and in the north by Canada. Biomass time-series of 19 representative fish species and total biomass from 7 different surveys conducted by the United States and Canada in the GOMA are compared. All species showed coherent trends in relative biomass across at least two survey time-series, and in many species a single trend could describe all time-series trends accurately. For instance, Canadian and the US time-series of Atlantic cod, Atlantic herring, haddock, thorny skate, and goosefish had comparable trends. Conversely, species such as longhorn sculpin and spiny dogfish showed differing survey time-series trends and asynchronous event timing, suggesting that their population dynamics differ spatially. Collectively, the results demonstrate the value of comparing time-series for common species from contiguous ecosystems and elucidate the relative importance of environmental and fishing factors on each species.Nye, J. A., Bundy, A., Shackell, N., Friedland, K. D., and Link, J. S. 2010. Coherent trends in contiguous survey time-series of major ecological and commercial fish species in the Gulf of Maine ecosystem. – ICES Journal of Marine Science, 67: 26–40.
Introduction
For many animals, population dynamics can be synchronous over a range of spatial scales, but the mechanisms that generate such synchronicity are often difficult to determine. In ecological literature, common temporal patterns among spatially distinct density-dependent populations are generally attributed to one or more of: a metapopulation structure supported through dispersal; a common response to large-scale environmental forcing (the Moran effect); or a common response to prey populations which are also synchronous (reviewed in Liebhold et al., 2004). According to the Moran effect, if dispersal is low among populations, but they have the same density-dependent structure, density-independent factors such as weather and climate should bring two populations into synchrony (Moran, 1953). If the density-dependent structure is different, there may be a time-lag in synchrony. Lack of synchrony suggests that metapopulations have reduced connectivity, are affected by different environmental factors, have different responses to the same environmental factors, and/or represent separate stocks whose population dynamics must be assessed separately.
In marine systems, there is evidence that large-scale environmental forcing influences recruitment success (Myers et al., 1997; Myers, 2001), the assumption being that synchronous recruitment dynamics translates into synchrony in the abundance of adult populations. The strength of this connection between recruits and adults depends on life-history traits (Tedesco and Hugueny, 2006). Many studies have reported synchrony in recruitment of fish in tropical (Cheal et al., 2007), freshwater (Tedesco et al., 2004), temperate (Field and Ralston, 2005), and upwelling (Pyper et al., 2005; Mueter et al., 2007) ecosystems at various spatial scales. Recently, there has been a push to understand patterns and processes across ecosystems to implement an ecosystem approach to management. Although there have been comparisons of time-series in adult fish populations in ecosystems (Link et al., 2009), there have been few studies on the synchrony of adult fish population dynamics within species in large contiguous temperate marine ecosystems.
The population dynamics of fish stocks in the Northwest (NW) Atlantic are well-studied, and many stocks are assessed formally, but broad-scale synchrony of adult metapopulations at a species level has not been examined. The Gulf of Maine Area (GOMA) in the NW Atlantic is commonly divided into four subregions: Gulf of Maine proper, Georges Bank, Bay of Fundy, and the western portion of the Scotian Shelf. Monitoring and management of the northern regions, Bay of Fundy and Scotian Shelf, is conducted by Canada, and that of the southern regions by the US, with the international border dividing the area. These geographic regions are generally treated as separate ecosystems, and stocks are likewise often assessed and managed separately by region. Arguably, these regions by which many fish stocks are assessed are part of one spatially contiguous ecosystem connected by large-scale circulation patterns in the GOMA (Bigelow, 1927), and through which adult fish move. Given the fact that these four regions are adjacent, we hypothesize that the survey time-series among them for each species are synchronous within the GOMA and respond similarly to large-scale forcing. If this is the case, there are implications for the management of fisheries across the whole GOMA as we move towards an ecosystem approach to management.
Here, we explore whether there is synchrony among regions within the GOMA across a broad range of finfish species and in total biomass, by comparing survey time-series in its four contiguous regions. We hypothesize that long-term trends in biomass do not vary independently across the four regions in the GOMA, but may exhibit local variation. For each species, the questions are posed whether there are any significant common trends, and which time-series are primarily responsible for each trend. Further, we question whether the trends are coherent across regions and test whether environmental factors, fishing, or both have contributed to coherence among regions. Comparing the survey time-series in the contiguous regions of the GOMA furthers understanding of the factors influencing population dynamics and allows the elucidation of patterns common across species. Moreover, analysis of the multiple survey time-series available within one large marine ecosystem, the GOMA, provides the essential contextual information for supporting an ecosystem approach to management, rather than managing at the level of a single stock or region.
Methods
Description of surveys and survey areas
The four regions of the GOMA are surveyed separately by Canada and the United States (Figure 1). These multispecies surveys are designed to monitor trends in abundance and distribution and to provide samples to study the ecology of the large number of fish and invertebrate species inhabiting the region. All surveys have a stratified random design and have a survey time-series of >35 years [except the Canadian survey of eastern Georges Bank (EGB)]. The surveys are conducted in depths from ∼27 to 366 m, although greater depths are occasionally sampled in the canyons along the continental shelf break. Within each depth-region stratum, stations are assigned randomly, the number of stations allotted to a stratum being in proportion to its area (with a minimum of two per strata). Once on board, fish are sorted to species, weighed (0.1 kg), the length is measured (cm), sex and maturity are determined, and subsamples of key species are eviscerated for studies of their feeding ecology.
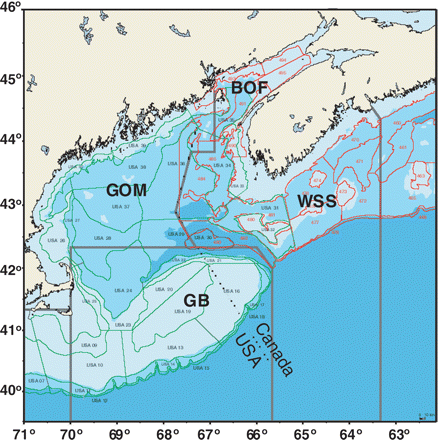
Map of the GOMA. GB, Georges Bank; BOF, Bay of Fundy; WSS, Western Scotian Shelf; GOM, Gulf of Maine proper. Red lines and labels, Canadian survey strata; green lines and labels, US survey strata. Dotted line, Canada/US international border.
In Canadian waters, the BOF and the WSS have been surveyed by Canadian vessels once per year in July since 1970, and the EGB has been surveyed since 1986 in February. The surveys used a #36 Yankee bottom trawl from 1970 to 1981, and a Western IIA trawl since 1982 (Simon and Comeau, 1994), which is towed at ∼5.5 km h–1 for 30 min at each station.
The GOM and GB are surveyed by US vessels twice per year, once each in spring and autumn. The surveys generally utilize a #36 Yankee (or similar) bottom trawl towed at ∼6.5 km h–1 for 30 min at each station. A more detailed description of the bottom-trawl survey design and protocols are provided in Azarovitz (1981) and NEFSC (1988). In this analysis, the GOM includes strata 01260–01300 and 01360–01400, and the GB area includes 01130–01230 and 01250.
There were seven survey series in all, and we studied the trends of 19 fish species common to all seven (Table 1). In addition, we studied the trends in total biomass of all species caught in the surveys. Relative biomass (weight tow−1) from each survey was first log-transformed to de-emphasize major differences in magnitude and to normalize the biomass variables. To correct for differences in catchability among surveys, we standardized each time-series for each species (subtracted the mean and divided by the standard deviation) before conducting statistical analysis.
Common and scientific names of the species included in this analysis.
| Common name | Scientific name |
|---|---|
| Acadian redfish | Sebastes fasciatus |
| American plaice | Hippoglossoides platessoides |
| Atlantic cod | Gadus morhua |
| Atlantic herring | Clupea harengus |
| Goosefish | Lophius americanus |
| Haddock | Melanogrammus aeglefinus |
| Little skate | Leucoraja erinacea |
| Longhorn sculpin | Myoxocephalus octodecemspinosus |
| Pollock | Pollachius virens |
| Red hake | Urophycis chuss |
| Sea raven | Hemitripterus americanus |
| Silver hake | Merluccius bilinearis |
| Spiny dogfish | Squalus acanthias |
| Thorny skate | Amblyraja radiata |
| White hake | Urophycis tenuis |
| Winter flounder | Pseudopleuronectes americanus |
| Winter skate | Leucoraja ocellata |
| Witch flounder | Glyptocephalus cynoglossus |
| Yellowtail flounder | Limanda ferruginea |
Explanatory variables
The temperature regime was estimated using the extended reconstructed sea surface temperature (SST; ERSST version 3) dataset. This dataset is based on the SST compilation of the International Comprehensive Ocean–Atmospheric Data Set and uses interpolation procedures to reconstruct SST in regions with sparse data (Smith and Reynolds, 2004). Although the dataset extends back to 1854, we used values from 1970 to 2007 where analysis errors are <0.1°C (Smith and Reynolds, 2004). The spatial resolution of the data is 2° longitude by 2° latitude. There is considerable coherence among 2 × 2° grids in the NW Atlantic (Friedland and Hare, 2007), so we calculated the mean ERSST over the area of our surveys. We used windstress as an additional environmental variable, derived from National Centers for Environmental Prediction (NCEP) files recorded from four points in the GB, GOM region. Windstress was computed using the method of Large and Pond (1981). We calculated the number of days where average windspeed was >12.5 m s–1 in each year, then used this in our statistical analyses as an indicator of “storm events”.
Two indices of longer term climatological conditions that affect GOMA, the North Atlantic Oscillation (NAO), and Atlantic Multidecadal Oscillation (AMO) were used. The mean winter NAO index was used because most of the variance in the NAO is in winter, and it is the only teleconnection pattern evident throughout the year in the northern hemisphere (Hurrell et al., 2003). The NAO index we used is calculated as the difference between the surface pressure of the subtropical (Azores) high and the Subpolar (Iceland) low. Although variability in the NAO has been associated with changes in precipitation, SST, sea-ice formation and, hence, with ecosystem change (Drinkwater et al., 2003; Greene et al., 2003) and fish recruitment (O'Brien et al., 2000; Reid et al., 2001; Lindley et al., 2003), its effects are stronger at high latitudes of the northern hemisphere and are at time-scales of ∼10 years (Hurrell et al., 2003).
The AMO represents SST variability in the Atlantic over a time-scale of 20–40 years, and its effects are strong in the northern hemisphere. The mechanism that drives the AMO is not completely understood, but it is related to the global thermohaline circulation, driven by global density differences caused by temperature salinity changes as water circulates the globe (Sutton and Hodson, 2005). Despite the lack of a clear mechanism, the AMO is a broad-scale measure of warm and cold phases in SST in the Atlantic. The AMO index used herein is based on the detrended Kaplan SST dataset (5 × 5° latitude × longitude grids) from 0 to 70°N. The linear effects of anthropogenic climate change are removed from this time-series to represent the natural variation in SST observed over the past 150 years and correlated with natural fluctuations over the past millennium (Sutton and Hudson, 2005).
Total landings over the entire GOMA were used as an index of the direct and indirect effects of fishing (such as the effects of benthic trawling and bycatch mortality). Landings data were obtained from the NAFO database for NAFO divisions 4X and 5Y, and NAFO subdivisions 5Zu, 5Zc, and 5Zw. All explanatory variables were standardized as recommended for multivariate time-series analysis (Zuur et al., 2007).
Statistical analysis of multiple time-series
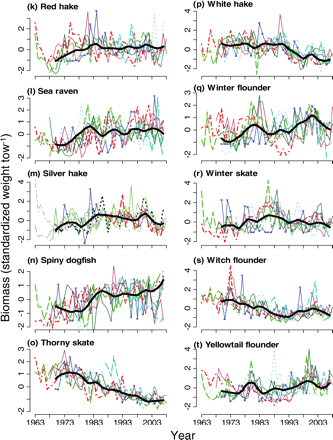
To identify coherent trends in survey time-series, we used three techniques. First, loess (locally weighted regression smoother) smoothing visualizes long-term trends among survey relative biomass indices for each species. It is a smoothing technique that fits a regression to sections of data by weighting points relative to their distance from the target value. We used a span of 0.25, meaning that 25% of the data were used to arrive at the smoothed estimate for each year. The smoothed mean trend of all survey time-series is simply the average of the smoothed trends calculated for each time-series, and the smoothed trend roughly corresponds to decade-scale trends given that 37 years of data were employed. Only one time-series from each geographic region was used in loess smoothing, the WSS, BOF, GOM-autumn, and GB-autumn survey time-series.
The second technique used to identify the number of common trends in the survey time-series was minimum/maximum autocorrelation factor analysis (MAFA), which is a data reduction technique similar to PCA (Zuur et al., 2007). However, in MAFA, the temporal autocorrelation structure is taken into account and is used to identify the number of statistically significant trends. MAFA identifies the number of statistically significant trends, then quantifies the canonical correlation between extracted trends and both individual biomass time-series and explanatory variables.
The third time-series statistical technique used to identify coherent trends was dynamic factor analysis (DFA). This technique is similar to traditional factor analysis, but it incorporates temporal autocorrelation structure to predict the trends of each time-series with a fewer number of common trends (Zuur et al., 2003, 2007). DFA was also used to assess how well explanatory variables improved model fits. Our hypothesis was that if a species had strongly coherent survey time-series, then statistical techniques would identify only one trend to describe all time-series. Both MAFA and DFA were carried out in the Brodgar software version 2.5.6 (Highland Statistics, Inc., www.Brodgar.com).
The effects of fishing and environmental pressures on population dynamics may be lagged for up to 10 years for some long-living fish such as spiny dogfish, winter skate, and thorny skate (the scientific names of all species are listed in Table 1) that mature at 10–11 years of age. To explore the effects of time-lags between 1 and 10 years, we first reduced the five explanatory variable time-series to two uncorrelated variables using MAFA. The time-lag at which there was maximum significant correlation between each of the two new variables (termed MAFA1 and MAFA2) and the common trends for each species were determined using MAFA for each species. Only the MAFA explanatory variable with the maximum correlation for each common trend was tested in the subsequent DFA.
Model selection in DFA was based on Akaike's information criterion (AIC). For each species, many possible models were tested, and the model with the lowest AIC was chosen to best represent the common trend(s) among surveys and its dependence on environmental variables. In total, 15 possible models resulted from varying the number of common trends (1, 2, or 3) and incorporation of a single explanatory variable (none, NAO, ERSST, AMO, or total landings). In addition to these 15 models, the MAFA variables with maximally correlated time-lags up to 10 years and two-way interactions among the highest performing variables were also tested.
Multiple explanatory variables can be incorporated into DFA models, but the cost of adding an additional explanatory variable is the estimation of additional parameters for each time-series, in this case six more parameters, one for each survey time-series. We only tested two-way interactions among the four highest performing explanatory variables, and chose the model with the lowest AIC, unless a model with multiple explanatory variables lowered the AIC by at least a value of 2 (Burnham and Anderson, 2002). For the MAFA and DFA, all survey time-series starting in 1970 were analysed, so excluding the EGB survey time-series because it only began in 1987. Because survey time-series overlapped spatially in the USGB and USGOM, but were in different seasons, a symmetric non-diagonal matrix in all DFA models was employed. This allowed incorporation of the covariance among time-series into the error structure of each model.
Canonical correlations indicate how well the common trends identified by MAFA and DFA represent each individual trend. All canonical correlations are reported, but to identify coherent trends, survey time-series with canonical correlation values >0.45 were considered. If all six survey time-series were strongly coherent with each other, the hypothesis is that DFA would identify one common trend with each survey time-series having positive loadings and closely fitting this common trend. Lack of coherence was characterized by the extraction of more than one common trend, with only a few survey time-series associated with each trend. Full DFA results from all species are not shown, but several examples are provided to illustrate strongly coherent, weakly coherent, and non-coherent sets of time-series.
Results
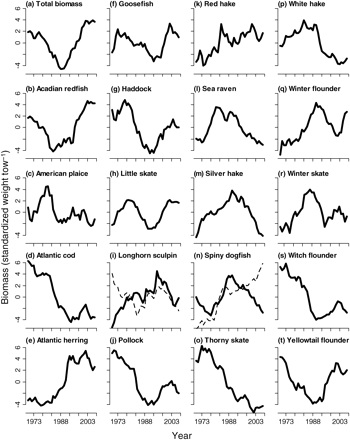
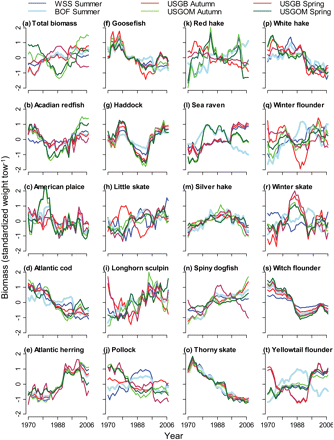
There is considerable interannual variability in the survey time-series of all species, but several species clearly exhibit a single common trend, as emphasized by the overall loess curve (Figure 2). The total biomass across the GOMA ecosystem remained relatively constant during the first 20 years of the 37-year period, though with a slight increase since the early 1990s (Figure 2a). An overall declining trend was apparent for Atlantic cod, goosefish, thorny skate, white hake, and witch flounder (Figure 2d, f, o, p, and s). An overall increasing trend was visible in Atlantic herring, longhorn sculpin, and spiny dogfish (Figure 2e, i, and n). Acadian redfish, haddock, and winter flounder exhibit a decrease in biomass during the first half of the survey time-series, followed by a recent increase through the 1990s (Figure 2b, g, and q). Winter skate appear to have experienced the opposite response of an increase in the first half of the time-series and a decrease starting in the 1990s (Figure 2r).
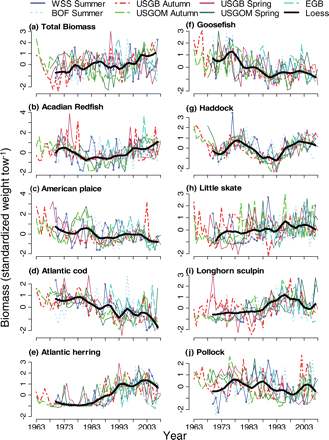
Trends in relative biomass after log-transformation and standardization for seven contiguous surveys. The bold black line is the overall smoothed loess curve of WSS, BOF, GOM-autumn, and GB-autumn surveys together (continued over).
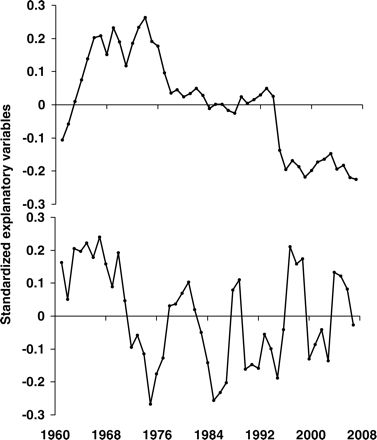
Similar to the trends observed for the biomass time-series of each species, interannual variability was high in terms of environmental variables (Figure 3). The environmental variables used were not significantly correlated with each other. However, there was an overall increasing trend in AMO from the beginning of the study period and an overall decreasing trend in total landings (Figure 3). There was no overall trend in NAO, SST, or the number of wind events, but all demonstrated considerable stochasticity. The difference in the temporal autocorrelation structure of the explanatory variables was captured in the MAFA, in which the first and most dominant trend most closely resembled the trend in total landings (Figure 4a). AMO was also loaded negatively on the first axis, hereafter referred to as MAFA1 (Figure 5). There was also significant autocorrelation to produce a second common trend, hereafter termed MAFA2, in which SST and NAO were negatively loaded. Wind did not load strongly onto either the first or the second axis (Figure 5). Therefore, MAFA1 corresponds primarily to the change in fishing regime over time in the GOMA and to an increase in AMO, whereas MAFA2 corresponds primarily to the stochasticity in environmental variables.
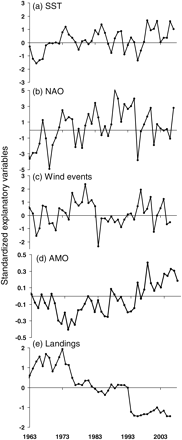
Standardized time-series of (a) ERSST, (b) NAO, (c) wind events, (d) AMO, and (e) total landings, used as explanatory variables in MAFA and DFA. Note the different units on the y-axis.
Two explanatory variables created by the MAFA data reduction technique from the five original explanatory variables.
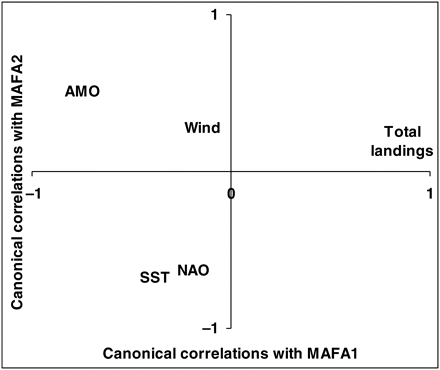
Loadings of the original explanatory variables on the resultant MAFA variables. The x-axis corresponds to canonical correlations on the first MAFA axis (MAFA1), and the y-axis to canonical correlations with the second MAFA (MAFA2).
Multiple statistically significant common trends were identified by MAFA for all species and in total biomass except for Acadian redfish, goosefish, little skate, and winter skate, for which only one dominant trend was identified (Table 2, Figure 6). Several statistically significant correlations between common trends and explanatory variables were identified using MAFA. Total landings and AMO were the explanatory variables most frequently correlated with trends in MAFA, but time-lags were not tested with these variables. As might be expected, incorporation of time-lags was important to understand how explanatory variables were correlated with common trends extracted by MAFA (Table 2).
Statistically significant common trends extracted by the MAFA. The dominant first trend with highest autocorrelation is shown as a bold line, and the second and third trends have increasingly lower values of autocorrelation and are shown by a dashed and a thin line, respectively.
Number of trends extracted by MAFA and their correlation with explanatory variables for each species and total biomass.
| Species | Trend | AMO | NAO | SST | Total landings | MAFA1 | MAFA2 |
|---|---|---|---|---|---|---|---|
| Total biomass | 1 | – | – | – | – | – | −0.38 (5) |
| 2 | 0.66 | – | 0.33 | −0.68 | −0.70 (1) | – | |
| Acadian redfish | 1 | 0.38 | −0.35 | – | – | −0.52 (10) | 0.40 (9) |
| American plaice | 1 | – | – | – | – | 0.72 (9) | – |
| 2 | – | – | – | – | – | 0.57 (5) | |
| 3 | – | – | – | – | – | 0.37 (3) | |
| Atlantic cod | 1 | −0.61 | – | −0.32 | 0.77 | 0.78 (0) | 0.43 (10) |
| 2 | – | – | −0.38 | – | 0.33 (4) | – | |
| Atlantic herring | 1 | 0.68 | – | 0.35 | −0.77 | −0.81 (5) | −0.49 (10) |
| 2 | – | – | – | – | 0.35( 8) | – | |
| 3 | – | −0.38 (2) | |||||
| Goosefish | 1 | −0.45 | 0.58 | 0.59 (4) | 0.52 (8) | ||
| Haddock | 1 | 0.37 | −0.43 | – | – | −0.32 (1) | 0.38 (1) |
| 2 | – | – | – | – | 0.49 (10) | −0.45 (9) | |
| Little skate | 1 | 0.47 | – | 0.35 | −0.50 | −0.77 (6) | −0.34 (10) |
| Longhorn sculpin | 1 | 0.46 | – | – | −0.73 | −0.72 (1) | −0.60 (10) |
| 2 | – | – | – | – | 0.34 (5) | – | |
| 3 | – | – | – | – | −0.54 (8) | −0.35 (4) | |
| Pollock | 1 | −0.44 | – | – | 0.63 | 0.65 (7) | 0.51 (10) |
| 2 | −0.44 | – | – | – | 0.51 (4) | −0.44 (2) | |
| Red hake | 1 | – | – | 0.34 | −0.53 | −0.56 (2) | −0.65 (10) |
| 2 | 0.50 | – | – | −0.49 | −0.76 (9) | 0.36 (1) | |
| Sea raven | 1 | 0.65 | – | – | −0.66 | −0.78 (3) | −0.50 (9) |
| 2 | 0.36 | – | – | – | −0.55 (10) | 0.42 (7) | |
| Silver hake | 1 | – | – | – | – | 0.36 (10) | −0.41 (6) |
| 2 | – | – | 0.33 | – | −0.45 (5) | −0.34 (2) | |
| 3 | – | – | 0.39 | −0.33 | – | −0.37 (10) | |
| Spiny dogfish | 1 | 0.65 | – | 0.49 | −0.73 | −0.82 (2) | −0.36 (8) |
| 2 | – | – | – | – | – | – | |
| Thorny skate | 1 | −0.79 | – | −0.38 | 0.91 | 0.93 (0) | 0.51 (10) |
| 2 | – | – | – | – | – | −0.46 (4) | |
| White hake | 1 | −0.63 | – | – | 0.81 | 0.80 (0) | 0.49 (10) |
| 2 | – | 0.34 | – | – | – | −0.37 (6) | |
| Winter flounder | 1 | – | −0.48 | – | – | – | 0.32 (4) |
| 2 | 0.72 | – | – | −0.76 | −0.78(0) | −0.59 (7) | |
| Winter skate | 1 | – | – | – | – | – | −0.36 (10) |
| Witch flounder | 1 | −0.53 | – | – | 0.69 | 0.69 (0) | 0.45 (6) |
| 2 | – | – | – | – | – | 0.39 (3) | |
| 3 | – | – | – | – | −0.36 (10) | 0.39 (10) | |
| Yellowtail flounder | 1 | – | – | – | – | –0.37 (10) | 0.54 (4) |
| 2 | – | – | – | −0.50 | −0.64 (2) | −0.53 (8) |
The value in parenthesis indicates the lag at which the explanatory variable was maximally correlated. Emboldened values indicate environmental variables that were incorporated in the DFA to produce the best model.
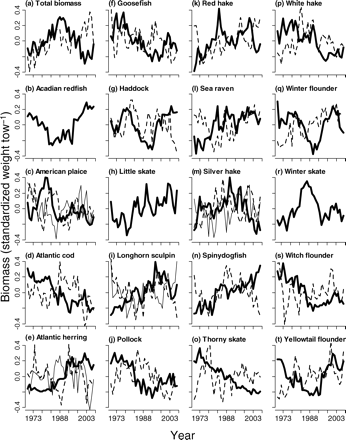
DFA extracted a single common trend in all species except for longhorn sculpin and spiny dogfish, for which two common trends were extracted from the original survey time-series (Table 3, Figure 7). In all cases except spiny dogfish and witch flounder, it was necessary to incorporate an explanatory variable to model the time-series appropriately. When an explanatory variable was necessary, the MAFA variables or a combination of the two with appropriate time-lag decreased the AIC values significantly. Of 18 cases in which an explanatory variable was needed, just two included an original unlagged explanatory variable. For Acadian redfish and winter skate, the unlagged AMO variable improved model fits. Interestingly, MAFA1 with no time-lags improved model fits for thorny skate, white hake, and winter flounder. However, in both white hake and winter flounder, incorporating the effects of stochastic environmental variables, MAFA2, lagged by 10 and 7 years, respectively, produced the best model fit.
Common trends (factors) extracted by DFA. The first trend is shown as a bold line, and the second by a dashed line, but unlike MAFA, the order of trend does not indicate the relative importance. Fitted trends result from common curves identified in the DFA.
Number of common trends, canonical correlations of each common trend with each time-series, and relevant explanatory variables used to obtain best model fits in the DFA.
| Species | Trend | WSS-summer | BOF-summer | USGB-autumn | USGOM-autumn | USGB-spring | USGOM-spring | Explanatory variable |
|---|---|---|---|---|---|---|---|---|
| Total biomass | 1 | −0.085 | −0.079 | 0.63 | −0.48 | 0.87 | 0.026 | MAFA1 (1) |
| Acadian redfish | 1 | 0.26 | 0.35 | 0.32 | 0.96 | 0.20 | 0.81 | AMO |
| American plaice | 1 | 0.12 | 0.46 | −0.038 | 0.82 | 0.28 | 0.94 | MAFA2 (5) |
| Atlantic cod | 1 | 0.63 | 0.16 | 0.70 | 0.89 | 0.76 | 0.59 | MAFA1 (4) |
| Atlantic herring | 1 | 0.90 | 0.78 | 0.84 | 0.89 | 0.70 | 0.55 | MAFA1 (8) |
| Goosefish | 1 | 0.18 | −0.051 | 0.70 | 0.65 | 0.33 | 0.41 | MAFA1 (4) |
| Haddock | 1 | 0.54 | 0.41 | 0.77 | 0.93 | 0.81 | 0.81 | MAFA1 (1) |
| Little skate | 1 | −0.15 | −0.44 | 0.69 | 0.018 | −0.20 | −0.095 | MAFA1 (6) |
| MAFA2 (10) | ||||||||
| Longhorn sculpin | 1 | 0.57 | 0.43 | 0.27 | 0.89 | 0.20 | 0.33 | MAFA1 (8) |
| 2 | −0.17 | −0.36 | 0.56 | −0.31 | 0.41 | −0.48 | MAFA2 (4) | |
| Pollock | 1 | −0.58 | −0.25 | 0.24 | 0.75 | 0.52 | 0.63 | MAFA1 (4) |
| Red hake | 1 | 0.62 | 0.56 | −0.50 | 0.72 | −0.17 | 0.14 | MAFA1 (9) |
| Sea raven | 1 | −0.28 | 0.66 | −0.24 | 0.65 | −0.23 | 0.63 | MAFA1 (3) |
| Silver hake | 1 | 0.38 | 0.27 | 0.27 | 0.61 | 0.51 | 0.11 | MAFA2 (10) |
| Spiny dogfish | 1 | 0.43 | 0.76 | 0.62 | 0.62 | 0.46 | 0.19 | – |
| 2 | 0.20 | 0.52 | 0.66 | 0.78 | −0.23 | 0.27 | ||
| Thorny skate | 1 | 0.91 | 0.85 | 0.74 | 0.82 | 0.82 | 0.86 | MAFA1 |
| White hake | 1 | 0.75 | 0.43 | 0.74 | 0.51 | 0.60 | 0.41 | MAFA1 |
| MAFA2 (10) | ||||||||
| Winter flounder | 1 | −0.40 | −0.74 | 0.75 | −0.004 | 0.40 | 0.012 | MAFA1 |
| MAFA2 (7) | ||||||||
| Winter skate | 1 | −0.31 | 0.14 | 0.91 | 0.54 | 0.87 | 0.53 | AMO |
| Witch flounder | 1 | 0.30 | 0.67 | 0.54 | 0.83 | 0.78 | 0.94 | – |
| Yellowtail flounder | 1 | 0.13 | −0.68 | 0.88 | 0.005 | 0.84 | 0.21 | MAFA1 (2) |
According to our hypothesis, the species that exhibited coherence were those in which the DFA extracted one common trend upon which all time-series were positively loaded. Eight species fitted these criteria, namely Acadian redfish, Atlantic cod, Atlantic herring, haddock, silver hake, thorny skate, white hake, and witch flounder (Table 3). The resultant trends in these species were coherent (Figure 8). Four species, American plaice, goosefish, winter skate, and yellowtail flounder, had all but one time-series positively loaded onto a single common trend in DFA. Two species, pollock and red hake, had all but two time-series positively loaded on the common trend. Sea raven and winter flounder had three survey time-series loaded in opposition to the other three time-series, indicating an overall lack of coherence that is evident in the resulting DFA models (Figure 8l and q).
Fitted curves for each of the six survey time-series using factors and explanatory variables identified for each species in the DFA.
In addition to loadings on common trends, coherence can also be assessed by the ability of the DFA model to fit the variability for each set of survey time-series represented by the variance, i.e. the diagonal of the error covariance matrix (Table 4). Values indicate the quantity of information that cannot be explained by the common trend, such that low values indicate good model fit to the common trends identified. The best fits were obtained for thorny skate, Atlantic herring, and haddock, and the poorest fits for silver hake, little skate, and total biomass. In general, model fits were poorest for the WSS time-series and best for GOM-autumn and GB-autumn. Model fits of each original survey time-series to the common trend were largely species-dependent. Atlantic cod, Atlantic herring, haddock, and thorny skate fitted the hypothesized description of coherent time-series. One common trend was extracted by DFA (Table 3, Figure 7), all six time-series were positively loaded onto this common trend, and good fits were obtained, as indicated by the low values of error on all six survey time-series (Tables 3 and 4). The curves estimated by DFA fitted the data well for these four species (Table 4, Figure 9).
Model fit for DFA as represented by the diagonal of the error covariance matrix.
| Species | WSS | BOF | USGB-autumn | USGOM-autumn | USGB-spring | USGOM-spring | Average |
|---|---|---|---|---|---|---|---|
| Total biomass | 0.91 | 0.67 | 0.53 | 0.77 | 0.24 | 0.66 | 0.63 |
| Acadian redfish | 0.89 | 0.82 | 0.82 | 0.11 | 0.75 | 0.30 | 0.62 |
| American plaice | 0.96 | 0.61 | 0.86 | 0.29 | 0.64 | 0.11 | 0.58 |
| Atlantic cod | 0.43 | 0.82 | 0.48 | 0.22 | 0.44 | 0.6 | 0.50 |
| Goosefish | 0.6 | 0.69 | 0.2 | 0.51 | 0.8 | 0.75 | 0.59 |
| Haddock | 0.69 | 0.59 | 0.39 | 0.12 | 0.30 | 0.33 | 0.40 |
| Herring | 0.19 | 0.39 | 0.31 | 0.17 | 0.25 | 0.66 | 0.33 |
| Little skate | 0.52 | 0.69 | 0.55 | 0.85 | 0.54 | 0.73 | 0.65 |
| Longhorn sculpin | 0.42 | 0.72 | 0.51 | 0.16 | 0.35 | 0.4 | 0.43 |
| Pollock | 0.56 | 0.84 | 0.90 | 0.44 | 0.35 | 0.54 | 0.61 |
| Red hake | 0.49 | 0.56 | 0.68 | 0.30 | 0.93 | 0.46 | 0.57 |
| Sea raven | 0.71 | 0.48 | 0.50 | 0.35 | 0.39 | 0.28 | 0.45 |
| Silver hake | 0.82 | 0.77 | 0.91 | 0.64 | 0.73 | 0.92 | 0.80 |
| Spiny dogfish | 0.81 | 0.43 | 0.47 | 0.36 | 0.55 | 0.91 | 0.59 |
| Thorny skate | 0.19 | 0.28 | 0.41 | 0.30 | 0.25 | 0.14 | 0.26 |
| White hake | 0.42 | 0.75 | 0.29 | 0.47 | 0.60 | 0.49 | 0.50 |
| Winter flounder | 0.47 | 0.33 | 0.11 | 0.58 | 0.80 | 0.86 | 0.53 |
| Winter skate | 0.86 | 0.95 | 0.16 | 0.61 | 0.16 | 0.70 | 0.57 |
| Witch flounder | 0.89 | 0.55 | 0.70 | 0.34 | 0.42 | 0.15 | 0.51 |
| Yellowtail flounder | 0.70 | 0.55 | 0.21 | 0.82 | 0.24 | 0.63 | 0.53 |
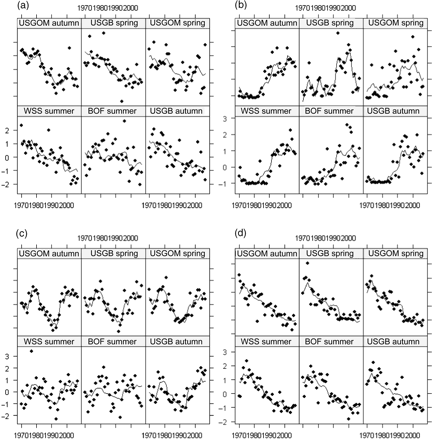
Model fits for each survey time-series for four strongly coherent species: (a) Atlantic cod, (b) Atlantic herring, (c) haddock, and (d) thorny skate, as identified and modelled with DFA. Individual points represent the annual observations, and the modelled trend predicted by DFA is illustrated by the solid line.
In a few species, survey time-series were markedly different (Figure 10). For example, two common trends were extracted by DFA for longhorn sculpin and spiny dogfish (Table 3). Additional diagnostics indicated regional and seasonal differences in these two species where loadings were low or in opposition to common trends for different survey time-series (Table 3). The longhorn sculpin time-series showed three distinct trends, one in GOM-spring, one in WSS, BOF, and GOM-autumn, and a third pattern in GB-autumn and GB-spring (Figure 10). In contrast, little skate population dynamics exhibited three trends, one shared by GOM-autumn, GB-spring, and GOM-spring, a slightly different trend in WSS and BOF, and a third trend in GB-autumn.
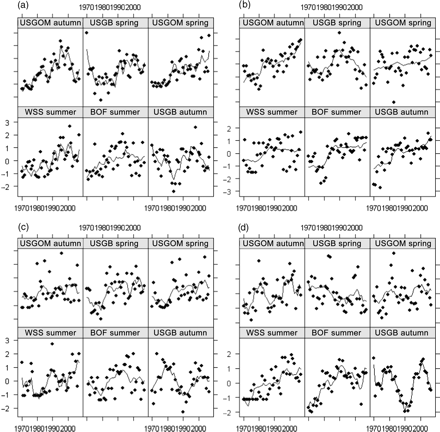
Model fits for each survey time-series for four non-coherent species: (a) longhorn sculpin, (b) spiny dogfish, (c) little skate, and (d) winter flounder, as identified and modelled with DFA. Individual points represent the annual observations, and the modelled trend predicted by DFA is illustrated by the solid line.
The importance of explanatory variables can be assessed by the results of MAFA and DFA. The first MAFA axis (MAFA1) with the appropriate lag describes the trends in total landings, and this decrease in landings improved model fits in 14 of the 20 cases examined. In white hake and thorny skate, MAFA1 without a time-lag was incorporated. In the remainder of the species and in total biomass, time-lags ranging from 1 to 9 years were appropriate. The second MAFA axis (MAFA2) with appropriate time-lag represented stochastic environmental variables and improved model fits in just five cases. The five species in which MAFA2 improved model fits all had low coherence and high interannual variability, suggesting that these species had multiple distinct local populations within the GOMA, that stochastic events greatly influenced local population dynamics, or both.
Discussion
Despite differences in surveys, gear, season, and sampling areas, there was strong coherence among the seven survey time-series that we examined for most of the fish species in the GOMA ecosystem. Given that the four regions of the GOMA are adjacent, coherence in population dynamics among these regions was expected. Previous studies have observed synchrony in fish population dynamics at similar spatial scales of 10–500 km and suggest that environmental forcing influences recruitment success and, hence, synchrony (Myers et al., 1997; Mueter et al., 2002). However, our findings suggest that although environmental factors may be important in driving synchrony in recruitment and year-on-year variation in the abundance of juvenile fish, fishing is likely a more important factor in driving synchrony at the adult stage (Myers et al., 1996; Bjornstad et al., 1999). Similarly, in a comparison of high latitude ecosystems in different ocean basins, strong recruitment covariation was demonstrated by Megrey et al. (2009), but synchrony in adult fish biomass time-series was only detected in pelagic species at the scale of oceanic basins (Link et al., 2009). Closer examination of similarities and differences among regional survey time-series within the larger ecosystem provides important contextual information necessary to manage stocks from an ecosystem perspective.
An examination of standardized survey trends, loess smoothing, MAFA, and DFA is largely confirmatory. The use of multiple time-series statistical methods was complementary in that MAFA identified important autocorrelation structure and explanatory variables, whereas DFA provided a statistical basis for determining which survey trends were coherent, and to what degree, and further elucidated the role that environmental variables play in this synchrony. The only case where MAFA and DFA identified different trends was for little skate, which showed little coherence. Although MAFA consistently extracted more common trends than DFA, the incorporation of explanatory variables into DFA suggests that these weaker trends can be explained by environmental factors. DFA appears to smooth the common trends more than MAFA, and by incorporating explanatory variables, interannual variation is modelled in DFA.
Examination of the MAFA results in isolation would suggest that most species are not coherent because multiple statistically different trends or autocorrelation structures were identified (Table 2, Figure 6). However, the DFA results suggest that coherence is more common, and by examining the model fits, a range of coherence across all species is evident. Thorny skate, Atlantic herring, Atlantic cod, and haddock exemplified coherence across the GOMA. In these species, DFA identified one common trend positively correlated with all six survey time-series and resulted in the best model fits. However, even in species where all survey time-series were not coherent with each other, there was some coherence among at least some surveys within the GOMA. Opposing patterns in biomass time-series were not driven by any single survey time-series that was consistently different from the other time-series, nor by differences between the US and Canadian surveys, nor by the season of the surveys. The species-specific rather than region-specific nature in the lack of coherence is best exemplified by a comparison of trends in non-coherent species.
The total biomass across all survey time-series remained relatively constant, suggesting that biomass is conserved across the GOMA and that biomass is a conservative property of an ecosystem. However, total biomass was conserved at a larger spatial scale as a consequence of the increase in biomass in some areas of the GOMA (USGB, WSS, and BOF), concomitant with a decrease in USGOM. Total biomass appears to be increasing in the most recent years of the surveys and was strongly negatively associated with total landings (and MAFA1) in both the MAFA and the DFA. These findings suggest a link between the overall decrease in landings and the increase in productivity of the GOMA as a whole. Previous studies of the US region of GOMA found little variation in total biomass, but that the biomass of different functional groups varied (Link et al., 2002a, 2009; Methratta and Link, 2006). Compensation was also observed in the southern areas of the Scotian Shelf (Shackell and Frank, 2007). However, for four eastern Canadian ecosystems that have experienced stock collapse, Bundy et al. (2009) documented decreases in total finfish biomass in three of the four, with clear switches from demersal- to pelagic-dominated systems, indicating possible irreversible ecosystem change.
We hypothesized that environmental conditions, fishing, or both may drive broad-scale synchrony across regions and explored four of many potential explanatory variables. Here, we used total catch to represent fishing pressure because it is the available metric across all four regions. However, total catch does not necessarily relate to species-specific pressure because its impacts are multispecific in nature. Fishing mortality (direct and indirect) is differentially distributed across species, varying with target species and species-specific vulnerability to the fishing gear. Therefore, although total landings are an index of the changes in fishing regime in the GOMA over time, they are not necessarily an accurate representation of fishing mortality for all species.
Although we expected that one of these explanatory variables might drive population trends, the MAFA and the DFA indicated that both environmental conditions and fishing influence population in complex ways and that the response is species-dependent. In exploited populations such as fish, it is increasingly evident that the effects of fishing should be considered in the context of environmental conditions. Many studies have demonstrated that across the North Atlantic, stocks respond differently to intense fishing, depending on the governing temperature regime and their location within their species’ range (Lehodey et al., 2006; Brander, 2007; Frank et al., 2007; Keyl and Wolff, 2008). We did not incorporate every possible variable that might influence the population dynamics of GOMA species, nor could we test every combination and lag of the explanatory variables that we were able to incorporate. However, the work quantifies the range of coherent survey time-series in 19 fish species of the GOMA, identifies strong coherence in at least five species and lack of coherence for two others, and lays the foundation for additional studies that may elucidate the forces driving coherence and the local differences in population dynamics.
Of the species with coherent survey trends over all or part of the GOMA, five have experienced considerable declines across the GOMA: goosefish, white hake, thorny skate, Atlantic cod, and witch flounder. Pollock and American plaice also declined across the GOMA, but their survey trends were less coherent. All these species have been subjected to heavy fishing mortality, either as target species, bycatch, or both, and declining trends in the survey time-series were associated with time-lagged landings trends. Atlantic cod, white hake, pollock, thorny skate, and witch flounder are considered to be overfished and overfishing is occurring, according to recent US assessments (NEFSC, 2008; NDPSWG, 2009). Landings of goosefish have increased recently, but their status is uncertain because of a lack of data on the species and the fishery (NDPSWG, 2007).
Of the other species with coherent survey trends across the GOMA, only two had increasing trends, Atlantic herring and haddock. Coherence was high in haddock, a species whose biomass dropped to the lowest on record across the GOMA in 1990. However, since the reduction in exploitation of haddock and the introduction of closed areas in the early 1990s, the biomass in all areas has increased back to earlier levels (Brodziak et al., 2008). Atlantic herring has recovered following severe overfishing in the 1960s and 1970s (Overholtz and Friedland, 2002). Herring is a small pelagic fish that matures and reproduces younger than the larger fish species described here and may have benefited from predatory release, through the reduction in the biomass of predators (Link et al., 2002b; Bundy and Fanning, 2005), and less fishing mortality (Overholtz and Link, 2007; Overholtz et al., 2008).
The value of this comparative approach across contiguous regions is that it provides a form of replication. Replication in the classical experimental approach is difficult to impossible to produce in large-scale ecological studies. In this study of coherence in fish survey time-series, the same results were seen in the replicates and provide robust conclusions which fisheries managers would find it difficult to ignore. In this case, five large-bodied, long-lived fish species have decreased across the whole GOMA, and the implications for management are clear. Moreover, we confirm the observation by other studies that forage fish (herring) biomass is increasing, whereas biomass of large-bodied demersal fish is decreasing across the area, indicating changes in ecosystem structure and possibly in functioning (Methratta and Link, 2006; Bundy et al., 2009). As fisheries management moves towards ecosystem-based management, the management unit shifts from a single-species stock to an ecosystem. Comparative approaches at large spatial scales will be important as fisheries are assessed at the biologically relevant scale of the ecosystem rather than at the politically relevant scale of single stocks, but it is also important to evaluate contiguous surveys because large-scale climatic factors influence fish distribution and ecosystem dynamics (Blanchard et al., 2008; Cheung et al., 2009; Nye et al., in press).
Acknowledgements
The Fisheries and Oceans, Canada, Ecosystem Research Initiative provided funds for a workshop that initiated this research hosted by the NEFSC in Woods Hole. Maureen Taylor of the NEFSC provided wind data and analysis from the National Centers for Environmental Prediction (NCEP). The NOAA NMFS Fisheries and the Environment (FATE) programme supported JAN. We also thank two anonymous reviewers for their constructive comments on an earlier version of the manuscript and Alain Zuur for assistance with the Brodgar software.
