-
PDF
- Split View
-
Views
-
Cite
Cite
Mathieu Doray, Stéphanie Mahévas, Verena M. Trenkel, Estimating gear efficiency in a combined acoustic and trawl survey, with reference to the spatial distribution of demersal fish, ICES Journal of Marine Science, Volume 67, Issue 4, May 2010, Pages 668–676, https://doi.org/10.1093/icesjms/fsp277
Close - Share Icon Share
Abstract
Few analyses have been performed to estimate the efficiency of trawls targeting demersal fish using the ratio of catches and acoustic densities. In summer 2006, acoustic and fishing data were collected simultaneously over 3 d by three fishing vessels equipped with identical pelagic trawls in the Bay of Biscay. Variography identified moderate spatial autocorrelation in the acoustic backscatter at a mean scale of 3 km, a scale slightly smaller than the mean haul length (3.5 km), indicating that fish horizontal availability did not influence trawl efficiency. Acoustic backscattering densities expressed as nautical area scattering coefficients (NASCs) recorded in the trawled layer were compared with equivalent NASC (ENASC) values calculated from the species composition in the trawl, fish-length structure, and available relationships between target strength and fish length. Estimates of trawl efficiency for hake-dominated trawls were computed as the slopes of the relationships ENASC = 0.008 NASC and ENASC = 0.18 NASC0.31 for trawls made by day and night, respectively. For the whole demersal community, the relationships were ENASC = 0.022 NASC and ENASC = 0.17 NASC0.33 for trawls made by day and night, respectively.Doray, M., Mahévas, S., and Trenkel, V. M. 2010. Estimating gear efficiency in a combined acoustic and trawl survey, with reference to the spatial distribution of demersal fish. – ICES Journal of Marine Science, 67: 668–676.
Introduction
Estimating the trawl efficiency (Q), the constant of proportionality that relates trawl catch per unit effort to the true fish population density is necessary when deriving absolute abundance estimates from trawl-survey data (Fraser et al., 2007), as well as when refining estimates of catchability in stock assessment models (Somerton et al., 1999). The choice of trawl location (depth and track) determines the quantity of fish found within the area swept, which itself depends on fish availability, i.e. the abundance and spatial distribution of fish populations. The actual proportion Q of available fish hauled up onto the deck is essentially determined by gear technology (net selectivity, gear rigging, fisher skills) and fish reactions to the approaching gear (herding, escapement; Godø, 1994).
Trawl efficiency can be estimated directly from gear-comparison experiments where the gear efficiency is estimated as the quotient of fish density (catch per area swept) from the fishing gear to density estimates from another investigative tool thought to be completely efficient, such as visual or acoustic transects (Somerton et al., 1999). Few analyses have been performed to estimate trawl efficiency using the ratio of trawl catches and acoustic densities (O'Driscoll et al., 2002). This might be because the relationship between acoustic and bottom-trawl data can be vague, as demonstrated, for example, for the North Sea demersal fish community by Mackinson et al. (2005). However, a clear relationship was found between the two data types for rockfish (Sebastes spp.; Krieger et al., 2001) using a bottom trawl and for capelin (Mallotus villotus) using a midwater trawl (O'Driscoll et al., 2002). For cod (Gadus morhua), the relationship varied between size classes, daily and seasonally, and with the assumed fishing height of the bottom trawl (Hjellvik et al., 2003; Gauthier and Rose, 2005).
Here, we analyse the data obtained during a semi-controlled, combined acoustic and trawl survey to compute direct estimates of trawl efficiency for an assemblage of demersal fish exploited by semi-pelagic trawlers. Acoustic and fishing data were collected simultaneously during a short period (3 d) by three fishing vessels of similar size equipped with identical pelagic trawls, in a relatively homogeneous fishing ground of the Bay of Biscay. To account for eventual changes in fish availability during the survey, the spatio-temporal structure in the fish assemblage was first assessed by (i) monitoring the evolution of the catch composition, and (ii) estimating the spatial autocorrelation in the continuous fish acoustic densities at the survey scale (tens of kilometres). At the scale of a fishing operation, trawl efficiency varies according to the extent of spatial structuring of the fish. Schooling species often aggregate locally in large numbers, so greatly increasing the potential for catching a large number of fish in a short time (Fréon and Misund, 1999; Gauthier and Rose, 2005). Fish spatial autocorrelation can be assessed at the trawl haul scale (km) to evaluate its potential effects on trawl efficiency estimates. Direct diel trawl efficiency estimates were computed for a mixture of demersal species dominated by hake (Merluccius merluccius), blue whiting (Micromesistius poutassou), and horse mackerel (Trachurus trachurus).
Material and methods
Data collection
In July 2006, acoustic and catch data were collected in the Bay of Biscay during 3 d by three chartered fishing vessels 20 m long (FVs “Davidson”, “Hebeilan”, and “Océanie”) equipped with identical semi-pelagic trawls (four doors, 54 m headline, 50 m footrope). The survey was conducted in a flat muddy area of 30 × 12 nautical miles (hereafter miles; 1 mile = 1852 m) and constant bathymetry (100 m), known to be a major fishing ground for hake. The three vessels, sailing side by side ∼200 m apart, simultaneously sampled 28 stations positioned along five pseudo-linear transects (one transect per diel period; Figure 1a), yielding a total of 84 hauls. A subset of 72 hauls for which acoustic recordings were available was selected for further analysis. These hauls were performed at 24 trawl stations (12 by day and 12 by night). Every hour between 0:00 and 20:00, all three vessels towed a trawl with a net opening of 40 m (horizontal) by 20 m (vertical) ∼0.5 m above the seabed. Trawls were 30 min long and covered 3.5 km at a mean vessel speed of 4 knots. Catches were sorted and all or a subsample was measured and weighed. Where the catch was very large, total weight was estimated visually. The FV “Davidson” was equipped with a portable Simrad ER60 echosounder connected to an 11°-beam-angle, spherical, split-beam transducer, operating vertically at a frequency of 70 kHz. The transducer was operated at a pulse length of 0.512 ms in a paravane towed at 3–5 knots ∼2 m below the sea surface on the port side of the vessel during and between fishing stations. In situ on-axis calibration of the echosounder was performed before the cruise using standard methodology (Foote et al., 1987). Acoustic data were replayed with the Movies+ software (Weill et al., 1993), and archived in international hydroacoustic data format (HAC; ICES, 2005) at a threshold of −80 dB. The paravane had to be retrieved when the trawl was hauled onboard, introducing gaps in the linear transects (Figure 1a).
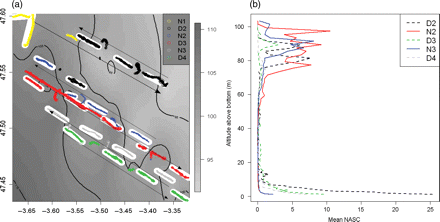
(a) Kriged bottom depths (shades of grey) and trawled areas (in white) in the study area, with log-transformed fish NASCs per successive diel period (transect). Successive transects (D2, day 2; N2, night 2; D3, day 3; N3, night 3; D4, day 4) and vessel headings are represented by different colours and arrows, respectively. The three vessels sailed side by side ∼200 m from each other along the transects. (b) Mean vertical profiles of fish acoustic density (NASC in m2 nautical mile–2) recorded along successive transects represented by different colours. Broken lines, daylight; straight lines, night.
Treatment of acoustic data
Volume backscattering coefficients (sv; MacLennan et al., 2002) greater than −60 dB were allocated to fish and integrated with Movies+ software over 80 standard bottom-depth channels of thickness 0.5 m from 0.5 to 40.5 m above the bottom, and over 36 depth channels of thickness 2 m from 40.5 m to the sea surface. Fish nautical area scattering coefficients (NASCs; MacLennan et al., 2002) per depth channels were averaged over 20 pings, creating elementary sampling units (ESUs) 0.02 miles (40 m) long at a mean speed of 4 knots. Values of fish NASC per depth channels were then summed over the depth range sampled by the pelagic trawl, considered to extend from 0.5 to 40.5 m from the seabed. This depth stratum will be referred to as the trawled layer hereafter, even when no trawl was performed, i.e. between trawling stations. Although the vertical trawl opening was 20 m, the effective fishing height of the trawl was in fact expected to be higher, because fish have been recorded diving in response to vessel noise (Hjellvik et al., 2003). As most bottom-fish backscatters were detected 0–20 m above the seafloor (Figure 1b), the actual limit was not important. Total NASC values, NASCtot(t), recorded on board FV “Davidson” during trawl station t were calculated as the average NASC values in the trawled layer in ESUs located along the haul tracks.
Treatment of catch data

 the (estimated) catch in numbers of species s at station t by vessel v, and
  is the theoretical backscattering cross section (MacLennan et al., 2002) of species s. A was estimated based on trawl geometry recorded on FVs “Hebeilan” and “Océanie”, using SCANMAR systems. Values of
  were computed from
  , where TS is the theoretical (literature) value of target strength by species, listed in Table 1. As species-specific TS–length relationships were not available for 70 kHz, we used equations from closely related species at available frequencies (38 kHz; the reference species in Table 1). The values of ENASCs(t, v) for all species were summed per haul to compute the total ENASC values, ENASCtot(t, v), for trawl station t and vessel v.
Values used to compute theoretical TS values of sampled species, as a function of fish length L, where TS = 20 log(L) + b20.
| Species sampled . | Reference species . | b20 . | Frequency (kHz) . | Source . |
|---|---|---|---|---|
| Hake (Merluccius merluccius) | Merluccius gayi | −68.5 | 38 | Lillo et al. (1996) |
| Blue whiting (Micromesistius poutassou) | Micromesistius poutassou | −71.9 | 29 | Robinson (1982) |
| Sardine (Sardina pilchardus) | Physostome | −71.9 | 38 | Foote (1987) |
| Horse mackerel (Trachurus trachurus) | Trachurus trachurus capensis | −66.8 | 38 | Barange et al. (1996) |
| Mackerel (Scomber scombrus) | Scomber scombrus | −84.9 | 38 | Edwards et al. (1984) |
Diel variations
Diel differences in fish vertical distribution were assessed by computing mean vertical profiles of fish acoustic densities for each linear transect. The following procedure was then applied to remove the influence of vertical diel migrations from fish log-transformed acoustic densities recorded in the trawled layer. Let NASC(i) denote the mean NASC value recorded in the trawled layer in ESU i. NASC(i) values were ln(x + 1) transformed to approach a normal distribution.

Fish horizontal distribution
Ideally, trawl efficiency estimates need to be computed based on trawl samples of fish communities consisting of more-or-less randomly distributed fish density to avoid mixing the spatial variance, i.e. the variance originating from fish availability, with the intrinsic variability of the catching process, which originates in the reaction of the fish to the gear. Based on the continuous acoustic data, we assessed the dominant spatial scales at which species densities varied and compared them with the sampling scales. At the scale of the survey, we first checked that the mean length of the sampling units (trawls of 3.5 km) was larger than the mean width of the unit objects (fish patches) to verify whether fish patches were, on average, effectively sampled (Dungan et al., 2002). Second, we checked that fish distributions along tracks were random to ensure that trawl-efficiency estimates were computed based on homogeneous fish communities.
At a survey scale, diel-detrended, log-transformed, fish acoustic densities, R, integrated in ESUs of length 20 pings were first averaged within larger units of 0.1 miles (185.2 m) to adapt the spatial resolution, or support, of acoustic data to the extent of the survey area (30 × 12 miles). Experimental variograms of geolocalized values of R [Equation (2)], were computed for each linear transect. The basic multiple of lag distance was the new support size (0.1 miles). Models of spherical functions with a nugget term were fitted by eye to the experimental variograms of each transect. The sills were determined to ensure that sample and model dispersion variance values were close to each other (Rivoirard et al., 2000). Variogram models were fitted over distance lags with significant number of pairs (generally up to half the maximum sample extent). Mean dimensions of aggregative patterns were estimated by variogram model range, i.e. the distance beyond which the correlation between point values vanished (Petitgas, 2001). The spatial variance in the data was estimated by computing the ratio of the spherical component sill to nugget sill + spherical component sill for each transect.
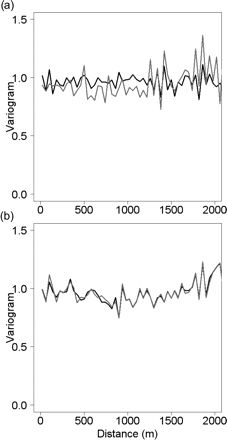
At the scale of individual trawls (40 m to 4 km), fish-spatial structure was studied by computing empirical variograms of ln(x + 1) transformed, diel-detrended, NASC values recorded in 40 m long ESUs and scaling them to the data variance (normalization) at each trawl station. Normalized variogram values were averaged within each variogram distance class for all day and night stations and for day/night stations dominated by hake. The resulting mean daylight and night normalized variograms were analysed to assess the spatial structure of the global demersal fish community, as well as the fish assemblage dominated by hake.
Trawl efficiency estimates


The choice of the distribution and the link function (g(·)) was made to ensure no violation of GLM assumptions (homoscedasticity, normality of residuals). Hauls by day and night were analysed separately. To test for differences in gear efficiency between species, diel trawl efficiency coefficients were estimated for subsets of trawl stations where the proportion by weight of one species was >50% in at least one of the three parallel trawl hauls. Trawl efficiency coefficients were also computed for all stations combined (day and night), as an estimate of the mean trawl efficiency on the demersal fish community in the area. Systematic vessel effect was also tested.
Statistical analyses were implemented using the R statistical environment (R Development Core Team, 2009), supplemented with the package geoR (Ribeiro and Diggle, 2001) for geostatistical computations.
Results
Species composition of trawl hauls
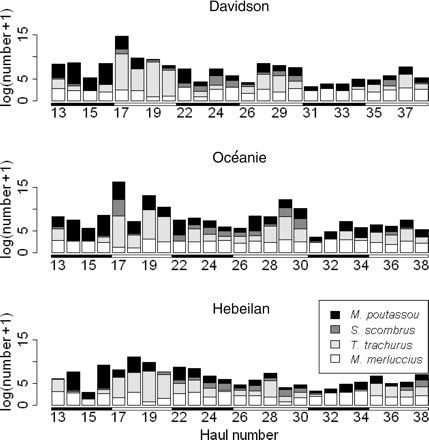
Trawl catches were dominated in weight by hake (38%), horse mackerel (33%), and blue whiting (23%). Hake catch weights were fairly constant throughout the survey (Figure 2), but diel variations in the size distribution were fairly dramatic. Hake mean size was ∼30 cm by day but a second length mode appeared at night, with catches of smaller fish of mean length 20 cm (Mahévas et al., 2008). Large catches of horse mackerel were made during day 2 (Figure 2), at the same time as dense schools were detected acoustically (results not shown).
Species composition per trawl station for the different fishing vessels. Species names are listed in Table 1. Diel periods are shown by the bars above the station numbers. Black, night; white, daylight.
The hake proportion by weight in the catches was >50% in the catch of at least one vessel for five stations (14 hauls, one vessel skipped one station) by day and for six stations (18 hauls) by night. The mean species compositions by weight of hake-dominated hauls were: hake, 47% by day and 72% by night; horse mackerel, 27% by day and 6% by night; and blue whiting, 18% by day and 16% by night. The proportion by weight of horse mackerel in the catches was >50% in at least one haul for eight stations (24 hauls) by day. The mean species composition of horse-mackerel-dominated hauls was: hake, 18%; horse mackerel, 69%; and blue whiting, 9%.
Diel variations
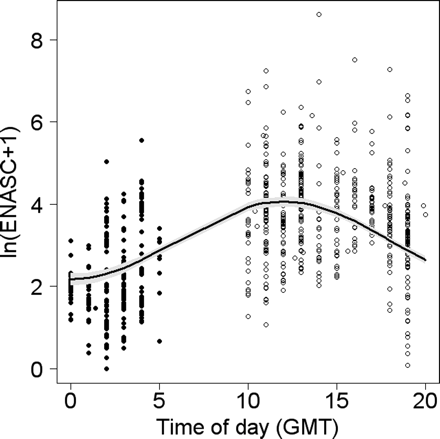
Diel vertical variations were observed in the acoustic data throughout the survey. By day, fish concentrated close to the seafloor, and their total abundance fluctuated from one day to the next (dashed lines in Figure 1b). At night, fish were distributed closer to the surface in scattered layers (continuous lines in Figure 1b) and displayed less inter-day variation in abundance. At the survey scale, a significant diel trend (r2 = 0.3, F-test p-value < 2.2e–16) was found in the data (Figure 3), and removed before further spatial analyses.
Fit of the diel trend model (black line), with confidence intervals (grey area), overlaid on log-transformed daylight (open circles) and night-time (dots) acoustic densities of fish.
Fish horizontal distribution
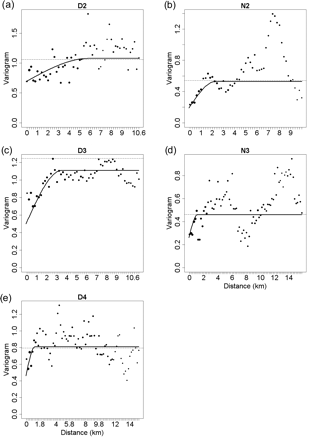
At the scale of the survey, variograms of diel-detrended, log-transformed fish acoustic densities revealed the presence of spatial autocorrelation in the fish distribution for all transects (Figure 4). There was no significant difference in either the spatial correlation range or the magnitude between day and night, according to the spread of confidence intervals around diel means, under the assumption of normality (Table 2). Spatial structure in the data was moderate, the spatial variance accounting for 48% of the total variance on average (s.d. 11%; Table 2). The mean range of spatial patches was 2.7 km (s.d. 1.9 km; Table 2).
Data variance (dotted line), experimental variogram (dots, diameter proportional to the number of pairs in the distance lags), and variogram model (solid line) of log-transformed, diel-detrended fish acoustic densities, for transects (a) D2 = day 2, (b) N2 = night 2, (c) D3 = day 3, (d) N3 = night 3, and (e) D4 = day 4. Distance lags are 0.1 nautical miles (0.1825 km).
Variogram models of diel-detrended, log-transformed fish acoustic densities for each transect.
| Transect . | Variogram model . | Nugget . | Sill . | Range (km) . | % spatial variance . |
|---|---|---|---|---|---|
| D2 | Spherical | 0.69 | 0.39 | 5.6 | 36 |
| N2 | Spherical | 0.19 | 0.34 | 2.2 | 64 |
| D3 | Spherical | 0.5 | 0.61 | 3.3 | 55 |
| N3 | Spherical | 0.26 | 0.2 | 1.1 | 43 |
| D4 | Spherical | 0.46 | 0.35 | 1.1 | 43 |
| Day average (s.d.) | – | 0.55 (0.12) | 0.45 (0.14) | 3.3 (2.2) | 45 (10) |
| Night average (s.d.) | – | 0.23 (0.05) | 0.27 (0.10) | 1.7 (0.8) | 54 (14) |
| Overall average (s.d.) | – | 0.42 (0.20) | 0.38 (0.15) | 2.7 (1.9) | 48 (11) |
D2, day 2; N2, night 2; D3, day 3; N3, night 3; D4, day 4. The percentage of spatial variance is the ratio sill/(sill + nugget).
The variogram sum of sills was systematically higher by day than by night, meaning that the total variability in fish density along any transect line was higher by day (Figure 4). The mean range of fish patches was 2.7 km, slightly smaller than the mean distance covered by a trawl (3.5 km). In other words, the sampled object unit was smaller than the sampling unit, so we could assume that our observation scale was appropriate to capture fish-spatial structure.
At the scale of individual trawls, the mean empirical variograms by day and night were generally flat, showing no sign of spatial structure in fish acoustic density (Figure 5). The fact that no spatial correlation was found at this scale confirms our belief that estimates of trawl efficiency were not biased by fish availability.
Mean normalized variograms of log-transformed, diel-detrended fish acoustic densities computed for (a) all daylight trawls (black line) and hake-dominated daylight trawls (grey line), and (b) all trawls by night (black line) and hake-dominated night hauls (grey line). Distance lags are the acoustic ESUs (40 m).
Estimates of trawl efficiency
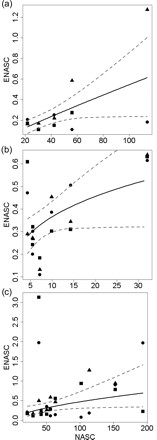
After controlling for fish availability effects, we computed trawl efficiency estimates by modelling ENASC as a function of NASC values. For day or night hake-dominated hauls and overall for night trawls, the best-fitting model was a GLM assuming a gamma distribution and a log-link function. No model was suitable for horse-mackerel-dominated hauls. For overall daylight hauls, the best-fit model was a log-linear model assuming a Gaussian distribution for residuals.
The average trawl efficiency coefficient of hake-dominated hauls by day was 0.008 (50% deviance explained; Figure 6a, Table 3). The estimated exponent b was 0.91 and not significantly different from 1 (Table 3). At night, the average trawl efficiency of hake-dominated hauls was higher than by day, at 0.18 (23% deviance explained; Figure 6b, Table 3). The exponent estimate was 0.31 (Table 3), so b was significantly different from 1. Trawl-efficiency coefficients did not vary systematically between fishing vessels for hake-dominated hauls (results not shown).
Relationship between total ENASCs per haul and vessel (dots, “Davidson”; triangles, “Océanie”; squares, “Hebeilan”) and total NASCs per haul recorded on FV “Davidson” (straight line) with confidence intervals (broken lines), computed for (a) hake-dominated daylight hauls, (b) hake-dominated night hauls, and (c) all daylight hauls.
Estimates of trawl efficiency coefficients (Q) and exponents (b) from the models relating ENASC derived from trawl catches to observed NASC, along with the percentage of deviance explained by the model, with s.d. values in parenthesis.
| Species . | Error distribution . | Diel period . | Q estimate . | b estimate . | % deviance explained . |
|---|---|---|---|---|---|
| Hake | Gamma | Day | 0.008 (0.026) | 0.91 (0.28) | 50 |
| Hake | Gamma | Night | 0.180 (0.045) | 0.31 (0.14) | 23 |
| All species | Normal | Day | 0.022 (0.051) | 0.68 (0.28) | 14 |
| All species | Gamma | Night | 0.170 (0.065) | 0.33 (0.1) | 25 |
All trawls by day and night, whatever the species composition, were considered in the final analysis. Eight daylight hauls out of 38 contained very large quantities of horse mackerel, whose total weight was imprecisely estimated visually. Hence, we considered that the values of ENASCtot computed for those hauls were dubious and excluded them from the analysis. The average daylight trawl-efficiency estimate of the demersal community for pelagic trawls was 0.022 (14% variance explained; Figure 6c, Table 3), with an exponent of 0.68 (Table 3), which was not significantly different from 1. At night, estimates differed markedly from those by day, and trawl efficiency was greater: 0.17 (25% deviance explained; Table 3), with an exponent of 0.33 (Table 3), significantly different from 1. Again, the trawl efficiency did not vary systematically between fishing vessels for the whole demersal community.
Discussion
We believe that our results have demonstrated that catch-efficiency estimates of pelagic trawls targeting demersal species can be computed at a coarse scale (tens of kilometres) by combining fishing and acoustic data, if fish density is (i) distributed randomly along haul tracks, and (ii) positioned slightly above the seabed. Night exponents and trawl-efficiency estimates differed markedly from those estimated by day. Observed discrepancies in trawl efficiency were probably due to the presence of more, mainly smaller (20 cm length class) hake within the zone of the trawl, which were not there by day (Mahévas et al., 2008). Besides differences in avoidance reactions attributed to different light levels or fish diel activity (accounted for by the trawl efficiency coefficient), estimates of b < 1 in fact represent a net reduction of the hake biomass available to the trawl at night, which could be explained by a higher trawl selectivity for smaller hake then.
Spatial information in acoustic data has been used before to increase the precision and accuracy of trawl-based abundance estimates (Bez et al., 2007). The originality of our approach lies in the quantitative study of fish spatial distribution before trawl efficiency computations to control for fish availability effects. Hake were caught in relatively constant proportions throughout and appeared to be widely and randomly distributed in the area, corroborated by small-scale video observations conducted in an area close to the current study (Trenkel et al., 2007). We therefore assume that the spatial distribution and trawl efficiency coefficient of hake was reasonably well assessed with our survey design. Comparison with other trawl efficiency coefficients in the literature is not straightforward, because fishing efficiency varies according to species, size, geographic area, season, and fishing gear. Our estimate of the trawl efficiency for hake-dominated daylight trawls is an order of magnitude smaller than estimates based on survey trawls of hake in the Celtic Sea (Trenkel and Skaug, 2005) and the North Sea (Fraser et al., 2007). This difference might in part be explained by differences in fishing gear and protocol, because previous studies used Grande Ouverture Verticale (GOV) bottom trawls. The GOV provides access to fish close to the seabed (difference in fish availability) and largely prevents fish escaping below the footrope (difference in trawl efficiency), somewhat different from the characteristics of our pelagic trawl, which was set to operate at ∼0.5 m above the seafloor. Moreover, trawl species composition was relatively variable and diverse in our data, perhaps the consequence of mobile schools of species such as horse mackerel or blue whiting moving through the area. As the accurate allocation of fish acoustic energy to each species found in the catches was not possible, our estimates of trawl efficiency represent the vulnerability of a mixture of demersal species to a pelagic trawl. A large number of hauls is therefore required to maximize the odds of obtaining a sufficient number of catches dominated by a particular species to allow for computation of the species-specific estimates of trawl efficiency.
This multispecies environment and the absence of species- and frequency-specific TS–length equations to compute ENASC values (Table 1) were limiting factors in our work, compared with studies focusing on single well-known species, such as cod (Hjellvik et al., 2003), rockfish (Gauthier and Rose, 2005), or capelin (O'Driscoll et al., 2002). Within the range of acoustic frequencies commonly used in fisheries acoustics (12–200 kHz), fish species that possess air-filled swimbladders have similar multifrequency acoustic signatures owing to the dominance in backscattering of the swimbladder (SIMFAMI, 2005). We therefore assume that the use of TS–length equations established at 38 kHz (or at 29 kHz for blue whiting; Table 1) did not introduce a major bias in the computations of ENASC estimates derived from acoustic backscatters recorded at 70 kHz. Dealing with the lack of species-specific TS–length relationships, Foote's (1987) equation is considered a fair description of the target strength of clupeoid fish such as sardine (Simmonds and MacLennan, 2005). On the other hand, no species-specific TS–length equations were available for physoclistous fish such as hake or horse mackerel, so the equations we used were established for species of the same families in other locations (Table 1). Their b20 parameter being close to those proposed by Foote (1987) for physoclistous fish, we assume that their use did not introduce a large bias in the ENASC computations, compared with the results that would have been obtained with the generic equation. However, establishing specific TS–length equations for these species is a priority to improve the precision of fishing efficiency estimates in the study area.
Another question that arises when comparing acoustic densities and trawl catches of demersal fish is whether the trawls and the echosounder actually measure the same thing. In our case, the footrope of the semi-pelagic net operated 0.5 m above the seabed, i.e. above the acoustic dead zone extending 0.5 m above the seabed at a pulse length of 0.512 ms. A bottom offset of 0.5 m was used for the echo-integration of fish backscatters to exclude echoes from the dead zone and to ensure that fish acoustic densities and catches were measured in the same depth range. However, aside from classical avoidance reactions accounted for by the estimated trawl efficiency coefficients, i.e. swimming down the footrope or up the headrope, some demersal fish located under the footrope might have reacted to the disturbance caused by the trawl by swimming up into the net. The vertical distribution of hake is not well-documented, so the possibility that ENASC values might have been biased upwards by such vertical avoidance reactions cannot be ruled out. However, a combined acoustic/trawl study conducted in Namibia showed that the closely related deep-water Cape hake (Merluccius paradoxus) of size similar to that of M. merluccius caught by day during our study, were generally more abundant 5–50 m off the seabed, whereas larger shallow-water Cape hake (M. capensis) in the same area dominated strata just off the seabed (Huse et al., 1998). If such a diurnal size-at-depth distribution also applies to M. merluccius, the abundance of 30-cm hake located within the 0.5-m unsampled layer would have been low by day. In that case, one could assume that the bias introduced in ENASC values by the vertical avoidance of that fraction of unsampled hake into the trawl was small.
Besides very localized schools of horse mackerel, significant spatial correlation was found in the demersal fish spatial distribution at the scale of 3 km. This scale corresponds to school clusters, previously documented for Pacific hake (M. productus) by Swartzman (1997).
Estimated trawl efficiency varied between species and diel periods and it can safely be assumed that they would change from one fishing ground or season to another. Such coefficients of gear efficiency could be computed routinely based on trawl-survey data or catches and acoustic data recorded on board commercial vessels equipped with calibrated echosounders and automatic dataloggers. They could then provide useful insights into the larger-scale variability of the catching process, as well as catchability estimates to be used in stock assessment in the absence of long time-series of fisheries statistics (Somerton et al., 1999).
Acknowledgements
We received financial support from the European funding scheme IFOP, and thank the crews of FVs “Davidson”, “Hebeilan”, and “Océanie” for their assistance during the CHAPAUV survey. We are also grateful to our colleagues C. d'Ardeville, B. Mesnil, P. Lorance, L. Pennors, and A. Péronnet for assisting with data collection during the survey. The referees and the editor are thanked for their thoughtful comments, which greatly improved the manuscript.


