-
PDF
- Split View
-
Views
-
Cite
Cite
Juan P. Zwolinski, Paulo B. Oliveira, Victor Quintino, Yorgos Stratoudakis, Sardine potential habitat and environmental forcing off western Portugal, ICES Journal of Marine Science, Volume 67, Issue 8, November 2010, Pages 1553–1564, https://doi.org/10.1093/icesjms/fsq068
Close - Share Icon Share
Abstract
Relationships between sardine (Sardina pilchardus) distribution and the environment off western Portugal were explored using data from seven acoustic surveys (spring and autumn of 2000, 2001, 2005, and spring 2006). Four environmental variables (salinity, temperature, chlorophyll a, and acoustic epipelagic backscatter other than fish) were related to the acoustic presence and density of sardine. Univariate quotient analysis revealed sardine preferences for waters with high chlorophyll a content, low temperature and salinity, and low acoustic epipelagic backscatter. Generalized additive models depicted significant relationships between the environment and sardine presence but not with sardine density. Maps of sardine potential habitat (SPH) built upon the presence/absence models revealed a clear seasonal effect in the across-bathymetry and alongshelf extension of SPH off western Portugal. During autumn, SPH covered a large part of the northern Portuguese continental shelf but was almost absent from the southern region, whereas in spring SPH extended farther south but was reduced to a narrow band of shallow coastal waters in the north. This seasonal pattern agrees with the spatio-temporal variation of primary production and oceanic circulation described for the western Iberian shelf.Zwolinski, J. P., Oliveira, P. B., Quintino, V., and Stratoudakis, Y. 2010. Sardine potential habitat and environmental forcing off western Portugal. – ICES Journal of Marine Science, 67: 1553–1564.
Introduction
Small pelagic fish (SPF; sardine and anchovy) play a key ecological role in coastal ecosystems, transferring energy from plankton to upper trophic levels (Cury et al., 2000). Their relatively low position in the marine foodweb, together with a short lifespan and a reproductive strategy of producing large quantities of pelagic eggs over an extended spawning season, render them greatly dependent on the environment (Bakun, 1996). At scales spanning from days to weeks and from tens of metres to tens of kilometres, the distribution of SPF largely responds to environmental stimuli (Mackinson et al., 1999; Robinson, 2004; Barange et al., 2005). However, at any given time, the environmental factors that drive them distribution can be confounded by biological constraints such as population size, demographic structure, or spatio-temporal lags between the environment and biological processes (Grémillet et al., 2008). As a result, understanding the environmental conditions that drive the distribution of SPF by defining their potential habitat requires information over large spatial and temporal scales (Mackinson et al., 1999; Planque et al., 2007). Only when the species distribution and the concurrent environmental variables are observed and collected over a wide range of conditions (such as those obtained during a series of synoptic monitoring surveys) can the statistical relationships indicative of dependence or covariability be derived (Guisan and Zimmermann, 2000; Barry and Elith, 2006).
Sardine, also called European pilchard (Sardina pilchardus), can be found throughout the North Atlantic eastern continental margin from Senegal to the British Isles and in the Mediterranean and adjacent seas (Parrish et al., 1989). They are commercially exploited across their distribution range, with the most important fisheries in upwelling areas. Sardine are eurythermic and euryhaline clupeoids that generally inhabit waters with temperatures ranging from 8°C to 24°C and salinities from 30 to 38 psu (Haynes and Nichols, 1994; Giannoulaki et al., 2005; Coombs et al., 2006; Petitgas et al., 2006; Stratoudakis et al., 2007). Similar to other clupeoids, they are opportunistic omnivorous feeders well adapted to the variable food sources available in upwelling systems (Bode et al., 2004; Somarakis et al., 2006; Garrido et al., 2007). In Portugal (Figure 1), the sardine is the most important marine resource, being fished by purse-seiners in coastal waters (Stratoudakis and Marçalo, 2002). The majority of the Portuguese landings is caught by the purse-seine fleet operating north of Lisbon (ICES, 2006; Silva et al., 2009), in an area known to have a relatively high abundance of both adults and recruits (Carrera and Porteiro, 2003). South of Lisbon, commercial catches and estimates from acoustic surveys show that sardine abundance is usually less than that in the north.
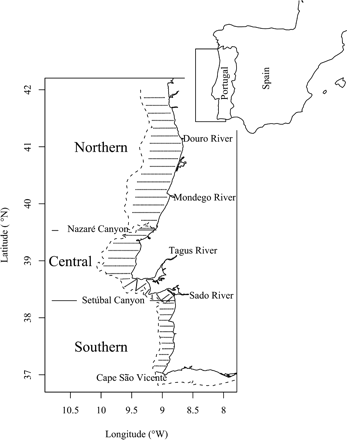
The survey region, with full and dashed lines representing the coast and the 200 m isobath contour, respectively. The dots along parallel lines mark 1 nautical mile long acoustic samples. The transect separation is 8 nautical miles.
The Iberian Peninsula is situated at the northern limit of the North Atlantic Upwelling Region. Off western Iberia, winds favourable for upwelling occur more consistently between April and October (Fiúza et al., 1982), but with short upwelling episodes all year round (Santos et al., 2004). Along the western Portuguese continental shelf, water characteristics show a gradual north/south trend, with colder, less saline, and nutrient-richer waters in the north and warmer, more-saline, and nutrient-poorer waters in the south (Peliz and Fiúza, 1999). Along the northern coast, a low-salinity-buoyant plume (the Western Iberian Buoyant Plume; WIBP) is recurrent on the inner shelf owing to the high freshwater run-off. The WIBP has been identified as an important feature for retention and growth of early stages of SPF (Santos et al., 2004). Also, because of enrichment from river run-offs, productivity in coastal waters of the northern Portuguese shelf is relatively high during winter, contrasting with the more oligotrophic conditions over the narrow continental shelf south of Lisbon (Peliz and Fiúza, 1999). The whole western Portuguese continental shelf is also rich in temporary oceanographic events that reshape and confound the mesoscale (tens to hundreds of kilometres) oceanographic patterns described above (Relvas et al., 2007).
Under the hypothesis that sardine-mesoscale-spatial distribution is driven by environmental forcing, we aimed to describe the environmental conditions suitable for sardine presence off western Portugal. Sardine distribution obtained during seven acoustic surveys (spring and autumn of 2000, 2001, 2005, and spring 2006) was used to explore the relationships with a set of environmental variables measured in situ. These were salinity, temperature, and fluorescence from chlorophyll a measured 3 m deep, and acoustic backscatter at 38 kHz from diffuse-backscattering targets (DBTs) integrated over the water column. Generalized additive models (GAMs) were used to capture synoptic multi-annual relationships between the species distribution and the relevant environmental variables. The SPH for each survey, i.e. the spatial extent where a suitable environment existed, was recreated by spatially interpolating and mapping the habitat conditions measured in the discrete sampling locations. Finally, the results were evaluated in the context of existing understanding of water circulation and productivity patterns off western Iberia.
Material and methods
Data collection
The study took place on the western Portuguese continental shelf (Figure 1), from the Portuguese/Spanish border (River Minho; 41°54.4′N 8°54.5′W) to Cape São Vicente (southwest Portugal at 37°1.45′N 8°59.71′W). Three distinct areas can be considered based on the geomorphology of the shelf and historical records of sardine distribution. The northern region, from the northern Portuguese border to the Nazaré Canyon, is characterized by a wide (50–60 km) soft-bottom continental shelf with intense freshwater run-off, mainly from the Rivers Minho, Douro, and Mondego. It is an area of abundant sardine and recurrent recruitment (Carrera and Porteiro, 2003; ICES, 2006; Silva et al., 2009). The central region, from the Nazaré Canyon to the Setúbal Canyon, is characterized by a wide extension of shallow rocky bottom followed by a relatively narrow shelf influenced by river run-off from the Tagus and Sado estuaries. Adult sardine are ubiquitous there, whereas recruits are frequently found between the Sado and Tagus Rivers. Finally, the southern region, extending south of the Sado River to Cape São Vicente, is characterized by a narrow (∼25 km), rocky bottom, and steep continental shelf with little influence from the river run-off. Compared with the other two regions, sardine presence is less frequent and only adult fish are encountered (ICES, 2006).
Acoustic data were obtained during seven acoustic surveys (March and November 2000, March and November 2001, April and November 2005, and April 2006). The acoustic sampling design (Figure 1) was the same for all surveys and consisted of a regular track with an inter-transect distance of 8 nautical miles covering the continental shelf between 20 and 170/200 m. Surveying was limited to daylight (Zwolinski et al., 2007) and the vessel speed was ∼10 knots. Acoustic sampling was performed with a Simrad EK500 echosounder, operating through a hull-mounted 38 kHz, 7°×8° split-beam transducer emitting 1-ms-long pulses at a rate of 1 pulse s−1. The echosounder was calibrated before each survey by means of a copper sphere, according to the standard procedure (Foote et al., 1987). The echograms were digitally stored and post-processed with MOVIES+ software (Weill et al., 1993). Echogram scrutiny for sardine was visual and supported by pelagic and demersal trawls performed on representative echotraces. Epipelagic echotraces other than fish schools or school-like aggregations were classified as DBTs. These are characterized by their relatively low and homogeneous values of volume-backscattering strength (Sv) and diffuse boundaries. Acoustic samples for sardine and DBTs were obtained by performing echo-integration from 20 cm above the seabed to 3 m below the transducer, along 1 nautical mile elementary distance sampling units. The minimum Sv integration threshold for fish and DBT was set at −60 dB, which is the value used for echo-integration of sardine for assessment purposes. For DBTs, the −60 dB value ensures that backscattering from physical sources such as turbulence (e.g. pycnoclines, horizontal shear; Goodman, 1990; Lavery et al., 2007) or typical sardine prey (phyto- and microzooplankton organisms; Bode et al., 2004; Garrido et al., 2008) are most likely not captured (Lavery et al., 2007). With this threshold, DBT echoes are likely attributed to aggregations of highly reflective targets such as elastic-shelled or gas-bearing planktonic organisms (Stanton et al., 1996; Mair et al., 2005). However, as the surveys were aimed at assessing the abundance of SPF, there was no concurrent plankton sampling, precluding quantitative characterization of the planktonic community.
Along the transects, seawater from 3-m deep was pumped on board by means of a side-mounted submersible pump. Salinity (psu) and temperature (°C) from the pumped water were monitored at a rate of 1 measurement per second by a Seabird SBE thermosalinograph (initial accuracy of 0.002°C for temperature and 0.005 psu for salinity). Fluorescence (a proxy for chlorophyll a concentration) from the pumped water was measured at a rate of 1 measurement per second using a Wetlabs WS3S-963P fluorometer (sensitivity > 0.03 µg l−1). Data from the thermosalinograph and the fluorometer were gathered by Environmental Data Acquisition System (EDAS) software version 1.5, set to provide geo-referenced 18-min sample averages (corresponding to 3 nautical mile integration intervals at a speed of 10 knots). The 18-min samples were posteriorly associated with the nearest acoustic sample. Together, the acoustic nautical area scattering coefficient (NASC; MacLennan et al., 2002) originating from DBTs and the surface oceanographic variables constituted the set of environmental variables used to characterize sardine habitat.
Statistical analysis
Sardine environmental preferences were analysed using the data from all but the spring 2006 survey. The 2006 data were used to test the predictive ability of the fitted habitat model.

Apart from the NASC of DBTs for which we have no source of comparison available, the environmental variables encountered during the surveys had values that were well within the range of adult sardine physiological-tolerance limits (Haynes and Nichols, 1994; Stratoudakis et al., 2007). This fact suggests that the effect of the environmental variables on the pattern of space occupation by sardine, if any, might not be related to sardine physiological stress. Instead, the studied variables might be surrogates for food availability, better spawning conditions, energy savings, or other unknown benefits associated with particular water masses. In these cases, it might not be the absolute values of the environmental variables that drive the species distribution, but their relative values. When data from several years are combined in a single analysis, the signals from the annual gradients might fade or be lost through interannual variability. Therefore, for each survey, the environmental variables were standardized by subtracting their respective survey mean and dividing by the survey standard deviation. Fluorescence and DBT (NASC + 1) were log-transformed before standardization to reduce the positive skewness of the raw data. The presence of structure in the environmental variables was tested by principal component analysis (PCA; Venables and Ripley, 2002).
The relationships between acoustic density and presence of sardine against the environmental variables were tested by GAMs. GAMs were chosen by their ability to fit a wide range of models (Wood, 2006). GAMs with a binomial error distribution and a logit-link function were fitted to sardine acoustic presence (binary response), and models with a negative binomial distribution and a log-link function were fitted to sardine NASC (continuous response). For both sardine presence and sardine NASC models, the tested explanatory variables were the set of standardized salinity, temperature, fluorescence, and DBT NASC, fitted either as single or multidimensional (up to three dimensions) smoothers using the default thin-plate spline basis available in the package mgcv (Wood, 2006) for R. A set of alternative models with varying degrees of complexity was built for both sardine NASC and sardine presence. To avoid overfitting, the gamma parameter in the GAM formulation was iteratively adjusted (up to 2.3 in the binary model) so that, in the final models, the estimated number of degrees of freedom remained <10% of the number of samples when working with density data or 10% of the number of the least represented class for the presence/absence data (Harrell et al., 1996). The estimation of the smoothing parameter was done by generalized cross-validation, and the scale parameter was assumed unknown. Model selection, i.e. the exclusion or reduction of smoothing terms, was done via a mixed (backward and forward) stepwise process following the guidelines given in Wood and Augustin (2002) and Wood (2006). These include the closeness of the selected numbers of degrees of freedom of the smoother to 1, the envelope of the approximate confidence interval for the smoothers containing 0 throughout their range, and the values of the statistic representing the compromise between quality of fit and complexity of the models, such as generalized cross-validation score (GCV) or Akaike Information Criterion (AIC). For binary models, given the impossibility of using the percentage of deviance explained (McCullagh and Nelder, 1997), the global fit was assessed by the area under the receiver operating characteristics (ROC; Hanley and McNeil, 1982). This statistic represents the probability that for a random pair of presence (1) and absence (0) values, the fitted probability of the presence is higher than the fitted probability of the absence (Fawcett, 2006). The area under the ROC curve (AUC) is a particularly appealing statistic when comparing the models' performance over different scenarios of sardine abundance. As we defined the habitat suitability as a continuous measure between 0 and 1 (the output of a binomial model), the absolute values at which sardine are to be found is likely to change with abundance. Under large population levels, sardine are expected in less than optimal conditions. Conversely, when abundance is low, the sardine are most likely to occupy the most suitable habitat (McCall, 1990). Therefore, there is probably not a single value for the habitat index that can serve as a threshold for suitable habitat for all population levels. Using the AUC value, we can simply evaluate, both for each survey and for the whole dataset, if sardine presences are being attributed to, on average, higher fitted values than sardine absences. Finally, to verify the lack of important variables in the model (Barry and Elith, 2006) and to examine the scale of the processes under study (Mackinson et al., 1999), the spatial structure of the models' residuals and that of the original data were evaluated by variography (Chilès and Delfiner, 1999).
For each survey, a map of sardine potential habitat (SPH), expressed as the probability of sardine presence, was built by evaluating the multi-annual synoptic relationships obtained by GAMs at the environmental variables observed in each acoustic sample.
Results
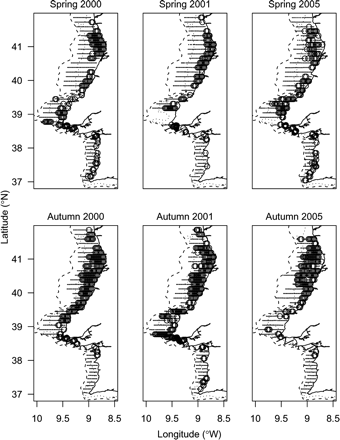
Sardine were found preferentially in waters <100 m deep, typically in coastal shallow areas (Figure 2). The indicator semivariograms for sardine presence/absence revealed a relatively low level of small-scale spatial correlation (average nugget effect around 30% of the sill) and an average (isotropic) correlation distance of 16 nautical miles.
Distribution of acoustic samples with sardine presence (circles) superimposed on the distribution of total acoustic samples (dots) for each of the surveys used to model SPH.
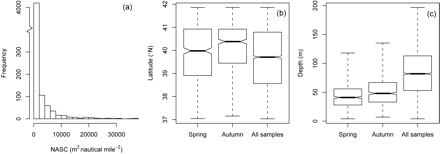
Overall, sardine NASC had a large number of zeroes (75% of the total samples) and a skewed distribution of the positive values (Figure 3a). The pooled (across surveys) mean and maximum NASC of positive samples were 2272 and 36 800 m2 per square nautical mile, respectively.
(a) Pooled distribution of NASC attributed to sardine on a linear scale. (b) Latitudinal and (c) bottom depth distribution of acoustic samples with sardine presence by season, together with the latitudinal and bottom depth distributions of all acoustic samples (including sardine absence). The whiskers extend the entire range of the data distribution. (Note that when the notches of two boxplots do not overlap there is strong evidence that the two medians differ; Chambers et al., 1983.)
In all surveys, the northern region made the greatest contribution to the sardine accumulated acoustic backscatter over the survey area, varying between 55% of the total in spring 2000 and 98% in autumn 2005. The lowest contribution to the total sardine backscatter by survey was always in the south, where it never exceeded 10%. The central region always exhibited intermediate values. This pattern was also reflected in the proportion of non-zero samples in each region, with an increasing spatial occupation towards the north. Overall, the northern region always exhibited the highest percentage of occupied area, followed by the central and southern regions. Seasonal differences in sardine distribution were evident, with a southward shift during spring (Figure 3b) that promoted statistically significant variations in the proportion of occupied area across season in each region. In the northern region, the proportion of samples with sardine presence reduced from 0.42 in autumn to 0.35 in spring (p < 0.01), mainly by contraction into shallower waters. In the central region, the seasonal effect was reversed and less intense, with an increase in sardine prevalence from 0.2 in autumn to 0.26 during spring (p < 0.05). The southern region followed the same trend as the central region, with an autumn prevalence of 0.05 that rose to 0.11 in spring (p < 0.01). Finally, during spring, sardine were usually found shallower than in autumn (Figure 3c).
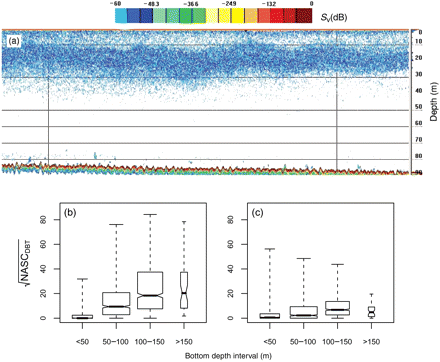
Seasonal and geographical differences were also found in the environmental variables. Large NASC values attributable to DBTs, found as uniform layers of large horizontal extension (Figure 4a), were more frequent and had greater acoustic intensity during spring, reaching values of up to 7000 m2 per square nautical mile (Figure 4b, c). DBTs were usually distributed over large areas in the mid to outer shelf (bottom depth 100–150 m) and absent from coastal waters.
(a) Echogram at 38 kHz of DBTs, the vertical lines separated by 1 nautical mile. (b) Spring and (c) autumn square root of the NASC of DBTs by acoustic sample in relation to bottom depth. The whiskers extend the entire range of the data distribution. The width of the boxes is proportional to the square root of the number of observations. Note that when the notches of two boxplots do not overlap there is strong evidence that the two medians differ (Chambers et al., 1983).
Surface salinity and temperature were mainly between 34 and 36.2 psu (mean 35.6) and 14°C and 17°C (mean 15.4°C), respectively. Both variables increased towards the south and offshore and were on average 0.5 psu and 0.35°C higher during autumn. Fluorescence (proportional to chlorophyll a concentration) had high intra- and intersurvey variability, presenting the highest coefficient of variation of the three variables: 72% vs. 6% and 3% of temperature and salinity, respectively. The average value was 0.23 mV, and the first and third quartiles were 0.14 and 0.25 mV, respectively, indicating a right-skewed distribution. There were no signs of seasonality, but fluorescence showed an upward trend towards the north and towards the coast, i.e. inverse to that of temperature and salinity.
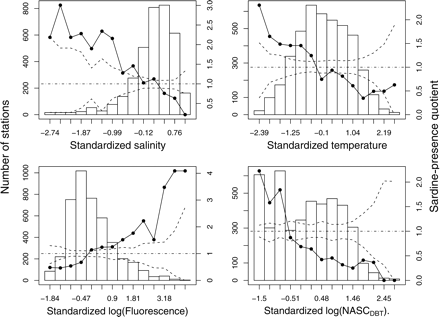
Quotient analysis suggests that sardine off western Portugal were not randomly distributed with respect to the environmental variables. Sardine were more abundant in colder, less saline, more productive waters with few or no DBTs (Figure 5). Quotients calculated for each season independently followed the same general pattern, suggesting that sardine responded to the environment in a similar way in both autumn and spring (not shown).
Quotient plots (continous lines) of sardine presence against standardized environmental variables. Dashed lines limit the confidence envelope for quotients assuming that the observations were independent. The histograms represent the standardized values of the explanatory variables for all surveys combined.
PCA showed the structure in the four oceanographic variables, with 85% of the variability being captured within the first three principal components (PCs; not shown). The first component, capturing 46% of the data variability, was positively correlated equally to salinity and temperature, and negatively correlated to fluorescence. The second PC, which captured 21% of the data variability, was highly correlated to DBT NASC and poorly correlated to the oceanographic variables, suggesting some degree of independence between DBTs and the remaining variables.
For both sardine presence and acoustic density, the full GAMs had four main effects (corresponding to the four environmental variables): one three-dimensional interaction with salinity, temperature, and fluorescence, suggested by the first PC, and two two-dimensional interactions of fluorescence and DBTs and fluorescence and temperature, suggested by the second and the third PC, respectively. This full model was fitted to all surveys except autumn 2000 (no salinity data) and spring 2006, which was kept for model validation. For acoustic density, using either all data or just the positive samples, GAMs did not reveal any significant relationships, suggesting that the environment, as represented here, was not the driver of the species density distribution.
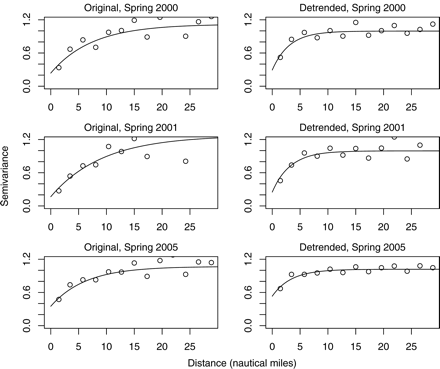
For sardine presence/absence, the best model was much simpler than the full model (Table 1). The additive terms of the best model closely resembled the structure of the first and second PC, i.e. an interaction term for salinity, temperature, and fluorescence, and a single term for DBT NASC. Despite the low complexity, the model appeared to capture well the relationships between the environment and sardine distribution. The mean AUC value calculated for the surveys used in model building was 0.85, suggesting that the model was successful in capturing the global trends. Additionally, the minimum and maximum AUC of 0.81 and 0.94 calculated for spring 2000 and 2001 data, respectively, attest that the relationships observed were temporally consistent and that the model was able to predict sardine distribution reliably across the surveys. The latter is further emphasized by the relatively good predictions obtained for spring 2006 data, for which an AUC value of 0.81 was obtained. Spatial correlation was observed in the residuals of the best presence/absence model, but the ranges of semivariograms were fairly reduced (almost reaching the resolution of our oceanographic data), and the nugget effect increased relative to the semivariograms of sardine presence (Figure 6). These results confirm that the model was able to capture the environmental pattern that drives the distribution of sardine at mesoscales.
Summary of the sardine distribution models.
| Model . | d.f. . | GCV score . | AIC . | AUC1(CV) . | AUC2 . |
|---|---|---|---|---|---|
| t + s + f + d +(f,d) +(t,f) +(s,t,f) | 51.7 | 0.831 | 2513 | 0.85 (5.9) | 0.77 |
| d + (s,t,f) | 35.7 | 0.806 | 2436 | 0.85 (6.1) | 0.81 |
| d + (t + f) | 36.4 | 0.806 | 2440 | 0.85 (6.0) | 0.80 |
| Model . | d.f. . | GCV score . | AIC . | AUC1(CV) . | AUC2 . |
|---|---|---|---|---|---|
| t + s + f + d +(f,d) +(t,f) +(s,t,f) | 51.7 | 0.831 | 2513 | 0.85 (5.9) | 0.77 |
| d + (s,t,f) | 35.7 | 0.806 | 2436 | 0.85 (6.1) | 0.81 |
| d + (t + f) | 36.4 | 0.806 | 2440 | 0.85 (6.0) | 0.80 |
“t”, “s”, “f,” and “d” stand for standardized temperature, salinity, log(fluorescence), and log(NASC) of DBTs, respectively. All terms, either single or multivariate, are smooth terms using the default penalized thin-plate regression splines available in the mgcv package. AUC1 is the average of the AUCs calculated for each survey use in model building. CV (%) refers to the coefficient of variation of the AUC. AUC2 is the AUC value calculated for the spring 2006 survey, which was not used to build the model. The best model is emboldened and below it is a suboptimal model built without salinity to map the potential habitat of sardine for the autumn 2000 survey for which no salinity readings were available. The total number of observations was 3718 (3147 in the best model).
Standardized semivariograms of sardine-presence data in the spring surveys paired with the GAM deviance residuals from the best model.
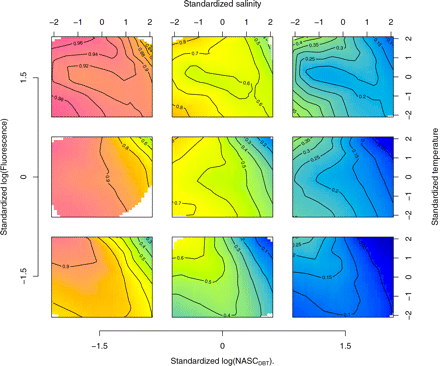
Analysis of the model output (Figure 7) shows that sardine response to the environment is more complex than that allowed by the interpretation of single-variable preferences evaluated by quotient analysis (Figure 5). The water masses more likely for sardine presence were those with low backscatter of DBTs and high chlorophyll a concentrations in association with either high or low temperatures and low salinities (characteristic of freshwater enrichment), or with low temperatures and average salinities (indicative of coastal upwelled waters). On the opposite side, the waters less likely to contain sardine were oligotrophic oceanic waters characterized by high salinities, high temperatures, and low chlorophyll a concentrations, and in general waters with average to high backscatter of DBTs.
Probability surfaces of sardine presence for pairwise combinations of standardized temperature and salinity (contour plots) conditioned on three levels (−1.5, 0 and 1.5) of the standardized log(NASC) of DBTs (external x-axis) and log(Fluorescence) (external y-axis).
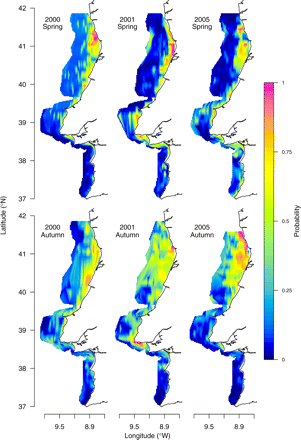
Maps of SPH were constructed for individual surveys by spatially interpolating the fitted values of the habitat model (Figure 8). The pattern of space occupation by sardine described above (Figure 2) was well captured by the environmental GAMs and appears consistent across years. In the north during spring, the fitted probability of sardine presence rapidly dropped from its coastal maximum to almost zero beyond the 75-m isobath. This contrasted with the smoother autumn profile that rendered an overall higher probability of sardine presence across the whole northern region. In the central region, the average fitted probability of sardine encounter in spring was higher than in autumn, mostly because of the greater probabilities obtained in waters shallower than 100 m. In the southern region, the model showed a higher fitted probability during spring.
Potential habitat of sardine for spring and autumn of 2000, 2001, and 2005.
Discussion
In this study, a series of acoustic surveys dedicated to estimating sardine abundance off western Portugal were used to obtain detailed information on the hydrological and biological conditions, to improve the understanding of the processes that regulate sardine mesoscale distribution off western Iberia. Although three of the four environmental variables were measured near the surface, so being prone to short-term variability and disassociation with the water-column properties, consistent relationships between the environmental variables and sardine presence were found, providing evidence that sardine distribution off Portugal is driven by the search for a particular set of environmental conditions.
The range of values of near-surface temperature and salinity observed during the series of surveys were in the mid-range of physiological tolerance limits of sardine, inferred from their wide-scale distribution: sardine can be found across the northeastern Atlantic margin and Mediterranean Sea within the salinity range 30–38 psu (Petitgas et al., 2006; Giannoulaki et al., 2005) and with temperatures ranging between 8°C and 24°C (Haynes and Nichols, 1994; Giannoulaki et al., 2005; Coombs et al., 2006; Stratoudakis et al., 2007). In the area of the study, sardine were more abundant in the lower range of the salinity distribution and rarely beyond 35.8 psu. A similar situation was observed for temperature, with sardine being predominantly found at lower temperatures, typically in waters <16°C. This situation contrasts with the results of Giannoulaki et al. (2005) in the eastern Mediterranean, where higher temperatures were more likely to contain sardine. In the Bay of Biscay, Petitgas et al. (2006) found no preferences in relation to hydrographic conditions, although the contrasts for temperature and salinity were higher than those recorded here. It is therefore unlikely that the temperature and salinity preferences observed are the result of direct physiological benefits or constraint, and are more likely indicative of correlation to other variables that affect adult sardine directly, such as food availability.
Quotient analysis of log-transformed fluorescence suggested that the probability of finding sardine increased with increasing values of chlorophyll a in all surveys. The same pattern has been reported for other SPF, resulting most of the time in a coherent spatial distribution between fish and primary production areas (Tameishi et al., 1996; Robinson, 2004; Twatwa et al., 2005). This is not unexpected, because phytoplankton dominates sardine diet off western Iberia and provides a significant portion of the total carbon intake (Bode et al., 2004; Garrido et al., 2008). Moreover, sardine preference for high chlorophyll a water in both autumn and spring is an indication of the importance of food consumption throughout the protracted spawning season (Zwolinski et al., 2001), an essential process in the maintenance of the reproductive effort that would otherwise be compromised in the absence of adequate food supply (Ganias et al., 2003; Twatwa et al., 2005; Somarakis et al., 2006).
The nature of DBTs is unknown, but given the strength of the echoes at 38 kHz, it is unlikely that the main scatterers are fluid-type zooplankton. Acoustic density calculations for copepods averaging 390 µm (used here as an approximation of sardine prey) show that the lower detection threshold of −60 dB could only be achieved by a density of 4 × 10⁵ ind. dm−3 (target strength obtained from Mair et al., 2005), a density several orders of magnitude higher than the values reported from plankton samples off Portugal (Villa et al., 1997; Queiroga et al., 2005). There was often clear separation between the spatial locations dominated by sardine and those dominated by DBTs. Although it is possible that the habitat of the DBTs is different from that of sardine, this view was not supported by the oceanographic variables we tested because no correlation was found between them and the DBTs. It is then possible that sardine avoided DBTs. Plankton samples from DBT regions collected in later surveys showed signs of a brown-coloured gel-like biofilm clogging the 200 µm mesh of a bongo net that is suspected to be constituted by transparent exopolymer particles (TEPs; Passow, 2002). The presence of TEPs and, in particular, the presence of gas bubbles generated by microbial activity entrapped in the viscous TEP matrix could explain the large homogeneous backscattering layers observed in the echograms. Avoidance of TEP-rich areas by sardine, a filter-feeder well adapted to capture small zoo- and phytoplankton (Garrido et al., 2007), could be explained by the presence of sticky filaments that might interfere in the process of feeding, as has been shown with zooplankton (Mari and Rassoulzadegan, 2004) and that are suspected to be the cause of mass mortalities in fish (Jenkinson, 1989).
The patterns described by the habitat model based exclusively on environmental variables without fixed spatial references (as opposed to bottom depth, distance from the shelf edge, etc.) were able to resolve a major part of the original mesoscale spatial structure of sardine distribution. Furthermore, the model predicted rather well the presence of sardine in the 2006 spring survey which was not used in model building. The fact that spatial correlation was still visible on the model's residuals and the inability to resolve acoustic density reveal two weaknesses of the data: the low resolution of the oceanographic variables in relation to the scales of space occupation by fish schools, and the potential lack of other relevant variables such as the density of zooplankton. However, it should be noted that schooling behaviour also plays an important role at smaller levels of organization (Fréon and Misund, 1999; Mackinson et al., 1999; Zwolinski et al., 2006), adding noise and unpredictability to the field of acoustic density (Petitgas, 1993; Zwolinski et al., 2009).
The fitted values of the probability of sardine presence described adequately the seasonal pattern of sardine distribution, showing that the autumn concentration of sardine in the north and the spring contraction and concomitant southward extension were promoted by changes in SPH. We propose that this pattern of cyclic compression and expansion of a suitable habitat might be driven by a complex interaction of the seasonal cycles of river run-off, mesoscale oceanic circulation, direction and intensity of the wind, and thermal stratification (Peliz and Fiúza, 1999; Álvarez-Salgado et al., 2003; Peliz et al., 2005). Our findings of a reduced SPH off the southwestern coast and extensive potential habitat off northern Iberia in autumn are consistent with the annual climatological chlorophyll minimum to the south of Lisbon, a phenomenon simultaneous with the progressive increase in extension of the chlorophyll-rich waters over the northern shelf (Peliz and Fiúza, 1999). The low productivity in the south in autumn has been linked to the settlement of an oligotrophic, warm, more-saline water mass of oceanic origin over the slope and shelf, where the absence of upwelling-favourable winds or river run-off preclude the proliferation of primary producers. In contrast, the wider continental shelf in the north is under the influence of the nutrient-rich WIBP that supports extensive primary production throughout autumn and winter (Peliz and Fiúza, 1999; Ribeiro et al., 2005) and provides suitable conditions not only for adult sardine but also for the retention and feeding of sardine larvae (Chícharo et al., 2003; Santos et al., 2004). During winter, a poleward current is recurrently observed on the western coast of the Iberian Peninsula. This current, the Iberian Poleward Current (IPC; Peliz et al., 2005), transports warm oligotrophic water of subtropical origin and typically develops as a tongue of lighter water propagating along the outer continental shelf and slope North of 40°N. It has been reported that the convergent zone created by the IPC plays an important role on shelf retention of biological material (Santos et al., 2004; Ribeiro et al., 2005), and it may even confine the spring bloom to coastal waters (Peliz and Fiúza, 1999; Álvarez-Salgado et al., 2003). The results obtained here suggest that the spring reduction in SPH in the North might have been promoted by the IPC front being located over the shelf and closer to the coast in spring than in autumn, restricting sardine suitable waters close to the coast, as shown by Álvarez-Salgado et al., (2003).
Acknowledgements
JZ was initially funded by the Portuguese Ministry of Science through a PhD grant and later by the “Programa Nacional de Amostragem Biológica” PNAB-DCR. Echogram scrutiny for sardine echo-identification was performed by Vítor Marques at IPIMAR. We are grateful to “Programa PELAGICOS” funded by the Portuguese Ministry of Science and PNAB-DCR for funding IPIMAR's acoustic surveys, and to all the scientists and technicians who participated in the surveys. The manuscript greatly benefitted from the comments of two anonymous reviewers and from the English revision of Kyle Byers and the editors.


