-
PDF
- Split View
-
Views
-
Cite
Cite
Gordon H. Kruse, Jie Zheng, Diana L. Stram, Recovery of the Bristol Bay stock of red king crabs under a rebuilding plan, ICES Journal of Marine Science, Volume 67, Issue 9, December 2010, Pages 1866–1874, https://doi.org/10.1093/icesjms/fsq136
Close - Share Icon Share
Abstract
After peak landings in 1980, the red king crab fishery in Bristol Bay (Alaska) was closed in 1983 because of stock collapse. In the following decade, small commercial harvests and additional fishery closures (1994 and 1995) associated with depressed stock status prompted a reappraisal of the management strategy. A length-based population model was developed, which provided an improved stock assessment for setting annual catch quota. A management strategy evaluation revealed that a harvest strategy, which included a stair-stepped harvest rate of 10–15% of mature males and a threshold for effective spawning biomass below which no fishing is permitted, provides for relatively high long-term yield, greater stability in yield, fewer fishery closures, and higher effective spawning biomass. This strategy was adopted in 1996, in addition to crab bycatch caps and closed areas, to protect sensitive crab habitats implemented in the management of the groundfish trawl fishery. Since then, abundance of legal-sized males increased by 58%, that of mature males doubled, and mature female abundance and effective spawning biomass tripled through 2008. The stock has been considered rebuilt since 2003. Subsequently, a sharp reduction in fishing capacity improved profitability of the fishery, after implementation of an individual fishing quota programme in 2005.Kruse, G. H., Zheng, J., and Stram, D. L. 2010. Recovery of the Bristol Bay stock of red king crabs under a rebuilding plan. – ICES Journal of Marine Science, 67: 1866–1874.
Introduction
This review examines the factors contributing to the successful rebuilding of the Bristol Bay stock of red king crab (Paralithodes camtschaticus) from a depleted status in the mid-1990s. We describe the history of the fishery and of the management framework, the elements of the rebuilding plan implemented in 1996, and the subsequent response of the stock and fishery.
Red king crabs are large, long-lived anomurans inhabiting intertidal waters to depths >200 m of the North Pacific Ocean from British Columbia, Canada, north to the Bering Sea, and south to Hokkaido, Japan. They were introduced as a non-indigenous species into the Barents Sea (Northeast Atlantic) in the 1960s and 1970s (Orlov and Ivanov, 1978). Red king crabs mature at 5–12 years old, depending on stock and temperature (Stevens, 1990) and may live >20 years (Matsuura and Takeshita, 1990), with males and females attaining a maximum size of 227 and 195 mm carapace length (CL), respectively (Powell and Nickerson, 1965). Mating happens in spring, immediately following the female annual moult. Embryos are carried by females for ∼11 months. The early life history comprises four pelagic zoeal stages and one semi-benthic glaucothoe stage. Juveniles moult multiple times per year until age 3 or 4, whereafter moulting continues annually in females for life and in males until maturity; thereafter, the moulting frequency declines.
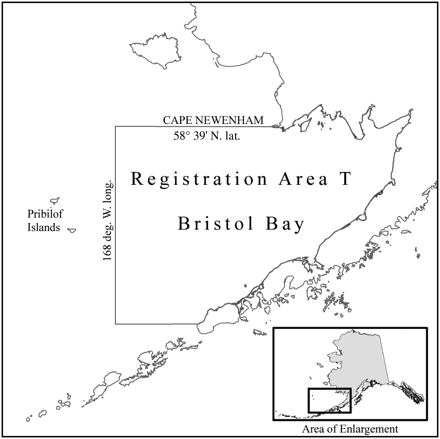
Red king crabs have been exploited by commercial fisheries in Alaska since the 1920s (Gray et al., 1965). As with most crab fisheries in the region, king crabs have experienced boom and bust fisheries. Contributing to this variability are wide fluctuations in recruitment, ranging more than 3 orders of magnitude (Zheng and Kruse, 2000): extended periods of weak year classes are punctuated by infrequent large year classes. Whereas strong recruitment can cause rapid increases in stock size, occasional periods of high unexplained mortality (perhaps die-offs from disease, unobserved bycatch, or predation) or high exploitation rates have resulted in sharp declines, often resulting in multiyear fishery closures. Some stocks in the Gulf of Alaska, such as red king crabs off Kodiak Island, have failed to recover after >25 years of fishery closures (Bechtol and Kruse, 2009a). In contrast, red king crabs in Bristol Bay in the southeastern Bering Sea (Figure 1) have recovered and have exceeded the rebuilding target levels since 2003 (Vining and Zheng, 2004).
Map of the Bristol Bay management area (T) in the eastern Bering Sea off the coast of Alaska.
Fishery and management history
After Japanese vessels pioneered the fishery in the 1920s, the red king crab stock in Bristol Bay has supported a valuable commercial fishery for >75 years (Gray et al., 1965). The fishery in the early years mostly utilized tanglenets, with a small portion of the catch being taken by trawls and pots (traps). Japanese fishing took place through 1974, with a hiatus during 1940–1952. USSR vessels operated in the area during 1959–1971 using tanglenets only. Domestic (US) trawlers began to fish in 1947, but catch and effort declined in the 1950s. In the US fishery, tanglenets were banned in 1955 and trawling for crabs was banned in 1960 (Gray et al., 1965). The current legal gear is the crab pot; a large (198–244 cm2, 70–99 cm high) steel-framed trap covered with 90–200 mm stretch mesh (High and Worlund, 1979). Pots are often baited with chopped Pacific herring (Clupea harengus) and whole Pacific cod (Gadus macrocephalus).
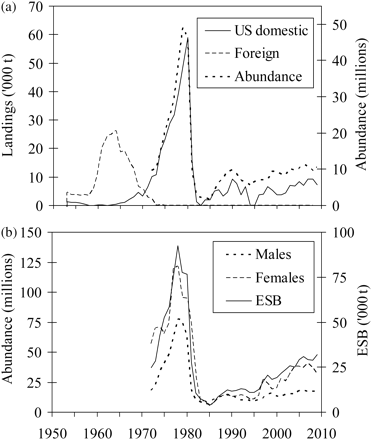
Commercial catch statistics have been maintained since 1953 (Figure 2a). After abrupt, large declines in landings of Kodiak red king crabs in the mid- to the late 1960s, the domestic fishery expanded into Bristol Bay. The fishery peaked at 59 000 t in 1980, worth US$115 million ex-vessel value. Landings plummeted in the early 1980s and the fishery was closed in 1983, because of conservation concerns. Since then, annual landings have been <10 000 t.
(a) Reported commercial landings of red king crabs from Bristol Bay by foreign (Japanese and Russian combined) and US domestic fleets over 1953–2008 and estimated legal-sized male abundance; and (b) mature male and female abundance and effective spawning biomass (ESB).
For many years, the management has been based on the size–sex–season regulations (3-S management). Only males of ≥165 mm carapace width, equivalent to 135 mm CL, may be legally landed, whereas females and small males must be returned to the sea. The rationale was to protect females from exploitation and to maximize their reproduction. Male legal size was set approximately one growth increment above size-at-maturity to allow males to mate at least once before becoming vulnerable to fishing (Donaldson and Donaldson, 1992). Fishing seasons were set to avoid the moulting and mating period in spring, to maximize meat yield, and to coincide timing with the winter-holiday market demand. Few additional regulations, other than those associated with 3-S management, were introduced before the 1970s, when target harvest rates of legal-sized males were 20–60%, depending on population size, prerecruit abundance, and post-recruit abundance. In 1990, this strategy was revised to a fixed 20% harvest rate applied to mature males, if female abundance exceeded a threshold of 8.4 million crabs, below which the fishery would not open for the year (Schmidt and Pengilly, 1990).
The State of Alaska has led the management of all crab fisheries throughout the US exclusive economic zone. Crab fishery management in the Gulf of Alaska is fully delegated to the state, in the absence of a federal fishery management plan (FMP). For the Bering Sea and the Aleutian Islands, a cooperative state-federal FMP (NPFMC, 2008a) delegates many management activities (e.g. observer and reporting requirements and bycatch limits in crab fisheries) to the state and reserves some contentious management measures (e.g. limited access, overfishing definitions, and legal gear) as federal actions only. For other management measures (e.g. size limits, sex restrictions, fishing seasons, and harvest levels), the state has authority to establish regulations if specific provisions in the crab FMP are followed. State regulations are adopted by the Alaska Board of Fisheries and implemented by the Alaska Department of Fish and Game (ADF&G). Crab bycatch in groundfish fisheries is regulated under a federal groundfish FMP for the Bering Sea and Aleutian Islands. Federal crab and groundfish regulations are recommended by the North Pacific Fishery Management Council (NPFMC) for approval by the Secretary of Commerce (National Oceanic and Atmospheric Administration) and implemented by the National Marine Fisheries Service (NMFS).
Stock assessment and rebuilding analyses
Stock assessment
Trawl surveys have been conducted in the eastern Bering Sea by NMFS since 1968. Formerly, red king crab abundance was estimated annually by sex and size using area-swept methods (Alverson and Pereyra, 1969), and a guideline harvest range was prescribed to represent an acceptable catch range, based on the standard errors of the mean legal-sized male abundance estimate and the harvest rate. In-season cpue (catch per unit effort) was used as another gauge on crab abundance to manage between the lower and upper limits of the guideline harvest range. By the late 1980s, two major difficulties with this approach emerged. First, annual population estimates were sometimes associated with large measurement errors, which were mainly caused by occasional tows of exceptionally large catches. The manner in which such catches were incorporated resulted in large differences in apparent abundance. Second, in-season cpue ceased to be a useful indicator of abundance, because the length of the fishing season declined from 3 months in 1981 to generally <7 d after 1990, in response to the increase in the number of vessels from 177 to a maximum of 302 over this period (Bowers et al., 2008).
In the mid-1990s, a length-based assessment was developed based on a population dynamics model incorporating growth, mortality, and recruitment using data from surveys, landings, dockside samples, and on-board observers (Zheng et al., 1995a, b). This was an important breakthrough, because traditional age-structured models are not applicable, stemming from our inability to age the crabs. The length-based assessment helped to address issues of survey measurement errors and cpue inconsistencies, produced consistent stock estimates, and provided a means to forecast stock status under different exploitation scenarios.
Results indicated that abundance of mature males and females, as well as effective spawning biomass, increased rapidly from 1972 to 1978, then declined sharply in the early 1980s, increased slightly during 1986–1993, but dropped again in 1994–1995 (Figure 2b). The low estimates of all stock components at that point in time resulted in major conservation concerns. Particularly disconcerting were the extremely low estimates of small crabs of both sexes. To protect the remaining spawning biomass, the fishery was closed in 1994 and 1995, causing severe economic hardship for vessel owners and operators, crew, processors, and even coastal communities in general. Some communities depend heavily on the economic activity associated with the red king crab fishery, because landing taxes constitute revenues to support schools and other local services.
On the resource-conservation side, the conviction grew that the harvest strategy applied had failed to sustain the fishery and that more conservative strategies would be appropriate. Concerns were raised that life-history characteristics rendered the species vulnerable to stock depletion. Specifically, the fraction of all mature males that participate annually in mating, handling mortality of discarded females and undersized males (assumed to be 20%), ghost fishing of lost crab pots, and genetic selection by fishing as a potential cause of evolution were being questioned (Kruse, 1993). Stock-conservation concerns, coupled with severe adverse economic consequences of reduced catches and fisheries closures, crystallized broad support among scientists, managers, and most of the industry for efforts to revise king crab fishery management.
Management strategy evaluation
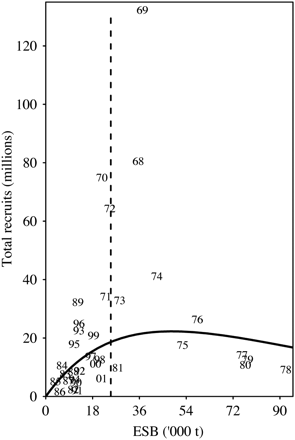
Simulation analyses were conducted to evaluate effects of alternative harvest strategies under differing assumptions about population dynamics, recruitment, environment, and other uncertainties affecting the stock (Zheng et al., 1997a, b). This approach has since become known as a management strategy evaluation (Smith et al., 1999). In overview, the management strategy evaluation consisted of a population dynamics model, which keeps track of increases caused by recruitment and growth and decreases caused by natural mortality, catches, and handling mortality of discarded females and sublegal males. Recruitment was modelled with an autocorrelated Ricker curve (Figure 3) fitted to the estimates of recruitment and effective spawning biomass (Zheng et al., 1995a; Zheng and Kruse, 2003). This relationship was selected because it captured both the apparent density-dependent relationship (low, high, and intermediate recruitment from small, medium, and large spawning stocks, respectively), as well as autocorrelated time-trend in residuals (e.g. recruitment was high in the late 1960s and the early 1970s, declined to low levels in the early 1980s, and increased slightly in the 1990s). A rebuilding target of 25 000 t was selected to represent a spawning biomass level above which the probability of strong recruitment is enhanced (Figure 3).
Length-based model estimates of total recruits plotted against effective spawning biomass (ESB) and fitted autocorrelated Ricker's curve (solid line). Labels refer to brood year (year of mating). Vertical dashed line represents the rebuilding target (25 000 t).
Zheng et al. (1997b) evaluated the long-term response of the stock to alternative harvest rates and fishery thresholds (stock size below which the fishery would remain closed). To identify an optimum long-term harvest strategy, they optimized an objective function that balanced the trade-off between maximum yield and minimum variance in yield. This objective function mimicked the major features of the Alaska Board of Fisheries policy for red king crab and Tanner crab (Chionoecetes bairdi) management (ADF&G, 1994). In addition, statistics were collected on mean yield, variation in yield, percentage of years of fishery closures when the stock fell below the threshold, and variation in effective spawning biomass. The rebuilding analysis by Zheng et al. (1997a) was quite similar, except that a short-term (50-year) planning horizon was evaluated. In this case, the statistics collected addressed effective spawning biomass, catch, probability of fishery closure, and probability of rebuilding.
Stock-rebuilding strategy
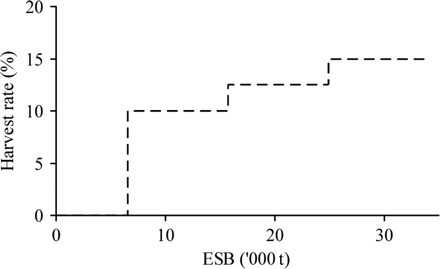
The goal of rebuilding the Bristol Bay stock of red king crabs involved two tactics—a state rebuilding plan targeting the directed crab fishery and federal bycatch controls placed on the groundfish fishery. A key feature of the rebuilding plan is a stair-stepped harvest strategy (Figure 4) that describes both the long-term optimum harvest rate (15% of mature males) when effective spawning biomass exceeds the rebuilding target (Zheng et al., 1997b) and a reduction to 10% when biomass is below the target, intended to facilitate stock rebuilding (Zheng et al., 1997a). An intermediate 12.5% step in the harvest-rate control rule was added in 2003, at the request of the fishing industry, to lessen catch variability associated with small variations in biomass near the previous 10–15% dividing line. Because only the legal-sized mature males may be retained, the harvest is capped at 50% of legal-sized male abundance to avoid truncation of the size distribution. The rebuilding strategy also comprises three thresholds, below which the fishery would remain closed for the year: a minimum effective spawning biomass of 6600 t; retention of the existing threshold of 8.4 million mature females (exceeding mean size-at-maturity of 89 mm CL); and a minimum value for the advised total allowable catch (TAC) of 1814 t (being recommended by managers as the minimum level that would not be overharvested during 3 d of fishing, given expected levels of fishing effort). Compared with the harvest strategy existing at the time, the rebuilding strategy reduced the probability of future fishery closures from 8 to 3% and increased the probability of stock rebuilding over the 50-year time-frame to nearly 100% (compared with 78% for the status quo strategy). Whereas the projected annual catches through the tenth year of rebuilding were slightly higher (900 t) for the status quo strategy, the rebuilding strategy yielded 3200 t more annually thereafter, largely because of improved recruitment associated with density-dependent stock effects (Zheng et al., 1997a). Moreover, the new long-term harvest rate of 15% was projected to provide greater stability in yield, fewer fishery closures, and higher effective spawning biomass. Based on the evaluation, the rebuilding strategy was approved and implemented by the state in 1996.
Mature male harvest-rate strategy resulting from the management strategy evaluation. The 15% rate resulted from the analysis of optimum long-term strategy when the stock is rebuilt (effective spawning biomass, ESB ≥25 000 t), whereas the lower stair steps represent reduced harvest rates that increased the probability of stock rebuilding and reduced the probability of fishery closures, simultaneously maintaining a viable fishery over a 50-year time-frame.
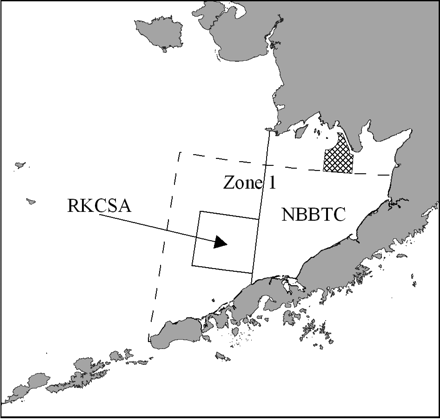
The stock declines in the mid-1990s raised concerns not only about the directed crab fisheries, but also about the effects of groundfish trawl fisheries on crab stocks and their habitats. Passage of what is now called the Magnuson–Stevens Fishery Conservation and Management Act (MSFCMA) in 1976 created incentives to “Americanize” the trawl fishery in the Bering Sea, which had been prosecuted almost entirely by foreign (largely Japanese and USSR) fleets. In 1982, the United States adopted a groundfish FMP for the Bering Sea and the Aleutian Islands, which dictated the terms under which foreign vessels could fish within the US exclusive economic zone. During the 1980s, a joint-venture fishery was established whereby US trawlers caught and delivered groundfish to foreign mother ships for processing. The Americanization of the groundfish trawl fishery was complete by 1990, when US fishing vessels and processors handled all harvesting and processing. Some crab protection measures had been put in place at the time of the foreign fishery (Witherell and Pautzke, 1997). For instance, foreign trawling was banned in a large area (pot sanctuary) along the north side of the Alaska Peninsula to protect crabs and their habitats (the area was opened again to domestic fishers in 1983). Moreover, the Japanese fleet implemented an individual-vessel accounting system to achieve a 25% reduction in crab bycatch over a 5-year period, as required by an FMP amendment adopted by the NPFMC in 1983 (this did not apply to domestic vessels). At the time of the closure of the Bristol Bay red king crab fishery in 1994, the domestic fleet was banned from fishing in a portion of Bristol Bay. It also operated under a prohibited-species catch limit of 200 000 red king crabs, which, if attained, triggered the closure of bycatch limitation zone 1 (Figure 5).
Map of eastern Bering Sea illustrating the RKCSA and the NBBTC areas, both of which are closed to trawling, except for the small cross-hatched area of the NBBTC, which is open to trawling during 1 April to 15 June in years when the red king crab stock is large enough to support a directed crab fishery. Also illustrated is zone 1 (delineated by dashed line), which closes to groundfish trawling if the estimated crab bycatch exceeds the prohibited-species catch limit.
Three new bycatch controls on the groundfish fishery were adopted in 1995 (Figure 5). First, a new area closure was instituted, called the Red King Crab Savings Area (RKCSA: 13 737 km2), which had been a prime fishing ground for flatfish, but also contained high densities of adult male red king crabs. Second, a Nearshore Bristol Bay Trawl Closure Area (NBBTCA: 65 252 km2) was established to protect nursery areas for juvenile crabs, with an exemption for a small subarea that opens 1 April to 15 June, to provide access to yellowfin sole (Limanda aspera) resources in years when a crab fishery is allowed. Implementation of these closed areas was based largely on a geographic-information-systems analysis of crab bycatch and temporal distribution of target groundfish and crab species (Ackley and Witherell, 1999). Finally, the prohibited-species catch limits were revised in a stair-step fashion to 35 000, 100 000, and 200 000 crabs, corresponding to the levels of effective spawning biomass used in the stair-step harvest strategy for the directed crab fishery (Figure 4). These bycatch levels resulted from negotiations among crab and groundfish industry representatives in terms of what could be achieved technically and economically within biologically acceptable limits (≤1% of assessed crab abundance) advised by fishery scientists.
Other recent relevant amendments to the FMP
Although the rebuilding plan, crab bycatch controls, and area closures were intended to improve the crab stock and habitats, the heavily overcapitalized crab fleet continued to race to catch a small quota in fisheries lasting just a few days in the late 1990s and the early 2000s. This caused management problems, low economic returns, and high levels of loss of life and injury. Some fishers also claimed that this fast-paced style of fishery was associated with higher bycatch mortality than necessary, because pots could not be “soaked” long enough to allow undersized males and females to exit through escape vents before pot retrieval and because fishers did not have sufficient time to locate fishing areas dominated by legal-sized males. Although a moratorium on new entrants to the fishery in 1996 and a licence limitation programme adopted in 1997 curbed the growth of the fishing fleet, the fishery remained overcapitalized. To address these concerns, a crab rationalization programme was implemented in 2005, where resources associated with nine crab fisheries in the Bering Sea and Aleutian Islands, including Bristol Bay red king crabs, were allocated among harvesters, processors, and coastal communities (Fina, 2005). This approach was novel among rights-based programmes worldwide, because it also established individual transferable processing quotas in addition to individual fishing quotas (Matulich, 2008). The inclusion of processors in the quota system was intended to halt further consolidation of crab processing plants in the region, which had already declined from 25 in 1991 to 18 in 2000. Each qualifying harvester (processor) was allocated a quota share based on its harvesting (processing) history. These shares were then multiplied by the annual TAC to determine the individual fishing (processing) quota for the year. Individual catcher-vessel quotas were split into Class A shares (90%), which had to be delivered to a specific processor in a designated geographic region, and Class B shares (remaining 10%), which a harvester could deliver to any processor. An arbitration programme was created to settle price disputes associated with the dual-share allocations. This complex rationalization programme incorporated many other provisions, such as protections for vessel captains, by allocating 3% of the TAC as Class C shares to eligible captains. Also novel to this programme were aspects designed to protect and enhance the economies of remote communities: a regionalization feature required a certain portion of the catch to be processed in designated regions and a community development programme allocated 10% of the harvest allocations to 65 rural western Alaska communities. Finally, provisions were included to allow harvesters to form voluntary cooperatives to improve economic efficiency further (Fina, 2005).
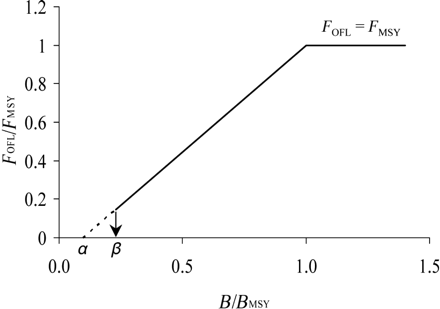
Under a previous crab FMP approved in 1989, the biomass yielding maximum sustained yield (BMSY) had been estimated as the average mature (male and female combined) biomass over a 15-year period (1983–1997). MSY was calculated as the product of instantaneous natural mortality (M) and BMSY, a minimum stock-size threshold was set at 0.5 BMSY, and the MSY control rule for the fishing mortality defining the overfishing level (FOFL) was set equal to M (where M = 0.2 for red king crabs). Although the depressed Bristol Bay stock was not designated as “overfished” in 1994–1995 under this federal definition, the current crab FMP was amended in 2008 to include overfishing definitions that were more conservative (NPFMC, 2008b). Under the new overfishing definition, BMSY refers to the mature male biomass only, and, for stocks above BMSY, FOFL is based on (a proxy of) FMSY, using a five-tier system based on the level of information available. The Bristol Bay red king crab is a “tier 3” stock, where the fishing mortality rate that reduces spawning-stock biomass to 35% of the unfished level (F35% = 0.36) is used as FMSY proxy, B35% = 35 317 t is a Bmsy proxy, and M = 0.18. The control rule prescribes a linear decline in F, as biomass declines below B35%, to β, below which no directed fishing is allowed (Figure 6).
Overfishing control rule for tier 1–4 crab stocks in the Bering Sea and Aleutian Islands under crab FMP Amendment 24. Directed fishing mortality is set to zero below β (=0.25). If the estimates of BMSY or FMSY are not available, proxies are used.
Responses to rebuilding plan
Stock response
Indices of stock health have improved substantially since the implementation of the rebuilding plan and the bycatch controls (Figure 2): abundance of prerecruit (110–134 mm CL), mature (>119 mm CL), and legal-sized males (≥135 mm CL) increased by 123, 79, and 58%, respectively, whereas the abundance of mature (>89 mm CL) females and effective spawning biomass increased by 197 and 192%, respectively. Effective spawning biomass has exceeded the rebuilding target level of 25 000 t since 2003. Mean recruitment of males and females increased by 48 and 134%, respectively, over the 14 years of implementation (1996–2009), compared with the preceding 10 years (1986–1995), but the increase was only significant for females (t-tests for unequal sample size, unequal variance: p < 0.01).
Fishery response
After 2 years of fishery closure, commercial fishery landings increased on average by 12% annually from 3813 t in 1996 to 9216 t in 2008. Mean landings for the 13 years after implementation of the rebuilding plan (6109 t) were significantly (Mann–Whitney U-test: p < 0.05) higher than those for the 13 years before implementation (3835 t). Landings became slightly more stable, mainly by elimination of fishery closures that happened three times in the 13 years before implementation: annual landings ranged from 0 to 9236 t and 3699 to 9238 t during 1983–1995 and 1996–2008, respectively. The mean ex-vessel value increased nominally from US$35 million over 1983–1995 to US$ 54 million over 1996–2008. Because of reduced harvest rates, the mean size of landed red king crab increased significantly (t-test: p < 0.05) from 2.72 to 2.96 kg crab−1, respectively. A nominal increase in the ex-vessel price (US$1.83 kg−1 to US$2.04 kg−1) was not significant.
The crab rationalization programme resulted in declines in the number of harvesters in the Bristol Bay red king crab fishery. In all, 251 vessels participated in 2004, the last year of the open-access fishery, compared with 89 vessels in 2005 (NPFMC, 2008c). This large reduction in fishing capacity fostered increased average gross revenue per vessel, from US$262 000 in 2004 to US$781 000 in 2005. During 2001–2004, 17–20 plants processed red king crabs from the Bristol Bay fishery; under the rationalization programme, 19 processing plants received allocations and consolidation resulted in a constant participation of 12 plants during the 2005–2008 fishing seasons (NPFMC, 2008c). Finally, the race to fish was diminished, as the length of the fishing season increased from 3–5 d per year during 1996–2004 to 93 d thereafter (Bowers et al., 2008).
Discussion
Clearly, conservation benefits accrued to the Bristol Bay stock of red king crabs after the implementation of the rebuilding plan with the new bycatch controls and area closures. All measures of stock health increased. Among the largest increases, the abundance of prerecruit males more than doubled, and mature female abundance and effective spawning biomass nearly tripled. The stock reached the rebuilding target after 8 years, 2 years earlier than originally expected with 50% probability based on the management strategy evaluation (Zheng et al., 1997a). The new harvest strategy sought to balance trade-offs in short-term gains in yield and fishing opportunity with long-term stability in yield and reproductive potential. When presenting the proposed rebuilding plan to the crab fishing industry before implementation, Zheng et al. (1996) emphasized the need to “patiently accumulate stock by assuring that additions to the stock through recruitment and growth exceed deletions from the stock from directed harvest, handling, bycatch, and natural mortality”. Indeed, no single large year class resulted in rebuilding success.
Although the adoption of the revised overfishing definition in 2008 has not yet affected the actual harvest rate (still 15%, because the stock exceeds the rebuilding target), this may be expected to happen in future years. Because the former definition was based on total mature biomass for both sexes and because females are not harvested, the probability that future harvests will be constrained is lower for the old control rule than for the new one. A retrospective analysis of estimated fishing mortalities for the first 13 years after implementation of the rebuilding strategy revealed that the new overfishing control rule (F35%) would have been exceeded four times, had it been implemented (Zheng and Siddeek, 2009). Therefore, the new overfishing control rule might be expected to constrain the harvest rate and, thereby, reduce catches in approximately one of every three years. However, the forecast in 2008 that its application would result in a slightly lower catch over the first four years after implementation (followed by higher catches in subsequent years, because of accruing short-term conservation benefits of reduced harvests; NPFMC, 2008b) has not materialized.
In addition to the use of mature males only rather than total mature biomass as the basis, several factors render the new overfishing definition more conservative than the previous one: (i) a slightly lower estimate of M (0.18 vs. 0.2); (ii) accounting for all fishing mortality (directed fishery plus all bycatch) rather than directed fishing mortality only; and (iii) crab biomass is estimated at the midpoint of the fishery, which is lower than the estimated biomass at the time of the survey used formerly, because of accounting for four months of natural mortality between the summer survey and the autumn fishery.
As with any new allocation programme, the crab rationalization programme altered the beneficiaries of the rebuilt crab stock. An important objective was to address excess harvesting and processing capacity, resulting in low economic returns. At the time of implementation, 254 harvesters qualified to participate in the programme, with the expectation that transferability of shares would result in consolidation (Fina, 2005). In reality, the fishing fleet shrank to less than one-third of its original size because of: (i) an industry-funded buy-back programme that purchased 24 licences for the fishery in 2004; (ii) owners of multiple qualifying vessels chose to idle some of these and fish their quotas on their most efficient platforms as a business decision; (iii) leasing of quota shares to other operators; (iv) retirement of some vessels; and (v) popularity of a cooperative programme that resulted in the formation of harvesting associations (NPFMC, 2008c). For vessels remaining in the fishery, gross revenues increased ∼2.5-fold. Processing capacity in the red king crab fishery declined to 40% of pre-rationalization levels. Little information on labour is available, but crewmembers employed on programme vessels apparently held more stable, better-paying jobs than in the former system (NPFMC, 2008c). Younger crewmembers, with limited experience, tended to lose jobs in favour of more experienced ones, who in some cases held quota shares that could be fished along with the vessel's shares (Hughes and Woodley, 2007). In processing plants, peak staffing levels and overtime compensation apparently declined, but the jobs remaining provided longer-term employment (NPFMC, 2008c).
The requirement that 90% of the individual quota of each catcher vessel must be delivered to a processor holding a quota share in a designated region is one of the more controversial aspects of the rationalization programme. A history of contentious price negotiations in Alaskan crab fisheries resulted in the establishment of a binding arbitration process to mitigate its potential effects on price disputes (Fina, 2005). Moreover, a mandatory data-reporting system for processors, coupled with 18-month and 3- and 5-year reviews, was intended to evaluate the economic and social impacts of the programme. The motivation behind this setup was a desire to monitor the relative benefits of processors vs. catcher vessels under the open- and closed-access scenarios, with the intent of maintaining the balance of benefits at the status quo.
A model of the effects of the rationalization programme on crab harvesters indicates a fleet-wide net benefit exceeding US$9 million per year (Matulich, 2009). However, a case has been made that processors did not participate in the benefits, because they apparently captured just 5% of the gross value earned by harvesters, because of the use of preseason formula price models: harvesters have been paid at or above the formula price each year since implementation and have won all seven price arbitrations through 2008. Matulich (2009) argued that harvesters have used binding arbitration as a post-season price-discovery mechanism to maximize rent extraction to avoid sharing risk with processors by negotiating prices before the season, as had previously been the case. An alternative viewpoint is that all arbitrations have been in favour of harvesters, because processors have been seeking unwarranted advantage in an arbitration process that is now reasonably transparent.
The regional distribution of benefits (and costs) is another controversial aspect of the crab rationalization programme. For instance, Knapp (2006) estimated that Kodiak residents lost 100–180 jobs (US$1.0–1.8 million in earnings) during the first year after implementation. Effects on smaller coastal communities depend, in part, on whether they are one of the 65 rural western Alaska communities receiving crab allocations through the community development programme (Knapp and Lowe, 2007). A thorough social and economic analysis is necessary to develop a complete picture of the regional distribution of all benefits.
Vessel safety was another important objective of the rationalization programme. The fatality rate in shellfish fisheries in Alaska in 1991–1996 was 50 times the overall US occupational fatality rate (NPFMC, 2008c). Between 1991 and 2005, 26 vessels sank and 77 fatalities happened in the Bering Sea crab fisheries and more than half the capsizing events in the open-access fishery took place during the first 24 h, when vessels were fully loaded with crab pots (Hughes and Woodley, 2007). During the 3 years from 2005 on, no deaths were recorded in crab fisheries that were included in the rationalization programme. A US Coast Guard initiative to detain vessels overloaded with pots from leaving port appears to have contributed to the improved safety record since 2000 (Hughes and Woodley, 2007). Moreover, the allocations of quota shares meant that vessels could opt to suspend fishing during particularly bad weather.
Before implementation, it was anticipated that the crab rationalization programme would provide additional conservation benefits, by allowing fishers to identify fishing grounds with higher catch rates of legal-sized crabs and to soak their pots for longer, theoretically allowing for more females and sublegal males to exit through escape rings. Although soak time indeed more than doubled during the fishery in 2005 compared with fisheries during 1999–2004, the bycatch of females and sublegal males was not reduced, and highgrading (the process by which the largest, cleanest-shelled legal males are preferentially retained over those with worn, biofouled shells) increased markedly (Barnard and Pengilly, 2006). Approximately 20% of the legal catch, accounting for 12% of all non-retained king crabs, was discarded. In response, ADF&G reduced the TAC for 2006, assuming the same level of highgrading, whereas the industry adopted voluntary measures to address this problem, including the removal of price differentials as incentives to highgrade (NPFMC, 2008a, b, c). These combined actions apparently solved the highgrading problem. Reduced ghost fishing by lost pots may be a conservation benefit of the rationalization programme, because lost pots were reduced from 10–20% to 1–1.4% annually (NPFMC, 2008c).
We surmise that reduced fishing mortality, lower bycatch in groundfish fisheries, and improved habitat protection have all contributed to the recovery of the Bristol Bay stock of red king crabs. Moreover, many fishers claim to now employ sorting tables and discard chutes to expedite careful return of discarded crabs to the sea, thereby reducing bycatch-handling mortality. However, we emphasize that keys to the success of the rebuilding plan were state-of-the-art stock assessments and a thorough management strategy evaluation, because the stock performed remarkably similar to predictions. Although the results were sometimes challenged by a few vocal industry representatives, their publication in peer-reviewed literature (Zheng et al., 1995a, b, 1997a, b) afforded scientific credibility, and reports written in more common language (Zheng et al., 1996) facilitated communication with the wider public. Multiple presentations and discussions at stakeholder meetings before, during, and after completion of analyses helped to secure buy-in from many participants, who came to share the vision for stock recovery with agency scientists and managers. Whereas most of the analyses were conducted by ADF&G (in part with federal funding), additional support by NPFMC staff, particularly concerning the amendment of the groundfish FMP, and other assistance by NMFS, has been crucial. Altogether, the simultaneous adoption of the rebuilding plan, bycatch controls, and area closures provides an excellent example of state/federal co-management, the success of which we attribute to good communications with stakeholders, scientists, fishery managers, and state/federal decision-makers, as well as to an open and transparent decision process.
Although touting the success of the rebuilding plan, we also recognize that environmental factors play an important role in determining crab stock productivity, largely through recruitment processes operating during early life (Zheng and Kruse, 2000, 2006). Year-class strength in many red king crab stocks in Alaska appears to be driven by processes indexed by the Pacific Decadal Oscillation. Proposed mechanisms include the northward displacement of females and subsequent advection of larvae relative to nursery areas, match–mismatch of larvae with the spring bloom, predation by groundfish, and a shift from benthic to pelagic production associated with loss of sea ice. Because many of these processes adversely affect larval and juvenile crab survival under warmer conditions that have prevailed since a regime shift in the late 1970s, rebuilding of the Bristol Bay stock happened generally during unfavourable conditions, but other red king crab stocks in the Gulf of Alaska have not responded in kind to directed fishery closures since 1983 (Kruse and Springer, 2007). Retrospective analyses of one such depleted stock off Kodiak Island indicate that severe overfishing resulted in reproductive failures associated with skewed sex ratios (Collie and Kruse, 1998; Bechtol and Kruse, 2009a, b). This severely depleted stock may be experiencing a predation bottleneck because of increased abundance of predators (e.g. Pacific cod) and their shifts to nearshore crab nursery habitats since the late 1970s (Bechtol and Kruse, in press). We identified two take-home messages from the contrasts between the two stock histories around Kodiak Island and Bristol Bay: (i) severe depletions (e.g. Kodiak) must be avoided in the first place, because chances of recovery diminish with the rate of depletion; and (ii) a stock can be recovered (e.g. Bristol Bay), even during generally unfavourable environmental and ecological conditions, by accounting for and substantially reducing total fishing mortality.
Acknowledgements
We thank Dave Fluharty and Gretchen Harrington for constructive reviews of the manuscript and Kristin Mabry and Lee Hulbert for assistance with some figures. Work on the project by the senior author was funded by the Bering Sea Fisheries Research Foundation.


