


Abstract
The Japanese sardine (Sardinops melanostictus) is a valuable, but highly variable, resource. After record catches during the late 1980s, a 4-year recruitment failure, coupled with overfishing, resulted in severe stock depletion. TAC-based management was introduced in 1997, but the trend has not been reversed and the biomass is now 2 orders of magnitude below the value in 1987. Although a strong correlation exists between winter sea surface temperature (SST) in the nursery area and recruitment, uncertainty about future environmental effects is not explicitly considered in the management. We evaluate the robustness of three catch rules to environmental uncertainty, as captured by three stock–recruitment models (one without an environmental factor and two based on correlations between recruitment and SST for two datasets), in terms of the risk of further depletion, average biomass, and average catch: a constant fishing mortality (CF), a strategy that follows the Japanese guidelines (JG), and a more conservative strategy (ENV) that uses a temperature threshold as a proxy for regime shifts to switch between alternative catch rules. ENV and JG performed better than CF, with ENV displaying better performance in the long term, but differences were negligible in the short term.Hurtado-Ferro, F., Hiramatsu, K., and Shirakihara, K. 2010. Allowing for environmental effects in a management strategy evaluation for Japanese sardine. – ICES Journal of Marine Science, 67: 2012–2017.
Introduction
The Japanese sardine (Sardinops melanostictus) is a valuable, but highly variable, marine living resource. Because of its great abundance and commercial importance, the species has been extensively studied. Annual stock assessment reports have been made since 1996 and are available to the public from 2001 on. During the latter half of the 20th century, the stock has been characterized by extreme variability, with marked periods of depletion and recovery (Figure 1a). After reaching a minimum of ∼20 000 t in 1970, the stock increased rapidly to a record high of more than 10 million tonnes in the mid-1980s. During the late 1980s and 1990s, the biomass dropped by 2 orders of magnitude, stabilizing at ∼130 000 t during recent years (2002–2007; Nishida et al., 2007).
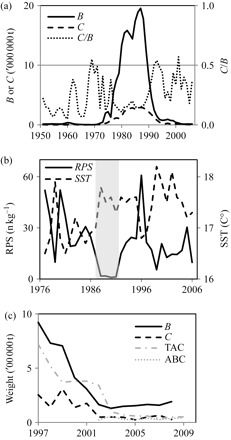
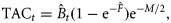
Population dynamics and management of Japanese sardine: (a) annual variations in total biomass (B), catch (C), and rate of exploitation (C/B), 1951–2006 (data for 1951–1976 from Wada and Jacobson, 1998; for 1977–2006 from Nishida et al., 2007); (b) recruits per unit of spawner biomass (RPS) and average SST in the KESA, 1976–2006 (grey band illustrates the 4-year recruitment failure; data from Nishida et al., 2007); and (c) annual values of total biomass (B), TAC, ABC, and actual catch (C), since the introduction of TACs in 1996 (courtesy of Toshio Katsukawa).
The stock decline in the early 1990s resulted from four consecutive years of complete recruitment failure (1988–1991; Watanabe et al., 1995), which corresponds to almost one generation (Figure 1b). When reproductive success improved again, the biomass had already been reduced by an order of magnitude and the stock could not rebuild itself. Moreover, the exploitation rates remained high and this ultimately resulted in the current depleted status of the stock. The cause of the recruitment failure has been widely debated, but most authors acknowledge the negative correlation between recruitment and sea surface temperature (SST) in the Kuroshio extension southern area (KESA), the nursery area of Japanese sardine (Yatsu et al., 2005). It has also been recognized that this environmental index displays signs of recurrent regime shifts approximately every 20 years (Wada and Jacobson, 1998; Yatsu et al., 2005). Therefore, the causes of the failure are most likely natural, rather than anthropogenic.
Using catch quotas to manage fisheries resources is a relatively recent development in Japan. Although the 1970 United Nations Convention on the Law of the Sea established the right to declare 200 nautical mile exclusive economic zones, it was not until 1996 that Japan ratified this convention and approved the introduction of TACs. Since that time, marine resources have been managed according to the allowable biological catch (ABC) guidelines (FAJ-FRA, 2007), which describe different management strategies depending on data availability. Being a data-rich stock, the ABC for Japanese sardine is specified by a catch rule that defines the appropriate fishing mortality (F) based on the biomass level. The actual ABC has been determined based on this catch rule and simulations to predict future states of the stock under scenarios of different levels of F. However, environmental variation and uncertainty are not explicitly considered in the assessment report, and the number of recruits per unit of spawner biomass (RPS) is assumed to remain unchanged from the mean of the past 10 years. Because recruitment has been relatively poor during this period, it could be argued that this assumption should result in conservative management. However, uncertainty and debate regarding the use of worst-case scenarios generated mistrust between decision-makers and shareholders, ultimately resulting in lengthy haggling and discussions on how to set quotas. This problem has resulted in a broad acceptance that worst-case scenarios should be avoided (Butterworth, 2007). Although the ABC is not strictly based on a worst-case scenario, these debates may have resulted in the undesirable effect of setting quotas continuously higher than recommended (Figure 1c).
The incorporation of environmental factors into fisheries management has recently gained attention in various fisheries, including those on small pelagic fish (De Oliveira and Butterworth, 2005; Barange et al., 2009), squid (Agnew et al., 2002), and pollock (A'mar et al., 2009). However, the main research focus has generally been on the prediction of future recruitment, rather than on adjusting the catch rule used in management. This approach presents the limitation that it requires good predictions of the relevant environmental factor (De Oliveira and Butterworth, 2005), although simulation studies have demonstrated that incorporating environmental factors directly in management can reduce risks and increase yields (Basson, 1999).
Using a simplified management strategy evaluation framework (Smith et al., 1999), we constructed a population model and explored the performance of different catch rules under the condition of uncertainty about environmental variability, with the aim to help bridge the gap between assessment and management and to provide managers with tools that cope with these sources of uncertainty. Importantly, it was not our purpose to search for the optimal management strategy, but to provide a general evaluation of potential management strategies across a range of possible environmental effects on recruitment.
Methods
Stock data from 1976 to 2006 were taken from Nishida et al. (2007). SST data were obtained from two sources: the Japanese Meteorological Agency (JMA), as reported in Yatsu et al. (2005); and the British Atmospheric Data Centre Ukmo-HadISST database (BADC, 2009). Following Yatsu et al. (2005), we used the average SST during winter (January to March) on the KESA nursery grounds (31–35°N and 150–164°E; original data had the form of monthly SST averages for 1° × 1° blocks), 1950–2007.

Parameter values and AIC for the three Ricker recruitment models.
| Model/parameter | α | β | γ | σε | AIC |
|---|---|---|---|---|---|
| Without environmental effects | 3.61 | –0.000156 | – | 1.27 | 172 |
| Based on JMA | 30.19 | –0.000156 | –1.56 | 1.12 | 161 |
| Based on BADC | 22.74 | –0.000156 | –1.14 | 1.20 | 168 |
| Model/parameter | α | β | γ | σε | AIC |
|---|---|---|---|---|---|
| Without environmental effects | 3.61 | –0.000156 | – | 1.27 | 172 |
| Based on JMA | 30.19 | –0.000156 | –1.56 | 1.12 | 161 |
| Based on BADC | 22.74 | –0.000156 | –1.14 | 1.20 | 168 |
Parameter estimates for the density-dependent weight-at-age model using linear regressions.
| Age class | ma | pa | σ | r2 | p-value |
|---|---|---|---|---|---|
| 0 | 24.9 | –0.00074 | 8.66 | 0.27 | <0.01 |
| 1 | 57.8 | –0.00083 | 9.34 | 0.29 | <0.01 |
| 2 | 87.8 | –0.00164 | 10.45 | 0.56 | <0.001 |
| 3 | 109.3 | –0.00190 | 10.66 | 0.63 | <0.001 |
| 4 | 123.6 | –0.00173 | 13.34 | 0.48 | <0.001 |
| 5+ | 136.4 | –0.00153 | 12.39 | 0.45 | <0.001 |
SST was simulated by randomizing historical data. Sardine abundance revealed favourable (1971–1987) and unfavourable (1951–1970 and 1988–2007) production regimes in response to environmental variations (Wada and Jacobson, 1998). The average winter SST for each year (1950–2007) was assigned to either favourable or unfavourable regimes, based on the year's reproductive success, as defined by Wada and Jacobson (1998). To generate environmental time-series of SST, regime shifts were assigned a probability p to occur in a given year and the SST values were drawn at random from the appropriate regime set. Because of the apparent bidecadal nature of regime shifts, p was assigned a value of 0.05 and assumed constant across time, so that on average a regime shift would occur every 20 years. The procedure was applied independently to the JMA and BADC datasets.


Constant F strategy (CF): a widely used basic management strategy that does not use any reference points (Hilborn and Walters, 1992);
ABC according to the Japanese guidelines (JG): a feedback management strategy that uses three reference points (Nishida et al., 2007), two for biomass (Bban = 22 000 t and Blim = 222 000 t) and one for fishing mortality (Flim = 0.47); Flim sets the maximum F allowed; Blim acts as a threshold below which F decreases linearly until Bban is reached, where the fishery is closed and F becomes zero (note that the definitions used in Japan differ from those used elsewhere);
Environment-based rule (ENV): a modification of JG, based on an idea of King and McFarlane (2006), which uses the same three reference points in combination with an SST threshold that represents a switch between alternative states (set arbitrarily at 17.1°C, slightly above the midpoint between the averages for favourable and unfavourable regimes identified by Wada and Jacobson (1998). If SST > threshold, the catch rule is modified by a factor λ = 0.6. This strategy is the most conservative one among the three, because F is reduced further when the environment is unfavourable.
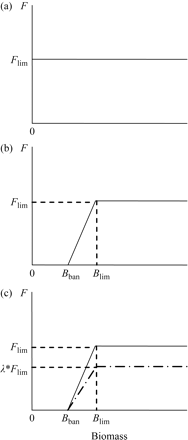
The three catch rules evaluated (see text for explanation): (a) constant fishing mortality (CF); (b) Japanese guidelines (JG); and (c) environmental-based management (ENV).
 is the estimated biomass,
  is estimated from the catch rule using
  , and M is the natural mortality rate (=0.4). Quotas are assumed exhausted unless they are higher than 0.6 of the total biomass, the assumed maximum “catchable” fraction of the stock corresponding to the observed historical maximum (Nishida et al., 2007); in such cases, we assumed that the quota would not be completely caught and the catch would correspond to 0.6 of the biomass.
The three sets of recruitment parameters, in combination with the three catch rules, represent nine possible scenarios. Using Monte Carlo simulations with 1000 iterations over a period of 20 years, each scenario was evaluated over a range of Flim (0.05–1.8; for CF, the same range of F-values were evaluated as if Flim is the target). A special remark must be made about the scenario of no environmental effects on recruitment and ENV. Although recruitment was not affected, SST time-series were still generated and ENV responded accordingly; this can be interpreted as a scenario where an inappropriate catch rule is implemented.
Depletion risk, mean biomass, and mean catch were selected as performance statistics. Depletion risk was defined as the probability of the stock falling below a specific level. Because the stock is already considered depleted (current biomass ≈ 130 000 t; Nishida et al., 2007), the depletion level was arbitrarily set at 100 000 t and should therefore be interpreted as the probability of further depletion. Mean biomass and mean catch should not be interpreted as predictors, but rather as indicators. To summarize the results, performance statistics were summed for each catch rule across recruitment scenarios, without weightings. For ease of visualization, profiles were drawn across values of Flim for the three performance statistics. To evaluate relative performance, results were normalized by dividing by the value for the worst performing catch rule (i.e. CF).
Results
The environment had a greater influence on recruitment based on the JMA data (higher γ-value) than based on the BADC data, and the model fit was also better (lower σ and AIC; Table 1).
The performance statistics across different values of Flim had the same shape for all catch rules, but their levels differed (Figure 3). Always, a higher biomass corresponded to a lower depletion risk, with biomass monotonically decreasing and risk increasing in a logistic fashion as Flim increased, whereas catches followed a curve with an optimum. Long-term (20 years) and short-term (5 years) responses were quite different.
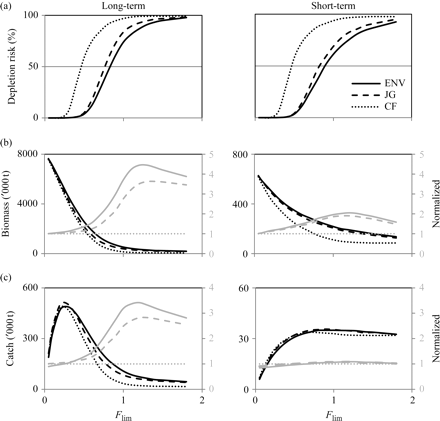
Profiles of the three long-term (20 years; left panels) and short-term (5 years; right panels) performance statistics (averaged over the three stock–recruitment scenarios) over the range of Flim evaluated for the three catch rules (CF, JG, and ENV): depletion risk (top), biomass (middle), and catch (bottom). For biomass and catch, the normalized values (relative to CF results) are indicated by grey lines (right-hand scale).
In the long term, depletion risk revealed an acceleration of the increase between Flim ≈ 0.3–0.8 for CF and Flim ≈ 0.7–1.2 for both JG and ENV. ENV, being the most conservative catch rule, gave the best performance in preventing stock depletion, with JG following closely, whereas CF did considerably worse. The 50% depletion risk was reached at Flim ≈ 0.82, 0.75, and 0.46 for ENV, JG, and CF, respectively. Regardless of the strategy used, biomass reached high levels for low Flim values, but then decreased rapidly in an exponential fashion. ENV again exhibited the best overall performance, followed closely by JG and, at a distance, by CF. The catch peaked for Flim values between 0.2 and 0.3 for all three strategies, with JG doing slightly better than the others. The differences are more clearly visible when biomass and catch are plotted as normalized trajectories relative to the worst performing CF strategy. Discrepancies were greatest around Flim ≈ 1.2, where ENV and JG did a factor 4.5 and 3.5 better, respectively, than CF for biomass, and a factor 3 and 3.5 better, respectively, regarding catch.
The short-term results indicated no appreciable differences between ENV and JG, but these two exhibited lower depletion risk and higher biomass than the CF strategy. Catch trajectories were virtually the same for all three catch rules, peaking at Flim ≈ 0.7–0.8.
The long-term performance statistics for the different catch rules when applied to the three stock–recruitment scenarios revealed no differences, as long as Flim < 0.4 (Figure 4). However, at higher values, ENV and JG did substantially better in all scenarios. Only for the JMA-based scenario did ENV outperform JG. The small differences between JG and ENV under no environmental effect can be attributed to “random” reductions in catches when ENV was used. The short-term performance statistics among stock–recruitment scenarios (not illustrated) were virtually indistinguishable and essentially resembled the average profiles given in Figure 3.
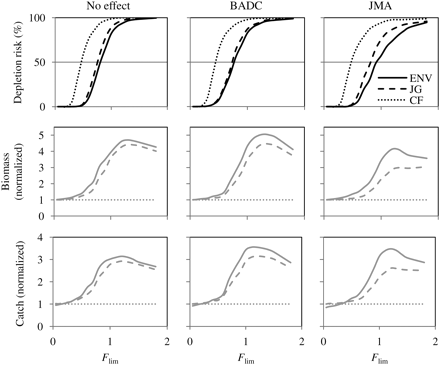
Long-term (20 years) profiles of performance statistics over the range of Flim evaluated for each stock–recruitment scenario—no environmental effect, BADC-based and JMA-based—and for the three catch rules (CF, JG, and ENV): depletion risk (top), normalized (relative to CF results) biomass (middle), and catch (bottom).
Overall, the conclusion is that long-term management outcomes are sensitive to environmental influences, with ENV producing the best results, because it represents the most conservative catch rule. ENV performance was not sensitive to small changes in λ.
Discussion
Initially, we intended to compare the current quota-setting process side by side with the strategies evaluated. However, the differences among ABC, TAC, and actual catch made it impossible to discover clear decision rules in the current process—if there are any—and therefore, to make a comparison with rule-based strategies. The FAO (1995) precautionary approach paradigm demands that management procedures have clear objectives and involve prespecified decision rules that have been evaluated in advance, but it is only since 2009 that Japan has adopted new management procedures ensuring that quotas are set according to the ABC recommendations given by the Japanese Fisheries Agency.
Among the three catch rules evaluated, no “best one” could be identified clearly. As long as Flim is kept low, the CF strategy may suffice, but this strategy performed poorly at higher Flim values. The feedback control rules (JG and ENV) both performed more satisfactory up to Flim ≈ 1. Although ENV does introduce additional undesirable complexities into the management process (e.g. quotas might have to be reduced from one year to the next if a regime shift occurs, even if the biomass is stable), this catch rule would reduce the depletion risk substantially compared with JG. Particularly when environmental influences are strong, as found for the Ricker relationship based on JMA data, ENV appears a good candidate for risk-averse management. This approach would be consistent with other studies on the use of environmental factors in managing fisheries (Agnew et al., 2002; De Oliveira and Butterworth, 2005), but with the additional merit that it does not require good predictions of SST (Basson, 1999), but only an SST threshold.
The long-term performance of JG may be suboptimal, but it does not have the additional uncertainty about the appropriate λ to be used in ENV, which may make it a better choice for reaching short-term objectives. Setting short-term objectives in fisheries management tends to be regarded as asking for trouble, but may present a reasonable case when big economic considerations are at stake. For instance, in a scenario of high discount rates, high present values would be a strong incentive against conservation of the resource (Huppert, 1996). Butterworth and Bergh (1993) addressed this problem in a scenario of social insecurity and high resource variability of the South African fisheries for small pelagic fish. However, until it could be proven that the Japanese sardine would easily recover under good environmental conditions, regardless of fishing pressure, environmental variability remains the main source of uncertainty, especially because it should be considered a cause of high discount rates (Huppert, 1996). In this scenario, setting quotas based on a feedback strategy might produce a similar effect as a strategy based on switching between target species (Katsukawa and Matsuda, 2003), by ensuring resource sustainability, at the same time reducing economic uncertainty.
Because of its high natural variability and dependence on environmental factors, it is difficult to predict whether the Japanese sardine stock will recover soon or to estimate the probability of a recovery under any given catch rule, because any such prediction would be dependent on knowledge of the future environment. Nevertheless, we can still draw some conclusions relevant to stock recovery. Although there is no guarantee that the stock will recover if fishing mortality is reduced, high fishing mortality can apparently hinder stock recovery even under favourable environmental conditions. Although Flim is currently set at 0.47, fishing mortality during the period 1998–2006 averaged 0.7 (Nishida et al., 2007), which is closer to the short-term maximum catch level than to the long-term one. Regardless of the catch rule used for management, and given the difference between short-term and long-term performances of the catch rules, any stock recovery plan should rely on the setting of long-term rather than short-term objectives. As stated earlier, ENV seems a good candidate for risk-averse management, which is required for a stock recovery plan. However, the conflict between short-term and long-term objectives cannot be resolved directly through science (Smith et al., 1999); it should therefore be addressed by managers.
Acknowledgements
We acknowledge Sachihiko Itoh (The University of Tokyo) and Toshio Katsukawa (Mie University) for their invaluable collaboration and comments. We also thank colleagues in the Fish Population Dynamics Laboratory for stimulating discussions, Anthony D. M. Smith from CSIRO Australia for his constant help and attention, Niels Daan, Myron Peck, and Bjarte Bogstad for their useful and extensive comments on the manuscript, and the British Atmospheric Data Centre (BADC) for providing the environmental data used. The study was supported in part by a Monbukagakusho Scholarship awarded by the Japanese Government.
