


Abstract
Habitat template models that integrate physical, chemical, and biological data have the potential to explain geographic variation in life-history traits within assemblages and to predict locations where species will be most vulnerable to anthropogenic impact. A previously developed model based on spatial variations in scope for growth (SG) and natural disturbance (ND) for the Scotian Shelf/Bay of Fundy was tested for its ability to predict fish life-history traits, species diversity, and community composition using trawl survey data. Of 30 dominant fish species, large, slow-growing ones most vulnerable to overexploitation tended to be found in naturally stable habitats. Among consistently co-occurring groups, functional differentiation, rather than similarity of life history, characterized assemblages, whereas among survey strata, species richness peaked at intermediate levels of ND and species evenness increased with average SG. Community composition was significantly correlated with both habitat variables, declined by 40% through time preceding structural changes on the eastern Scotian Shelf, but geographic distance, depth, and bottom temperature remained more strongly related to composition. The results revealed compelling matches between template predictions and patterns of fish species diversity, but low variation in diversity of life history, and mobility of fish may account for some of the weaker matches to model predictions.Fisher, J. A. D., Frank, K. T., Kostylev, V. E., Shackell, N. L., Horsman, T., and Hannah, C. G. 2011. Evaluating a habitat template model's predictions of marine fish diversity on the Scotian Shelf and Bay of Fundy, Northwest Atlantic. – ICES Journal of Marine Science, 68: 2096–2105.
Introduction
One of the main challenges long-associated with understanding complex systems is to quantify the multiple interacting physical, chemical, and biological influences on ecosystem structure and function (Bigelow, 1930). This challenge remains relevant today in the context of the data and conceptual requirements facing ecosystem approaches to marine research and management. For example, the type of integrated, interdisciplinary, and inclusive approach advocated by Bigelow (1930) has been identified as crucial to ecosystem assessment and management (Mangel and Levin, 2005; Carpenter et al., 2006; Marasco et al., 2007) and inscribed as the “tenth commandment” of ecosystem-based fisheries scientists (Francis et al., 2007). On the other hand, the need to understand all details before comprehending a complex system has been dispelled as a myth that has limited the application of ecosystem approaches to marine management (Murawski, 2007).
As potential bridges between these perceived commandments and myths, models that predict biological structure based on ecological theory and local habitats (e.g. Southwood, 1988; Kostylev and Hannah, 2007) and habitat maps (e.g. Cogan et al., 2009; Shumchenia and King, 2010), both play increasing roles in identifying vulnerable locations and species assemblages, highlighting potential areas in need of protection, and evaluating the efficacy of existing protected areas (Noji et al., 2009). However, as ecosystem-based management is predicated upon understanding links between habitat features, species spatial distributions, and species life-history traits, the utility and application of such predictive habitat models and maps require validation by examining model predictions against available empirical data (Southwood, 1988; Townsend and Hildrew, 1994; Kostylev and Hannah, 2007; Moore et al., 2009; Shumchenia and King, 2010).
Kostylev and Hannah (2007) developed a habitat template model that integrates chemical, physical, and geological data within a marine mapping framework to predict sites and species traits most vulnerable to anthropogenic impact. They combined multiple oceanographic, hydrographic, and benthic-data layers to produce spatially resolved estimates of habitat variation on the Scotian Shelf, Bay of Fundy, and Georges Bank, Northwest Atlantic Ocean. The data were combined to form two orthogonal axes: natural disturbance (ND; a local characteristic of sea floor environment) and scope for growth (SG; an estimate of local energy available for growth and reproduction; Figure 1a and b). In keeping with the wider development of habitat template models for aquatic and terrestrial habitats (reviewed by Southwood, 1988; Townsend and Hildrew, 1994; Kostylev and Hannah, 2007; Menendez et al., 2010), and increasing interest in trait-based analyses with the goal of predicting ecological structure (Webb et al., 2010), the model also predicted highest diversity at intermediate levels of SG and ND, and differences in the relative life-history strategies of the species found in different habitats in an r–K continuum context [for overviews and limitations of r–K life-history strategies, see Southwood (1988) and Winemiller and Rose (1992)]. Finally, in the context of identifying vulnerable marine habitats, the model predicted inverse relationships between SG and risk of overfishing, and between ND and risk of habitat damage.
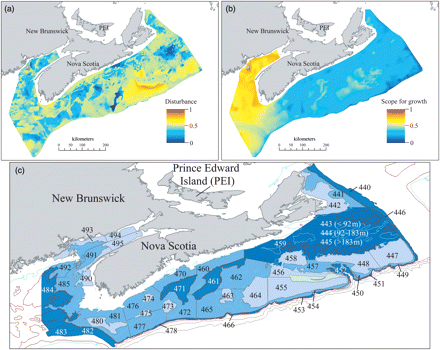
Spatial variations in (a) natural disturbance and (b) scope for growth, both mapped at a resolution of 500 m based on Kostylev and Hannah's (2007) habitat template model from the Scotian Shelf, Bay of Fundy, and eastern Georges Bank. (c) Scotian Shelf and Bay of Fundy groundfish survey domain illustrating depth stratified survey strata (labelled 440–495) annually sampled since 1970. The intensity of the blue shading indicates strata depths.
This habitat template model was initially examined in the context of synoptic benthic invertebrate sampling programmes, including a set of benthic photographic stations spanning the Scotian Shelf and grab samples from a smaller subset of locations on Sable Island Bank. Based on the evaluations of both datasets, habitat template values provided better predictions of benthic community composition than distances among samples (Kostylev and Hannah, 2007). However, no formal examination of life-history variability, temporal dynamics, or fish species composition has been performed. Therefore, given the interest in identifying vulnerable habitats in the context of ecosystem-based fisheries management (Francis et al., 2007; Murawski, 2007), whether the habitat template can explain the changing spatial distributions, differential vulnerabilities, and expected life-history traits of fish remains unresolved. Validation of model predictions in the context of marine fish data is important because (i) life-history variation among fish can be more complex than an r–K continuum (Winemiller and Rose, 1992), (ii) as a single phylum, fish may exhibit less phenotypic and functional variability than among samples of benthic invertebrates (Persat et al., 1994), (iii) the effects of local ND and food limitation on large, long-lived, mobile species may be relatively inconsequential relative to their effects on small, short-lived, sessile species (Townsend and Hildrew, 1994), and (iv) fish species within assemblages, being somewhat more mobile compared with epifauna and infauna, may be less stable spatially and exhibit weaker relationships with local habitat conditions (Townsend and Hildrew, 1994; Kostylev and Hannah, 2007; Reiss et al., 2009a). Therefore, ND and adversity (the latter representing the reciprocal of SG) are terms requiring scaling not only among habitats, but also relative to the life-history characteristics of the species under investigation.
Given both the environmental influences and long history of fishing, as in other systems (Hutchings, 2000; Reynolds et al., 2005), Scotian Shelf and Bay of Fundy marine fish abundances, distributions, life-history traits, and interactions have been modified by exploitation and local environmental conditions and may be indirectly impacted by habitat degradation (Mahon and Smith, 1989; Choi et al., 2005; Shackell and Frank, 2007; Horsman and Shackell, 2009). Together with a wealth of fishery-independent monitoring data (Shackell and Frank, 2003) and links between life-history traits and vulnerability (Winemiller and Rose, 1992; Hutchings, 2002), sampling of marine fish provides data to extend previous tests of predictive habitat template models.
Here, we report the results of explorations of Scotian Shelf and Bay of Fundy marine fish life-history variability, biodiversity, and spatial distributions in the context of the Kostylev and Hannah (2007) habitat template model based on annual, georeferenced, fisheries-independent surveys of marine fish. We first quantify life-history variation among dominant species, then examine whether similarities in life-history parallel persistent species co-occurrences within local habitats, which is one prediction of the habitat template model. Second, we report variability in habitat template layers among survey strata and test whether maximum fish diversity is in habitats characterized by intermediate levels of both SG and ND by examining two components of diversity, species richness and species evenness (the relative abundance of individuals among species). Third, in keeping with the Kostylev and Hannah (2007) analyses of the match between community composition and habitat template values, we examine these relative to geographic distance, sample depth, and water temperature, and quantify temporal variability in the match between species relative abundance, habitat template value, and other local environmental factors during a period of escalating fisheries.
Methods
Marine fish survey data
A fishery-independent groundfish trawl survey of the Scotian Shelf and Bay of Fundy has been conducted annually during July since 1970 by the Canadian Department of Fisheries and Oceans (Halliday and Koeller, 1981). The survey follows a standardized sampling protocol using a Western IIA otter trawl (wingspread 41 feet), with a 19-mm codend mesh lining towed on the seabed for 30 min over a distance of ∼3.25 km (a swept-area of 0.0404 km2 per tow). Tow locations are assigned according to a random sampling design (Figure 1c), with 48 survey strata stratified by depth (individual strata range from 495 to 13 480 km2, total area sampled spans >160 000 km2), and tow numbers are proportional to stratum area to provide unbiased estimates of population abundance through time (Doubleday, 1981). Although the primary objective of the survey has been to determine the distribution and abundance of exploited species, the survey is also conducted to gain information on non-target species (Halliday and Koeller, 1981). Therefore, the identity, species-specific abundance, and biomass of all fish are recorded, along with the geospatial location of all tows, water depth, and bottom-water temperature. Catch rates and species diversity can therefore be expressed as averages per tow, per stratum, or per strata grouping, providing multiscale data useful for population- to community-level analyses of marine fish and their local environment (Shackell and Frank, 2003). Here, we present analyses of patterns primarily among strata, because this spatial scale provides multiple samples per stratum per year, and strata were designated to reduce variance within areas and to facilitate comparison among areas (Doubleday, 1981).
Data extraction was limited to marine fish numbers, weights, and identities, along with geographic position, depth, and temperature for a total of 2979 tows collected from 1970 to 1989. This 20-year subset of available data was chosen as a baseline period because it preceded the collapse of apex predator populations and trophic restructuring on the eastern Scotian Shelf in the early 1990s (Bundy, 2005; Choi et al., 2005; Frank et al., 2005), so might best meet the assumption that the map classifies a “natural environment” (Kostylev and Hannah, 2007). The tows caught a total of 106 finfish species. Extraction of annual data allowed aggregation within four 5-year time blocks designated to reduce temporal variability, but at the same time facilitating analyses of changing patterns through time.
Marine fish life-history data
From the full list of species recorded, a detailed life-history database was constructed based on data on the life-history traits of the 30 species that were taken in >5% of the trawl samples. Such exclusion of relatively rare species restricted analyses to those species for which detailed life-history data were available and recorded from the Scotian Shelf in all or many survey years. The subset of species (Table 1) also overlapped with 26 of 31 dominant Scotian Shelf species previously chosen based on aggregate weights and abundances in an earlier exploration of fish-habitat associations (Mahon and Smith, 1989). For each species, 14 life-history traits (Supplementary Tables S1 and S2) were compiled from data within three data sources (Scott and Scott, 1988; Collette and Klein-MacPhee, 2002; Froese and Pauly, 2010). Eight of the trait inputs were based on observed data (maximum length, maximum age, maximum weight, geometric mean fecundity, egg guarding, mean egg diameter, egg buoyancy, and spawning season; Supplementary Table S1). The other six species-specific traits were derived from Fishbase.org model outputs (life-history tool; Froese and Pauly, 2010) based on relationships among life-history traits, using default values (e.g. growth rate, natural mortality, length and age at maturity, trophic level, intrinsic rate of population increase; Supplementary Table S2). In the relatively few cases where data were not available from the three sources for a particular trait, estimates of life-history traits from related species were used. These normalized life-history data were subjected to principal component analysis (PCA) that identified each species’ relative position in life-history space relative to all others, along with the loadings of the 14 life-history traits on the dominant principal component axes (PC1 and PC2). PCA was performed using PRIMER v. 6 (Clarke and Warwick, 2001), and species-specific values of PC1 and PC2 were regressed against average species positions in the continuum of SG and ND.
List of the 30 most frequently occurring species during Scotian Shelf summer research surveys used in the analyses of life-history variation.
| Species | Common name | Order | Family | Species ID in Figures 2–4 |
|---|---|---|---|---|
| Hippoglossoides platessoides | American plaice | Pleuronectiformes | Pleuronectidae | Ap |
| Gadus morhua | Atlantic cod | Gadiformes | Gadidae | Cd |
| Melanogrammus aeglefinus | Haddock | Gadiformes | Gadidae | Hd |
| Amblyraja radiata | Thorny skate | Rajiformes | Rajidae | Ts |
| Merluccius bilinearis | Silver hake | Gadiformes | Gadidae | Sh |
| Glyptocephalus cynoglossus | Witch flounder | Pleuronectiformes | Pleuronectidae | Wf |
| Sebastes spp. | Redfish (unsorted) | Scorpaeniformes | Sebastidae | Rf |
| Limanda ferruginea | Yellowtail flounder | Pleuronectiformes | Pleuronectidae | Yf |
| Myoxocephalus octodecemspinosus | Longhorn sculpin | Scorpaeniformes | Cottidae | Lh |
| Urophycis tenuis | White hake | Gadiformes | Phycidae | Wh |
| Pollachius virens | Pollock | Gadiformes | Gadidae | Pk |
| Clupea harengus | Atlantic herring | Clupeiformes | Clupeidae | Hr |
| Hemitripterus americanus | Sea raven | Scorpaeniformes | Hemitripteridae | Sr |
| Lophius americanus | Monkfish | Lophiiformes | Lophiidae | Mk |
| Squalus acanthias | Spiny dogfish | Squaliformes | Squalidae | Sd |
| Anarhichas lupus | Atlantic wolffish | Perciformes | Anarhichadidae | Aw |
| Malacoraja senta | Smooth skate | Rajiformes | Rajidae | Ss |
| Urophycis chuss | Red hake | Gadiformes | Phycidae | Rh |
| Zoarces americanus | Ocean pout | Perciformes | Zoarcidae | Op |
| Pseudopleuronectes americanus | Winter flounder | Pleuronectiformes | Pleuronectidae | Wn |
| Hippoglossus hippoglossus | Atlantic halibut | Pleuronectiformes | Pleuronectidae | Hl |
| Triglops murrayi | Mailed sculpin | Scorpaeniformes | Cottidae | Ms |
| Leucoraja ocellata | Winter skate | Rajiformes | Rajidae | Ws |
| Argentina silus | Atlantic argentine | Osmeriformes | Argentinidae | Ar |
| Brosme brosme | Cusk | Gadiformes | Lotidae | Cu |
| Alosa pseudoharengus | Alewife | Clupeiformes | Clupeidae | Aw |
| Scomber scombrus | Mackerel | Perciformes | Scombridae | Ma |
| Enchelyopus cimbrius | Fourbeard rockling | Gadiformes | Lotidae | Fr |
| Nezumia bairdii | Marlin spike grenadier | Gadiformes | Macrouridae | Gr |
| Phycis chesteri | Longfin hake | Gadiformes | Phycidae | Lo |
To test the hypothesis that species sharing local habitats shared similar life-history traits, the variation in life-history traits was examined among eight groups of species identified by Mahon and Smith (1989) as persistently co-occurring during Scotian Shelf summer research surveys from 1970 to 1981. Specifically, the ANOSIM routine in Primer v.6 (Clarke and Warwick, 2001) was used to test the null hypothesis that within-group similarity in life-history traits was not significantly different from among-group similarity in life-history traits.
Habitat template model and the underlying data layers
The habitat template model provided estimates of ND and SG at a spatial resolution (pixel size) of 500 m, based on multiple data layers (Figure 1). As detailed by Kostylev and Hannah (2007), the ND layer (Figure 1a) is the ratio of a characteristic frictional velocity to the critical shear stress, based on inputs of sediment grain size and estimates of characteristic bottom stress (a composite of bathymetry, wave height and period, near-bottom tidal currents, and grain size). Underlying the SG layer (Figure 1b) is equally weighted spatial variation in food availability (surface stratification, spring chlorophyll a), metabolic rates (mean bottom temperature), thermal stress, and temporal uncertainty for reproduction (annual range of and interannual variation in bottom temperature), and metabolic stress (bottom oxygen percentage saturation; Kostylev and Hannah, 2007). Both layers were scaled to range from 0 to 1, then projected spatially in ArcGIS 9.2 with totals of 715 434 and 829 541 estimates (pixels) of SG and ND across the model domain, respectively.
Matching marine fish survey data and habitat template layer data
Analyses at the level of a stratum were facilitated by a spatially resolved GIS layer that outlined individual survey strata. Individual SG and ND pixels were therefore assigned to 1 of 48 survey strata using the “Intersect” routine in ArcGIS 9.2. In all, 89% of SG pixels and 80% of ND pixels fell within the boundaries of the survey strata and were retained following the Intersect, because the habitat template model domain also extends to adjacent areas beyond the region sampled by the Scotia–Fundy groundfish survey (Kostylev and Hannah, 2007). There was a 96% overlap in pixels retained between the two habitat template layers (ND vs. SG). From the perspective of groundfish survey samples, the Intersect feature revealed that the vast majority (91%; 2697 of 2979) fell within the boundaries of both habitat template layers; the excluded groundfish survey samples extended into deep water at the shelf edge just beyond the domain of the template model (Figure 1).
Assignments of SG and ND values to individual survey samples also provided a measure of average habitat conditions per sample at a finer scale than averages within survey strata. Because of the higher resolution of the template layers’ geographic position relative to the resolution of the locations of the survey sample locations (two decimal points), multiple SG and ND pixels that intersected with each sample (mean = 9.33, s.d. = 3.70) were averaged to provide single SG and ND values per survey sample.
These overlapping habitat template pixels, survey sample locations, and marine fish identities, numbers, and weights constituted the core data extracted, compiled, and examined at spatial scales from individual survey samples to stratum-level averages.
Species composition and local habitat conditions
In keeping with initial validations of the habitat template model based on invertebrate datasets (Kostylev and Hannah, 2007), we also compared multivariate similarity matrices of marine fish species composition (Bray–Curtis similarities based on fourth-root-transformed abundances) among samples to normalized estimates of geographic distance (based on Euclidian distance among geographic coordinates), combined and individual habitat template layer values, bottom-water temperature, and sample depth. For each habitat factor, a similarity matrix among samples within each 5-year time block was constructed and compared with the species composition via the Spearman rank correlations within the RELATE routine in PRIMER v. 6 (Clarke and Warwick, 2001). Degrees of matching (correlations) with species relative abundances were compared among habitat factors and within habitat factors through time to identify the degree of matching between habitat template layers relative to other factors and to quantify the consistency of explanatory factors among time blocks.
Results
Life-history variation among dominant Scotian Shelf species
The loadings of 14 life-history variables on the first two principal component axes (PC1 and PC2) illustrate life-history trade-offs among 30 dominant fish species (Figure 2a). In keeping with an established continuum of general fish life-history strategies divided into three groups (periodic, opportunistic, and equilibrium; Winemiller and Rose, 1992), species exhibiting periodic strategies (characterized by large maximum size, buoyant eggs, and high fecundity) included Atlantic halibut, Atlantic cod, cusk, and white hake. At the opposite end of the parental-investment continuum are spiny dogfish, Atlantic wolfish, and multiple skate species, as equilibrium strategists (Figure 2b). Finally, two species of sculpin, fourbeard rockling, and alewife typify opportunistic species, which share the characteristics of small size, high intrinsic rates of increase, and high natural mortality (Figure 2b).
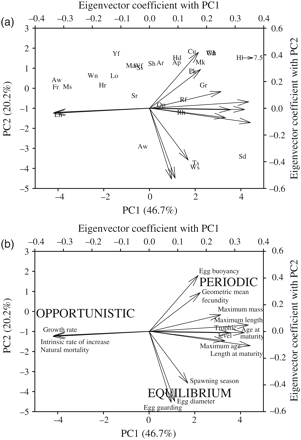
Relationships among species and life-history traits from the 30 most prevalent Scotian Shelf marine fish, as revealed by principal components (PC) analysis. The first two PC axes account for a total of 66.9% of the variation among species. (a) Variation among dominant species (labels from Table 1) in life-history space, together with vectors on separate axes (top right) that quantify the relative loadings of the 14 life-history traits (Supplementary Tables S1 and S2) on PC1 and PC2. (b) Variation in sign and strength of the 14 life-history traits and a schematic illustration of the three dominant life-history strategies (after Winemiller and Rose, 1992) associated with variation along PC1 and PC2.
One prediction of the habitat template model was that the life-history traits of species found within the habitat template space should differ in response to ND and SG. Whereas Scotian Shelf marine fish exhibit a range of life-history characteristics within survey strata, at the scale of the entire shelf, some frequently occurring, large-bodied, long-lived species (e.g. Atlantic halibut, Atlantic wolffish, monkfish, and Atlantic cod) tended to occur in habitats with relatively low SG and low ND during each of the 5-year periods (Figure 3). However, correlations between most average habitat template values and life-history PC1 and PC2 values were not significant (PC1 SG, PC2 SG, PC2 ND, all |r| < 0.14), demonstrating little relationship between species traits and predominantly occupied habitats. In contrast, there was a stronger negative correlation between PC1 and ND (r = −0.31, p = 0.07), which suggests that species with life-history traits predicted to make them most vulnerable to overexploitation (large size, slow growth; Figure 2) also tended to be found in habitats with little ND. Among the dominant species, in each of the 4-year time blocks, there were consistent but weak negative correlations (r = −0.33 to −0.40) between the average SG and the average ND (Figure 3). These patterns suggest that, on average, species that tend to occupy habitats expected to be most vulnerable to overfishing (low SG) tend also to occupy habitats expected to be least vulnerable to habitat damage (high ND), and vice versa.
![Species-specific averages of SG and ND for the 30 most prevalent species sampled across the Scotian Shelf (labels described in Table 1) during the periods (a) 1970–1974 and (b) 1985–1989. The plot illustrates an important species-specific life-history trait, namely maximum body length as proportionally scaled symbols [correlation with PC1 shown in Figure 2a, r > 0.90]. As predicted by the habitat template model, some large, long-lived species (e.g. Atlantic halibut, Atlantic wolffish, Atlantic cod, and monkfish) tend to occur within habitats characterized by relatively low SG and ND.](https://oup.silverchair-cdn.com/oup/backfile/Content_public/Journal/icesjms/68/10/10.1093_icesjms_fsr147/1/m_fsr14703.gif?Expires=1716399563&Signature=X5gIMoNl6aLJwFmhPnHXGip2eISrDLkJCEWz~u3NZtClU6Zqgg~e1-omgTZaFUpFbO3XPTIhJGnaqKdDHYMd6hiyyf7mv6J8kfVBosWmAUctubbnK3AX3m7eOksvEFY~zfUbFXMm9sfzMYCQEFbfpZyz61SUDk53IuWLNeymFiuwXKqljc82heEQfeh6LlOkhvdJ9lFYMBM~-dg1NRb2IutTAsA3ZMi-YILu790vfqA30Yy5PjHnUJHg0XO-5K3Fz5KFqikhcPN2JHmdnNzAVMG6qTRchQQ7QidALWyTbevMxvbEWOlqJuhNHRzvZc-lbxwt7QCAY1H6Yacy-3CwUw__&Key-Pair-Id=APKAIE5G5CRDK6RD3PGA)
Species-specific averages of SG and ND for the 30 most prevalent species sampled across the Scotian Shelf (labels described in Table 1) during the periods (a) 1970–1974 and (b) 1985–1989. The plot illustrates an important species-specific life-history trait, namely maximum body length as proportionally scaled symbols [correlation with PC1 shown in Figure 2a, r > 0.90]. As predicted by the habitat template model, some large, long-lived species (e.g. Atlantic halibut, Atlantic wolffish, Atlantic cod, and monkfish) tend to occur within habitats characterized by relatively low SG and ND.
When the co-occurring marine fish assemblages identified by Mahon and Smith (1989) were compared according to life-history traits, the groups were characterized by high overlap in life-history space (Figure 4), and they did not differ significantly in life-history characteristics (ANOSIM R = −0.05, p = 0.67). This result shows that species that most frequently co-occur within samples on the Scotian Shelf are not subdivided based on specific shared life-history traits. Rather, from a phylogenetic perspective, most groups were characterized by the presence of one gadoid, one or more flatfish, or one elasmobranch. From the perspective of a functional group, species within each of these eight groups were characterized by relatively non-overlapping trophic position. Within groups, the average range of trophic levels within groups was 0.97 (trophic levels from Froese and Pauly, 2010), whereas among groups, the average trophic level showed a much narrower range (average 3.6–4.3).
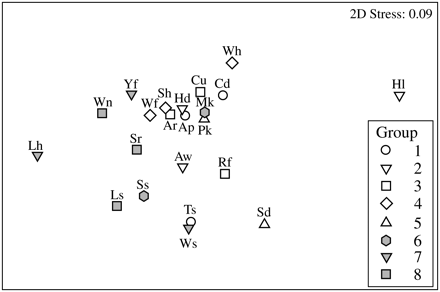
Life-history variations among 22 marine fish species identified by Mahon and Smith (1989) as consistently co-occurring within eight assemblage groups during Scotian Shelf summer trawl survey samples (1970–1981). Different symbols indicate species membership in different groups, and relative spacing among species indicates the relative similarity in life-history traits, based on 14 normalized life-history variables shown in Figure 2b. An ANOSIM test for significant differences among the eight groups could not reject the null hypothesis that among-group differences in life-history traits equalled or exceeded within-group differences in life-history traits (ANOSIM R = −0.05, p = 0.67).
Marine fish diversity among survey strata
Analyses at the level of survey strata across the Scotian Shelf revealed large-scale gradients in habitat template values. Average SG varied more than sixfold (0.12–0.74) and increased from northeast to southwest Scotian Shelf strata, peaking within Bay of Fundy strata (Figure 5). Among survey strata, ND showed a nearly threefold range (0.23–0.64), and a declining trend across the range of the same strata, in contrast to the SG (Figure 5). Among strata, there was a significant negative correlation between the average SG and the average ND (r = −0.31, p = 0.03).
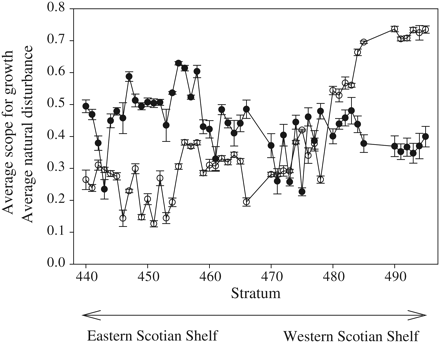
Changes in average (±s.e.) SG (open symbols) and ND (closed symbols) among 48 survey strata shown in Figure 1c, illustrating a general increase in SG from eastern to western Scotian Shelf strata and a decline in ND along the same gradient. Among survey strata, the average SG and ND are negatively correlated (r = −0.31, n = 48, p = 0.03).
Stratum-level analyses provided strong support for the template model's predictions of relative species diversity among areas characterized by different habitat template values. Average ND within 48 survey strata explains a statistically significant (r2 = 0.24, p = 0.04, n = 48) amount of variation in cumulative species richness, and species richness peaked at intermediate levels of ND (Figure 6a). There was a similar pattern of highest average species richness per sample in strata with intermediate levels of ND (r2 = 0.15, p = 0.03; results not shown). This result demonstrates that the pattern based on cumulative species richness was not driven solely by the presence of rare species. It is also notable that both these relationships between species richness and average ND explain 5–14% more variation in species richness than does strata area (r2 = 0.10, p > 0.05, n = 48; results not shown).
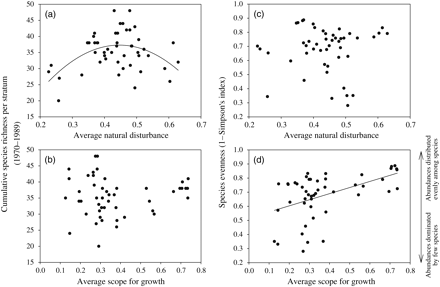
Relationships between stratum average habitat template layer values and two components of marine fish diversity. Cumulative species richness per survey strata as functions of (a) ND and (b) SG. The second-order fit to the ND data explains 24% of the variation and shows a peak at intermediate disturbance (p = 0.04, n = 48 strata), but no similar peak in species richness at intermediate levels of SG. Species evenness (1 − Simpson's index of diversity; Simpson, 1949), based on the total abundances of species within 48 survey strata, is plotted as functions of (c) average ND and (d) average SG per stratum. Only SG was positively and linearly correlated with evenness (r = 0.49, p = 0.0004).
Although the SG was unrelated to cumulative species richness among survey strata (Figure 6b), community evenness varied more than threefold and was positively and linearly related to the SG (Figure 6d), but unrelated to ND (Figure 6c). Average species richness per sample also showed a strong positive and linear relationship with the SG (r = 0.55, p < 0.0001; results not shown). The differential influences of two habitat template layers on two components of marine fish diversity also show that spatial variation in both ND and SG are required to characterize two qualitative measures of Scotian Shelf marine fish diversity (Figure 6).
Marine fish species composition and local habitat conditions
In keeping with previous validations of the habitat template model (Kostylev and Hannah, 2007), we also compared multivariate similarity matrices of marine fish species composition (Bray–Curtis similarities) with matrices of geographic distance (based on geographic coordinates), combined and individual habitat template layer values, temperature, and depth. All correlations between assemblage compositions and habitat factors were significant (p < 0.001; Table 2). During all four 5-year time blocks, geographic distances among survey samples had a higher Spearman's rank correlation with Bray–Curtis similarities among survey samples than did combined habitat template values (Table 2). However, whereas correlations between matrices of fish composition and geographic distance were relatively invariant among 5-year time blocks, correlations between matrices of fish structure and combined habitat template layer declined by 40% over time (Table 2). This pattern was reflected by the dynamics of SG alone, whereas ND alone was relatively weakly correlated with fish community structure in all periods, and relatively time-invariant (Table 2). Correlations between matrices of depth and bottom temperature with species composition were greater than either or both habitat layers, yet changed relatively little over time (Table 2).
Scotian Shelf groundfish survey samples in relation to geographic distance and metrics of local habitat conditions.
| Number of samples | Year block | Geographic distance | Habitat template (ND, SG) | ND | SG | Sample depth | Bottom temperature |
|---|---|---|---|---|---|---|---|
| 600 | 1970–1974 | 0.312 | 0.22 | 0.107 | 0.187 | 0.381 | 0.275 |
| 642 | 1975–1979 | 0.301 | 0.163 | 0.063 | 0.145 | 0.367 | 0.278 |
| 642 | 1980–1984 | 0.258 | 0.149 | 0.065 | 0.133 | 0.368 | 0.268 |
| 760 | 1985–1989 | 0.279 | 0.137 | 0.08 | 0.113 | 0.317 | 0.33 |
Within each 5-year time block, Spearman's rank correlations (rho) are provided between Bray–Curtis similarity of community composition (based on fourth-root-transformed abundance data) and geographic distance among samples, the combined template layers “template”, ND alone, SG alone, sample depth alone, and bottom-water temperature alone.
Discussion
In his review and perspective on future studies of habitat template models, Southwood (1988) recommended both providing rigorous quantification of template axes and combining field observations and information from the literature to test model predictions, and Townsend and Hildrew (1994) outlined the need for explicit tests of hypotheses. The model description of Kostylev and Hannah (2007), and initial tests using benthic invertebrate data, motivated our attempts to explain spatial patterns of Northwest Atlantic marine diversity and vulnerability from a habitat perspective. More recently, Shumchenia and King (2010) warned that habitat characterizations are rarely tested against biological data, even when the purpose of mapping is management-driven. Our analyses address these issues and extend the direct quantification of links between a marine habitat template model and life-history traits and spatially varying predictions of diversity using marine fish data. Although we found weaker links between fish life-history variability and model predictions, strong spatially varying biodiversity patterns and temporally varying relationships with the habitat template model were evident from groundfish survey data.
The trait-based framework is being revised as a means to view species occurrences and community composition, and as a general framework for predictive ecology (Webb et al., 2010). In the latter context, it is important to determine whether the habitat template acts as a predictor of species traits (Kostylev and Hannah, 2007), or as an initial filter through which a limited subset of traits will pass (Webb et al., 2010). As with fish complexes in other systems (e.g. North American freshwater and marine: Winemiller and Rose, 1992; Rhone River freshwater fish: Persat et al., 1994), dominant species from the Scotian Shelf show a range of life-history variation and may be separated into three groups based on the suite of traits (Figure 2). However, as was the case of Rhone River species (Persat et al., 1994), this trait variation did not map cleanly onto habitat template layers, because the correlations between multivariate life-history position and average ND and SG were weak or non-significant.
This lack of association could be the result of one of at least three factors, but does not obscure the clear relationships between habitat template values and patterns of marine fish diversity. First, it has been recognized that each habitat template may reflect (or be focused on) only a subset of the biota within a region (Townsend and Hildrew, 1994). Mapping preferred habitats has worked with relatively immobile species, and similar approaches have been applied to commercial species including scallops (Kostylev et al., 2003) and other invertebrates on shallow banks (Kostylev et al., 2001). Hence, Kostylev and Hannah (2007) predicted that benthic communities, being more temporally stable, might be more closely matched to benthic habitats than would mobile epibenthic or pelagic communities. For example, some dominant fish species on the Scotian Shelf occupy specific depths, whereas others tend to associate with specific temperatures (Perry and Smith, 1994).
The lack of match between life-history traits of fish and habitat template positions could also be the result of the relatively limited range of life-history variations and trade-offs among fish. Phylogenetic constraints limit the diversity of fish traits compared with benthic invertebrate communities that may have greater diversity because of the multiple phyla. This limitation has been hypothesized to constrain habitat template matches (Townsend and Hildrew, 1994) and potentially to contribute to the lack of association between habitat template layer and freshwater fish in the Rhone system (Persat et al., 1994). Expanding our analysis of species to the full list sampled across the Scotian Shelf and Bay of Fundy may have expanded the range of traits observed, but would also have resulted in larger data gaps within species, because detailed life-history data are most readily available for dominant species (Scott and Scott, 1988). Additionally, although clear life-history trade-offs are evident among species (Figure 2), Winemiller and Rose (1992) documented traits such as large size co-varying positively with the number of offspring in freshwater and marine fish, not negatively, as predicted in an r–K continuum.
Moreover, the habitat template model does not explicitly consider the effect of interspecific interactions, notably competition and predation. Therefore, our finding that life-history traits among co-occurring species showed much overlap (Figure 4), whereas the trophic levels of species showed much variation within groups, appears to support the hypothesis of Mahon and Smith (1989) that trophic differentiation may be tied to membership of co-occurring groups. In relation to the expectations of habitat template models, Southwood (1988) did suggest that the importance of species interactions should increase as both disturbance and adversity (=1/SG) decreases. As a corollary, habitats characterized by relatively high disturbance and a low SG may provide areas in which to detect the strongest direct linkages between marine habitat values and life-history traits.
Finally, the use of species average life-history traits from published data does not take into account the fact that these values may vary at small scales, and temporally. For example, annual surveys excel at quantifying the dynamics of marine fish abundance and distributional data, and life-history traits also vary in space and time (Choi et al., 2005; Hutchings and Baum, 2005; Fisher et al., 2010). Besides detailed information on all species for few traits (e.g. body size), information on additional basic life-history traits (e.g. age- and size-at-maturity, maximum age) is available for only a small subset of species (Scott and Scott, 1988). Therefore, given available data, whereas dynamic traits have been highlighted as important in the context of linking traits to habitat conditions (Webb et al., 2010) and relationships between biodiversity and ecosystem functioning (Reiss et al., 2009b), quantifying dynamic trait variation among marine fish remains a challenge in the context of evaluating life-history variation against local habitat conditions.
In a spatial context, the negative relationships between the average SG and ND among both dominant species (Figure 3) and survey strata (Figure 5) suggest that habitats and their resident species do not tend to occur in areas characterized by expected vulnerability to both overfishing and habitat disturbance (Figure 3). This is an important finding, because both template axes describe different types of vulnerability (Kostylev and Hannah, 2007). There were, however, exceptions to the general relationship among species. For example, redfish, Atlantic wolffish, and Atlantic halibut occurred consistently in habitats characterized by low values of both template values. It is notable, in the context of the life-history expectations of the habitat template model, that these species are also relatively slow-growing and late-maturing (Scott and Scott, 1988), and Atlantic populations of redfish (specifically Sebastes fasciatus) and Atlantic wolffish have been classified as Threatened and Special Concern, respectively, by the Committee on the Status of Endangered Wildlife in Canada (COSEWIC; www.cosewic.gc.ca; accessed 3 September 2010).
At a shelf-wide spatial scale, the best matches between data and model predictions were evident in patterns of marine fish diversity. Consistent with many empirical relationships and theory (e.g. Petraitis et al., 1989), ND did show a dome-shaped relationship with cumulative species richness and average species richness per tow (Figure 6a). This supports the intermediate disturbance hypothesis, where relatively low species richness can be a consequence of either few superior competitors characteristic of low disturbance environments or few species resistant to relatively high disturbance conditions (Petraitis et al., 1989). These patterns among strata also illustrate the fact that across the Scotian Shelf, there is sufficient variation in ND and species richness to generate intermediate relationships, which addresses the concern of Kostylev and Hannah (2007) that perhaps insufficient variation among habitats might drive monotonic relationships between habitat templates and diversity.
In contrast to ND, the SG was unrelated to species richness (Figure 6b), yet positively related to species evenness (relative abundance of individuals among species; Figure 6d). SG is negatively related to environmental adversity (Kostylev and Hannah, 2007). Therefore, the pattern of increased evenness among habitats with highest SG may reflect relatively few species excelling within environments where the SG is low. Similar patterns of decreased evenness have been found in naturally and experimentally induced harsh environments, including periods of early succession, nutrient addition, and other types of pollution (Tokeshi, 1993). In contrast, in comparatively benign habitats, more species and more individuals per species lead to coexistence rather than dominance. Evenness is a component of diversity that is increasingly recognized as important (Hillebrand et al., 2008), and it might affect the vulnerability to overfishing by concentrating abundance within a few species. On the Scotian Shelf, the role of relative evenness has been implicated in differential changes to marine fish assemblages. On the eastern Scotian Shelf, a few species (Atlantic cod, haddock, redfish) tend to dominate survey samples, whereas on the western Scotian Shelf, more species are required to reach the same proportion level (Shackell and Frank, 2007). Among other factors, dominance was suspected in the collapse and trophic restructuring of the eastern Scotian Shelf ecosystem (Bundy, 2005; Frank et al., 2005).
In direct comparisons between biotic and habitat data, based on benthic invertebrate data from both Sable Island Bank and across the Scotian Shelf, the habitat template model was a better predictor of similarity in species composition than was geographic distance and, within both tests, the SG was a stronger predictor of species composition (Kostylev and Hannah, 2007). Analyses of similarity among marine fish abundances revealed that habitat template values had slightly lower significant correlations with species similarity than did geographic distance, or temperature, or depth (Table 2). One potential contributor to these different patterns between marine fish and benthic invertebrates is their relative mobility. For the North Sea, Reiss et al. (2009a) reported that fish had relatively low correlation to any local habitat variables relative to bio-habitat matching with epi- and infauna. For example, temperature and depth may be regulated via movement by fish, as documented for some dominant species on the Scotian Shelf (Perry and Smith, 1994). Therefore, our finding that temperature, depth, and geographic position were more highly correlated with community composition than with the combination of habitat template layers may partly reflect mobility differences, which supports the hypothesis that relatively pelagic systems may exhibit less matching (Kostylev and Hannah, 2007).
However, in parallel to the results of Kostylev and Hannah (2007) between habitat template layers, the SG explained most of the matching of template layers to the abundance data (Table 2). Further, in contrast to relatively weak declines in correlation between geographic distance and fish assemblage structure through time, habitat template layers (and SG specifically) declined by 40% between the 1970–1974 and the 1985–1989 time blocks (Table 2). This result indicates that in a temporal context, concurrent with the escalation of a fishery (higher landings on the western Scotian shelf: Shackell and Frank 2007; collapse of the eastern Scotian Shelf groundfish in the early 1990s: Bundy 2005; Choi et al. 2005; Frank et al., 2005), the correlation between habitat template and relative abundance eroded at a faster rate than any other factor. Given this pattern, whereas geographic distance, temperature, and depth provided stronger matches to the biological data initially, in a temporal context, habitat template values (and the SG alone) appear to be a more sensitive indicator of biotic change, even for relatively mobile fish.
To conclude, our findings that the habitat template model predicted the variation in marine fish diversity yet did not yield strong matches between life-history variation and local habitats provided an integrated analysis of a complex ecosystem. These findings also provide a rationale for extending analyses of the habitat template layer to adjacent areas in an effort to quantify the fit of habitat and species diversity and to explore the influence of greater trait variation on the match between local habitats and species present. Future analyses based on extending the model to larger geographic scales should yield greater life-history variation (both within and among habitats and species), and a wider range of ND and scope-for-growth conditions. At a large spatial scale, such as the Northwest Atlantic, successful analyses of species assemblages (Mahon et al., 1998), differential ecosystem resilience to exploitation (Frank et al., 2007), and patterns of marine fish diversity and trait variation (Fisher et al., 2008, 2010) have been reported and would feed directly into evaluations of habitat template model predictions. Extending our analyses to include fish from other large marine ecosystems would contribute to the model's original objective of providing a habitat template map for the World Oceans (Kostylev and Hannah, 2007).
Supplementary material
Acknowledgements
The study was supported by the International Governance Strategy Programme of the Canadian Department of Fisheries and Oceans.
References
Author notes
Current address: Centre for Fisheries Ecosystems Research, Fisheries and Marine Institute of Memorial University of Newfoundland, PO Box 4920, St John's, Newfoundland, Canada A1C 5R3.
