-
PDF
- Split View
-
Views
-
Cite
Cite
Shovonlal Roy, Trevor Platt, Shubha Sathyendranath, Modelling the time-evolution of phytoplankton size spectra from satellite remote sensing, ICES Journal of Marine Science, Volume 68, Issue 4, March 2011, Pages 719–728, https://doi.org/10.1093/icesjms/fsq176
Close - Share Icon Share
Abstract
A dynamic size-structured model is developed for phytoplankton and nutrients in the oceanic mixed layer and applied to extract phytoplankton biomass at discrete size fractions from remotely sensed, ocean-colour data. General relationships between cell size and biophysical processes (such as sinking, grazing, and primary production) of phytoplankton were included in the model through a bottom–up approach. Time-dependent, mixed-layer depth was used as a forcing variable, and a sequential data-assimilation scheme was implemented to derive model trajectories. From a given time-series, the method produces estimates of size-structured biomass at every observation, so estimates seasonal succession of individual phytoplankton size, derived here from remote sensing for the first time. From these estimates, normalized phytoplankton biomass size spectra over a period of 9 years were calculated for one location in the North Atlantic. Further analysis demonstrated that strong relationships exist between the seasonal trends of the estimated size spectra and the mixed-layer depth, nutrient biomass, and total chlorophyll. The results contain useful information on the time-dependent biomass flux in the pelagic ecosystem.Roy, S., Platt, T., and Sathyendranath, S. 2011. Modelling the time-evolution of phytoplankton size spectra from satellite remote sensing. – ICES Journal of Marine Science, 68: 719–728.
Introduction
The phytoplankton constitutes a size-structured community of primary producers. Phytoplankton size regulates a range of biophysical activities of pelagic biota, including primary production, respiration, response to light, grazing, and energy flux in oceanic ecosystems (Platt and Denman, 1977; Silvert and Platt, 1978; Peters, 1983; Morel et al., 1993; Caparroy et al., 2000; Baird and Suthers, 2007). The stability and the biological responses of pelagic ecosystems are also related to phytoplankton size structure. However, acquiring size-resolved phytoplankton biomass data is difficult.
Satellite remotely sensed, ocean-colour data have been used to determine a range of ecological indicators of marine ecosystems (Platt and Sathyendranath, 2008). The size spectrum of the phytoplankton community is an important ecosystem indicator, but limited progress has been made in recovery of information on the size of individual cells from remote sensing. Although a few relevant size-based properties of phytoplankton, such as total absorption, can be retrieved (Platt and Sathyendranath, 2008), they provide only indirect indications of phytoplankton size. Consequently, except for a few studies (e.g. San Martin et al., 2006), both in situ and remotely sensed, only indirect procedures are available for estimating size-resolved phytoplankton biomass fractions. Size groups are generally classified as small and large, or of small, medium, and large cells (Vidussi et al., 2001; Ciotti et al., 2002; Devred et al., 2006). These large size classes are differentiated either from the light-absorption properties of phytoplankton (Hirata et al., 2008) or from pigment characteristics (Vidussi et al., 2001). In the latter case, a set of characteristic pigments is used to diagnose taxonomically different functional groups (Vidussi et al., 2001; Ciotti et al., 2002). However, currently just seven diagnostic pigments are used (Vidussi et al., 2001; Hirata et al., 2008), and the approach cannot resolve the size of individual cells.
Here we propose and implement a method to explore the evolution over time of biomass fractions of individually sized phytoplankton from a remotely sensed chlorophyll series, and develop a dynamic model on a discrete time-scale (resolution 1 d) to describe the time-evolution of different sizes of phytoplankton in the community. The modulation of the oceanic mixed-depth layer accounts for the nutrient supply to the mixed layer and the individual phytoplankton organisms contribute to total primary production according to their cell size. Interaction parameters are based on the theoretical dependence of ecosystem processes on phytoplankton size. We also “borrow” a sequence of mixed-layer depths from a biogeochemical model and a remotely sensed chlorophyll time-series corresponding to the location of interest, and possible size-resolved phytoplankton biomass information is estimated using a sequential data-assimilation technique. The primary goals of this approach are to address the questions below. We also describe the methodology in detail, including the acquisition of satellite time-series, the model's equations and its parametrization, and the sequential data-assimilation protocol used. Finally, the results of the simulations are demonstrated, and their significance in connection with the questions above is discussed.
Can a time-series of biomass fractions be extracted from remotely sensed, ocean-colour data for individual sizes of phytoplankton? Equivalently, can the time-series of phytoplankton size spectra that corresponds to the remotely sensed chlorophyll series be estimated?
Is there any direct correspondence between the succession of estimated bulk size classes and that of estimated taxonomic groups (such as diatoms and cyanobacteria)?
Is there any correspondence between the seasonal trend in the estimated phytoplankton size spectrum and trends in mixed-layer depth, nutrient biomass, and total chlorophyll?
Material and methods
Phytoplankton time-series from remote sensing
A time-series of chlorophyll biomass for the period from 1 January 1998 to 31 December 2006 was acquired as the spatial average of a 2 × 2° box in the North Atlantic at 40–42°N 52–54°W. The data were obtained by the Sea-viewing Wide Field-of-view Sensor (SeaWiFS), and were extracted from the GES–DISC Interactive Online Visualization and Analysis Infrastructure (Giovanni) programme, part of NASA's Goddard Earth Sciences (GES) Data and Information Services Center (DISC). Expected daily estimates of nitrate concentrations and mixed-layer depths, averaged over the same box, were obtained from NASA's Ocean Bio-geochemical Model (NOBM; Gregg, 2008). Chlorophyll, nitrate, and mixed-layer depth were then used as inputs to the data-assimilation algorithm. The approach can be adapted for any area and phytoplankton time-series.
A dynamic model for size-structured phytoplankton
 on day t consist of r different sizes of phytoplankton with diameters di, i= 1, 2, … , r, and let the component biomasses be given by
  , so that
 with concentration of nitrate (Nt) in the surface mixed layer. The model is an extension of the single-species model of phytoplankton–nutrient interaction in the mixed layer originally developed by Platt et al. (2003a). The basic model is modified to include phytoplankton loss attributable to grazing, and extended to a multicomponent model by incorporating size-resolved interaction parameters. The model is expressed by the following set of difference equations:
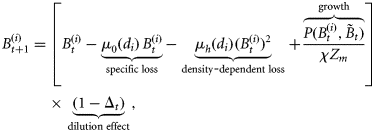
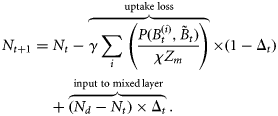
 is the biomass of phytoplankton i with cell diameter di on day t. Total mortality of phytoplankton i is a combination of size-dependent specific loss, μ0 (di), and the loss associated with predation, μh (di). The term
  represents primary production on day t by biomass
  as a part of the total biomass
  ; adapting the equation from Platt and Sathyendranath (1993), it can be written in the following functional form:

 is a known dimensionless function of the normalized irradiance
  at local noon, evaluated under the assumption of vertically uniform biomass and spectral independence. Its explicit form is taken from Platt and Sathyendranath (1993). The magnitude of the normalized irradiance is given by
  , where
  is the surface irradiance at local noon (which depends on latitude and time of year), and
  is the maximum specific production of the total biomass
  at saturating light. The quantity
  is the size-dependent initial slope of the production–irradiance curve, whose value is proportional to
  , where
  is the size-dependent, specific-absorption coefficient corresponding to phytoplankton i, and ϕm the maximum quantum yield. The quantities χ and ϕm are assumed to be independent of size because, although their magnitudes vary for different types of phytoplankton, no specific functional relationship between χ and cell size or between ϕm and cell size is known.
 . If r= 1, i.e. the population consists of a single size class, and if there is no effect of predation, i.e. the third term in Equation (2) is absent, the current model reduces to the size-independent, single-species model proposed and analysed by Platt et al. (2003a). The dynamic behaviour of the current model based on fixed-point analysis (which is outside the scope of this paper) will be reported elsewhere.
Model parametrization
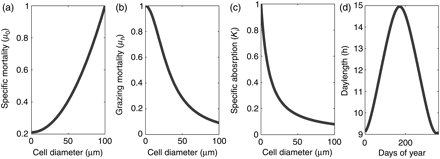
The parameters μ0(di), μh(di), and  were determined by individual phytoplankton size. The size-dependent relationships were characterized by known functions of diameter based on the literature (Morel and Bricaud, 1981; Jiang et al., 2005). A graphic representation of the size dependencies of these properties is given in Figure 1. Three other size-independent parameters, χ, ϕm, and
  , were specified from the literature. No temporal variations of the parameters were assumed, and from their respective ranges of values given in the literature (Platt et al., 2003b; Edwards et al., 2004), their magnitudes were generated by Monte Carlo sampling. The daylength on any day of the year for the selected latitude was calculated using Spencer's formulae (Spencer, 1971). The expected time-series of daily mixed-layer depth Zm for the area (Figure 2a) was taken from NOBM (Gregg, 2002); from that series, several ensemble series for Zm were generated by Monte Carlo sampling. The ensemble values of ϕm and the calculated magnitude of
  for any day were used to calculate
  . The expected time-series of nutrient concentration was also taken from NOBM, and the ensembles generated by Monte Carlo sampling. A detailed description of the parameters and their numerical ranges is provided in Table 1.
Parameters and their values.
| Notation . | Description . | Value/source . |
|---|---|---|
| μ0(di) | Size-dependent specific loss | Figure 1a |
| μh(di) | Density-dependent loss | Figure 1b |
 | Size-dependent specific absorption | Figure 1c |
| Dt | Latitude-dependent daylength | Figure 1d |
 | Light-saturated primary production | 3–8 mg C (mg Chl)−1 h−1 |
| χ | Carbon-to-chlorophyll ratio | 75–125 |
| aw | Light attenuation by water | 0.046 m−1 |
| γ | Nitrogen-to-chlorophyll ratio | 8.8 mg N (mg Chl)−1 |
| ϕm | Quantum yield | 0.008–0.02 mol C (mol photon)−1 |
| Notation . | Description . | Value/source . |
|---|---|---|
| μ0(di) | Size-dependent specific loss | Figure 1a |
| μh(di) | Density-dependent loss | Figure 1b |
 | Size-dependent specific absorption | Figure 1c |
| Dt | Latitude-dependent daylength | Figure 1d |
 | Light-saturated primary production | 3–8 mg C (mg Chl)−1 h−1 |
| χ | Carbon-to-chlorophyll ratio | 75–125 |
| aw | Light attenuation by water | 0.046 m−1 |
| γ | Nitrogen-to-chlorophyll ratio | 8.8 mg N (mg Chl)−1 |
| ϕm | Quantum yield | 0.008–0.02 mol C (mol photon)−1 |
Parameters and their values.
| Notation . | Description . | Value/source . |
|---|---|---|
| μ0(di) | Size-dependent specific loss | Figure 1a |
| μh(di) | Density-dependent loss | Figure 1b |
 | Size-dependent specific absorption | Figure 1c |
| Dt | Latitude-dependent daylength | Figure 1d |
 | Light-saturated primary production | 3–8 mg C (mg Chl)−1 h−1 |
| χ | Carbon-to-chlorophyll ratio | 75–125 |
| aw | Light attenuation by water | 0.046 m−1 |
| γ | Nitrogen-to-chlorophyll ratio | 8.8 mg N (mg Chl)−1 |
| ϕm | Quantum yield | 0.008–0.02 mol C (mol photon)−1 |
| Notation . | Description . | Value/source . |
|---|---|---|
| μ0(di) | Size-dependent specific loss | Figure 1a |
| μh(di) | Density-dependent loss | Figure 1b |
 | Size-dependent specific absorption | Figure 1c |
| Dt | Latitude-dependent daylength | Figure 1d |
 | Light-saturated primary production | 3–8 mg C (mg Chl)−1 h−1 |
| χ | Carbon-to-chlorophyll ratio | 75–125 |
| aw | Light attenuation by water | 0.046 m−1 |
| γ | Nitrogen-to-chlorophyll ratio | 8.8 mg N (mg Chl)−1 |
| ϕm | Quantum yield | 0.008–0.02 mol C (mol photon)−1 |
Size dependence of model parameters from the literature. Size-dependent (a) specific mortality μ0, (b) grazing mortality μh, and (c) specific absorption at λ = 676 drawn against cell diameters, with references given in text. (d) Daylength for the study area is calculated based on latitude following Spencer's formulae.
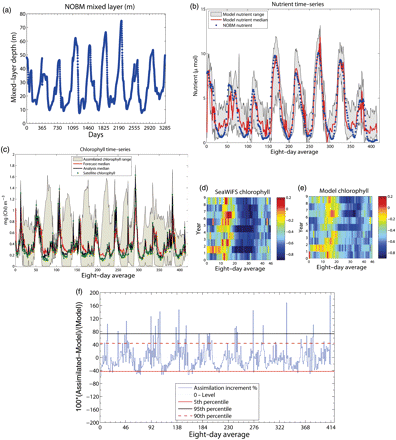
Model outcomes and satellite observations for the period 1 January 1998 to 31 December 2006. (a) Daily mixed-layer depth taken from NOBM; (b) nutrient time-series (8-d average) obtained from NOBM and generated through assimilation by the model; (c) chlorophyll time-series (8-d average) obtained from model predictions before state correction, with the model outcome after state correction, the ranges assimilating chlorophyll and satellite chlorophyll. Seasonal patterns of (d) SeaWiFS chlorophyll, and (e) the ensemble median of the model chlorophyll—plotted are the logarithmic values of the respective concentrations. (f) A plot of the time-varying assimilation increment given as a percentage: the increment values above and below the zero level represent the positive and the negative increments, respectively; the 5th, 90th, and 95th quantile values of the assimilation increment are displayed as horizontal lines.
Data assimilation
 ) at any assimilation step τ consisted of the biomass of r size classes of phytoplankton and the concentration of nutrients:
  . The assimilation step was taken as τ= 8 d, and the 8-d averages of the satellite chlorophyll series
  and the NOBM nutrient series
  were considered as the observed states given by the observation vector:
  . At every time-point, a set of observation ensembles
  , j= 1, 2, … , L was generated by introducing random noise to yτ:
 was drawn from a normal distribution with zero mean and covariance
  . Similarly, the initial ensemble of the state variable xτ and the ensemble values of the model parameters were generated: χ, ϕm,
  , and
, and  . Note that, except
  , all other parameters were assumed to be time-invariant, so that corresponding to each of these, only one set of ensemble values was generated at the start, then used for the entire assimilation. With this method, at each assimilation step, a range of ensemble observations from one observation value was generated corresponding to each value of chlorophyll, nutrient, and mixed-layer depth.
 representing the parameter ensembles. The forecast from step τ to τ + 1 was obtained by taking the average of state variables of the model run over 8 d. The state-ensemble forecasts of the model were then updated according to the Kalman filter equation (Evensen, 2006) as
 the Kalman gain for correcting the state trajectories given by Evensen (2006):
 and
and  represent the cross-covariance between state ensembles and prediction ensembles, and the forecast-error covariance, respectively.
The assimilated states of the model obtained at the analysis step included the nutrient concentration and components of biomass in various size classes. Therefore, an output of the assimilation experiment included estimates of time-series (8-d average) of chlorophyll biomass partitioned into sizes of individual cells. The state estimates were obtained as ensembles  , and from them their median values and possible ranges were retrieved over the observed time-points. A set of nine size classes was considered, with cell diameters ranging from 0.45 to 40 μm, whereby the cell diameters varied by two orders of magnitude. We experimented with different numbers of ensemble members (i.e. L), starting from a small value and fixed L= 2000, one order higher than the minimum value of L, for which the results were independent of the ensemble size.
Although satellite observations were obtained in every 8-d interval, observations were unavailable for a few time-points because of cloud cover. In the sequential state correction adopted here, these were considered as missing data, and correspondingly no state corrections were made in the data-assimilation process.
Results and discussion
Model simulation and data assimilation were carried out for a period of 9 years, from 1 January 1998 to 31 December 2006. The outputs, along with the observations, were used to investigate the interplay between the time-evolved variables and the succession of the size-structured population.
Time-evolution of chlorophyll and nutrients
The assimilation process produces time-series for nutrient concentration and chlorophyll biomass. The nutrient series produced after assimilation is similar to NOBM nutrients (Figure 2b). The ensemble medians of the nutrient series obtained from the model simulation follow systematically the seasonality of the nutrient level, and the range of dispersion of this series is consistent with the NOBM nutrients (Figure 2b). The 8-d average chlorophyll generated by ensemble trajectories of the model is similar to the observed chlorophyll (Figure 2c). The median values of the model ensembles closely follow the fluctuations and seasonal pattern for blooms observed in SeaWiFS chlorophyll (Figure 2c). The ranges of ensemble predictions envelope fluctuation levels of the satellite chlorophyll and the medians of these distributions are close to the observations throughout (Figure 2c).
However, on a common biomass scale, the model outputs, before the state-correction step of assimilation, slightly underestimate the chlorophyll values observed during high peaks or in spring, and slightly overestimate them during low biomass or in summer (Figure 2c–e). In other words, the model propagation errors for the two extreme ends of the biomass level are opposite in sign. This is an indication that the model propagates in the same phase as the observations and that the high peak heights and low minimum values are achievable through the “state-correction” step of assimilation. Consequently, the chlorophyll series produced after assimilation closely resembles the seasonal trend and peaks and valleys of the satellite time-series (Figure 2c). The increments (positive or negative) in chlorophyll biomass (in percentages) obtained from the model by assimilation of the satellite chlorophyll (Figure 2f) are calculated as (assimilated value – model value)/(model value). For some 80% of the observations, the assimilation increments in the model output are within a level of ±38% (Figure 2f). Moreover, for >90% of the observations, the same are within a level of ±50% (note that the possible error in satellite chlorophyll is ±35%).
Therefore, the observed total chlorophyll and NOBM nutrient series are reproduced through data assimilation by the size-resolved model. As the sequence of total assimilated chlorophyll reproduces the total observed chlorophyll, the multiclass model yields size-resolved biomass sequences corresponding to a discrete set of pre-assigned cell sizes. For the chosen location in the North Atlantic, we used the corresponding size-resolved chlorophyll series, obtained from the model, to calculate phytoplankton size spectrum.
Time-evolution of the phytoplankton size spectrum

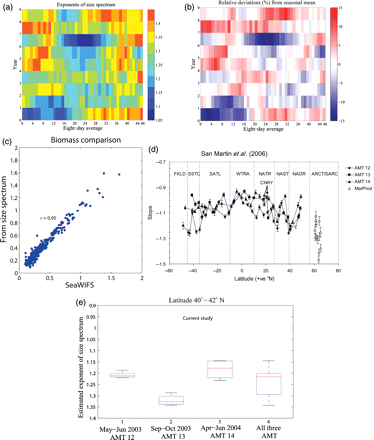
At every time-point, the parameters a and b of Equation (9) were estimated from the size-resolved biomasses by linear regression. The biomasses corresponding to various size classes do not deviate significantly from the regression lines representing the size spectrum (i.e. the linear fittings by regression were statistically significant, with r2 > 0.95 at every time-point). Consequently, the total predicted biomass, calculated as the sum of biomasses obtained from the estimated exponents using Equation (9), corresponds remarkably well with SeaWiFS chlorophyll (Figure 3c). We therefore obtained a time-series of the size exponents derived from partitioning the total biomass, which itself was derived from the ocean-colour observations (Figure 3a).
Time-evolution of phytoplankton size spectrum. (a) The exponent of size spectrum calculated using model results, with annual variation presented against 8-d averages. (b) Temporal deviations of the size-spectrum exponent over the observed years presented as a percentage. (c) Comparison of total biomass calculated using the estimated size spectrum and values from SeaWiFS. (d) The latitudinal pattern of the slopes of the normalized biomass spectrum in the Atlantic; the figure is taken from San Martin et al. (2006). (e) Box plots representing the estimated size-spectrum exponents at the time of AMT-12, AMT-13, AMT-14, and MarProd cruises; for each box, the central mark is the median, the edges are the 25th and 75th percentiles, and the whiskers represent the most extreme values.
The 8-d time-series of the size-spectrum exponent for a period of 9 years varied in the range 1.05–1.50 and revealed strong seasonality in each year (Figure 3a). However, the magnitudes of the exponents varied over time every year, representing temporal fluctuations of size-structured diversity of phytoplankton biomass. For a given time of year, the size-spectrum exponents varied by ±15% from the corresponding average value (Figure 3b).
Based on data collected by Atlantic Meridional Transect (AMT) cruises and a Marine Productivity (MarProd) cruise, San Martin et al. (2006) calculated the size-spectrum exponents of plankton (using the FlowCAM instrument) over the Atlantic Ocean. The size-spectrum exponents ranged from 0.93 to 1.46 during 2003 and 2004 [Figure 3d taken from San Martin et al. (2006) for comparison with our results]. Most values of the size-spectrum exponent estimated by our method from satellite chlorophyll over the years 1998–2006 (Figure 3a) were in the range reported by San Martin et al. (2006), who calculated the exponents from AMT-12, AMT-13, AMT-14, and MarProd cruises during 2003 and 2004 for locations near 40°N. For close comparison, we derived from our estimated series the size-spectrum exponents for those observation points that matched the timing of the four cruises. The four sets of estimated values are presented separately and together in Figure 3e. These plots indicate that the magnitudes of the size-spectrum exponents estimated here from satellite observations are similar to those calculated previously from the four cruises (Figure 3d and e).
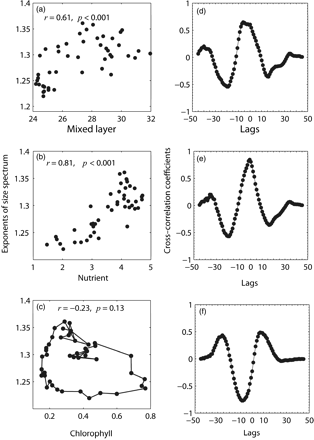
Along with satellite chlorophyll, NOBM mixed-layer depth, and NOBM nutrients, we now have estimates of the time-varying, size-spectrum exponent with an 8-d resolution for the period 1998–2006. From these time-series, for each of the four quantities, a seasonal mean (climatology) with a resolution of 8 d was generated, which represents the mean of the corresponding quantity for that 8-d time of year over the 9 years. The data reveal strong interplay between the seasonal variations of the size-spectrum exponent and those of the mixed-layer depth, nutrient series, and chlorophyll series. The seasonal mean values of size-spectrum exponents are positively correlated with those of mixed-layer depth (r= 0.61, p< 0.001; Figure 4a). Cross-correlation analysis between these two seasonal mean time-series confirmed this significant correlation; the cross-correlations peak near the zero lag (Figure 4d). A similar result was obtained for seasonal mean values of the NOBM nutrient series and those of size-spectrum exponents: a significant positive correlation (r= 0.81, p< 0.001; Figure 4b), and a cross-correlation peak at zero lag (Figure 4e). These results suggest that the time-evolution of seasonal average of the phytoplankton size spectrum is influenced significantly by the mixed-layer depth and nutrient concentrations. Further, the influences in both cases being positive, either a deeper mixed layer or a higher nutrient availability would increase the seasonally averaged slope of the size spectrum.
Correlation between the seasonal means of the size-spectrum exponent and those of mixed-layer depth, NOBM nutrients, and satellite chlorophyll. The Pearson correlation between the seasonal means of the exponent of size spectrum and those of (a) mixed-layer depth, (b) NOBM nutrients, and (c) SeaWiFS chlorophyll. Cross-correlation coefficients (over entire lags) between the seasonal mean series of size-spectrum exponents and those of (d) mixed-layer depth, (e) NOBM nutrient, and (f) SeaWiFS chlorophyll.
Conversely, the relationship between the seasonal mean of total chlorophyll and those of the size-spectrum exponents is not straightforward. First, there is no significant simple correlation (e.g. Pearson) between these variables (Figure 4c). Moreover, there is no cross-correlation peak at zero lag; in fact, there is a cross-correlation minimum not far from the zero lag (Figure 4f). The seasonal means of the size-spectrum exponent are significantly influenced by the seasonal means of chlorophyll appearing at a fixed time interval (Figure 4f; around a lag of 20, two correlation peaks appear almost symmetrically). These cross-correlations suggest that the seasonally averaged series of size-spectrum exponents depends on the history of the seasonally averaged chlorophyll series, and that these two time-series propagate in opposite phases such that the high peaks of seasonal chlorophyll correspond to the low-value, size-spectrum exponents, and vice versa. The seasonal average of these two variables, when plotted as a continuous series in the phase plane, demonstrated a clear cyclic relationship (Figure 4c, connected dots). This cycle represents the seasonal succession of chlorophyll biomass and the size-spectrum exponent, such that the two time-varying quantities evolve in opposite phases.
Similar phase differences in time-series and cyclic relationships in phase plane are typical properties of classical predator–prey relationships, where the biomass of the predator regulates that of the prey, and vice versa. A cyclic predator–prey-like relationship between chlorophyll and the size-spectrum exponent (Figure 4c) therefore represents the mutual regulation of the total biomass and the slope of the size spectrum over time. Moreover, because of its cyclic relationship with total biomass, the slope of the normalized phytoplankton biomass spectrum is likely to vary over a maximum range at an intermediate level of total chlorophyll, resulting in a largely uneven distribution of biomass among different size classes.
Phytoplankton size succession
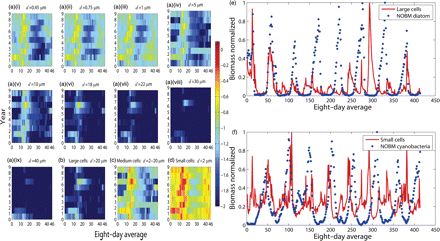
The 8-d average biomass series of individual sizes depicted succession patterns of phytoplankton size over time. Different phytoplankton sizes dominated at different times of year, and the timing of phytoplankton blooms of a given size may not be predictable [Figure 5a(i)–a(ix)]. This result is consistent with theoretical and empirical understanding of phytoplankton succession (Tilman, 1982).
Seasonal succession of size-structured phytoplankton as estimated by the model. The cell diameters range from 0.45 to 40 μm. The biomass series corresponding to each size is extracted from the satellite chlorophyll information by implementing data assimilation using the size-structured model mentioned in text. a(i)–a(ix) Log-transformed 8-d averages of biomass for each size are plotted against every year over the period 1998–2006. Logarithmic time-series of size groups are classified as (b) large (d> 20), (c) medium (2 ≤d≤20), and (d) small (d< 2.0) cells. Seasonal succession of biomass normalized to respective maximum values for (e) large cells and NOBM diatoms, and (f) small cells and NOBM cyanobacteria.
The individual size biomass can be pooled to obtain the biomass sequence of size groups classified as large (e.g. micro d> 20.0 μm), medium (e.g. nano 2.0 ≤d≤20 μm), and small (e.g. pico d< 2.0 μm) cells; these series depict fluctuations and seasonal successions of the large, medium, and small cells (Figure 5b–d). The biomass of small cells generally appeared high compared with those of large or medium cells. However, the seasonal pattern of large and medium cells was quite different from those of small cells (Figures 5b–d); compared with the large and medium cells, the small cells appeared to dominate towards winter (Figure 5b–d).
For the period of observation, the expected biomass of diatoms and cyanobacteria were obtained from the NOBM. Although the timings of peaks of neither NOBM diatom and estimated large cells, nor NOBM cyanobacteria and estimated small cells, appeared to match accurately (Figure 5e and f), the correspondence between peak timings for the latter pair was reasonable, and appeared to be better than the former (Figure 5e and f). One reason for this could be that small cells are probably dominated by cyanobacteria in the study area, but that large or medium cells are unlikely to be dominated only by diatoms. The diatom biomass obtained from NOBM was low in a significant number of observed points (Figure 5e), but the estimated biomass of either large or medium cells fluctuated (Figure 5b–d); the high diatom biomasses may correspond either to large or medium cells (Figure 5b, c, and e).
In this context, it is worth noting that phytoplankton sizes vary within taxonomic groups and that these variations are relatively prominent for large phytoplankton (Gaskin, 1979; Totti et al., 2005; Litchman et al., 2009). In particular, diatom sizes are highly variable, both seasonally and spatially (Marchetti and Cassar, 2009). Recent studies also suggest that their sizes may vary over evolutionary time-scales (Finkel et al., 2005; Litchman et al., 2009). Therefore, although taxonomically different groups of phytoplankton predicted by biogeochemical models (here, NOBM) may exhibit relatively regular seasonal patterns, the seasonal distributions of strictly size-resolved groups are likely to be somewhat irregular (Figure 5). Moreover, the series of estimated size groups and that of taxonomically resolved species groups (obtained from NOBM) may not always be similar (Figure 5e and f).
Concluding remarks
We have presented an adaptable method to facilitate understanding of some key properties of marine phytoplankton biomass. Given an input of mixed-layer depth from physical models and a series of chlorophyll biomass values from satellite observations, time-series of the biomass fractions of individual sizes can be derived and considerable insight into phytoplankton size-structure dynamics obtained.
Generally, bulk groupings of phytoplankton size structure, i.e. pico-, nano-, and microplankton, are used in oceanographic studies (Vidussi et al., 2001; Ciotti et al., 2002; Hirata et al., 2008). However, the seasonal evolution of individual size is an important property in marine ecosystems. For example, during massive blooms, phytoplankton communities are generally dominated by one or two types of phytoplankton, such that the individual size diversity reduces significantly. The estimates of size-structured biomass at every observation time represent the pattern of seasonal succession of individual sizes, so carry information about size diversity. Estimates of the size-resolved biomass were also used to retrieve an important property of size structure, namely the size-spectrum exponent; the time-evolution of this property carries important information about the biomass flux over an ecological time-scale. The analysis revealed significant interplay between the seasonal variations of the estimated size-spectrum exponent and those of both mixed-layer depth and nutrient concentration. However, the seasonal variations of the exponent had a complex, cyclic relationship with those of satellite chlorophyll, similar to typical predator–prey oscillations. These time-series associations are useful for understanding, and hence predicting, the time-evolution of the size fractions of remotely sensed phytoplankton biomass, which in turn is applicable to studies of the productivity and functioning of pelagic ecosystems. For example, given that size-selective predation is common in ecosystems, knowledge of the size structure of phytoplankton biomass can further understanding of temporal variations at higher trophic levels.
Although some biogeochemical models can produce estimates of phytoplankton size groups based on taxonomy (e.g. Gregg, 2008), the approach here differentiates individual sizes at low computational cost. Although the taxonomic approach provides information on phytoplankton taxonomic composition, the method used here is more likely to resolve size-based properties. This is particularly important, because the average size of taxonomic groups such as diatoms may change over time (Finkel et al., 2005; Litchman et al., 2009). The time-series of size classes obtained with the approach described here and the taxonomic groups obtained from a biogeochemical model may differ, and the discrepancy is prominent for large phytoplankton. However, the two pieces of independent information, both derived from satellite remote sensing, may provide insight into the formation and characterization of phytoplankton blooms in a given area.
The current method may be improved further in several ways. For example, the biomasses of individual sizes were not compared with independent biomass data to establish reliability. Moreover, the size-spectrum exponent could be improved by extracting the biomasses of bulk size classes using other methods (Vidussi et al., 2001; Hirata et al., 2008) and including them in the data-assimilation step. Finally, direct estimation of mixed-layer depth and nutrient concentration may also improve the model output.
Acknowledgements
The work was supported by the Canadian Space Agency and the Natural Sciences and Engineering Research Council of Canada. It is also a contribution to the NCEO and Oceans 2025 programmes of the Natural Environment Research Council (UK). SR acknowledges an academic post-doctoral fellowship from Dalhousie University. We also thank two reviewers for valuable comments.


