-
PDF
- Split View
-
Views
-
Cite
Cite
A. L. Rosa, J. Yamamoto, Y. Sakurai, Effects of environmental variability on the spawning areas, catch, and recruitment of the Japanese common squid, Todarodes pacificus (Cephalopoda: Ommastrephidae), from the 1970s to the 2000s, ICES Journal of Marine Science, Volume 68, Issue 6, July 2011, Pages 1114–1121, https://doi.org/10.1093/icesjms/fsr037
Close - Share Icon Share
Abstract
The Japanese common squid, Todarodes pacificus, is one of the most commercially valuable squids in the world. It spawns almost throughout the year, with a seasonal peak in autumn and winter. Long-term changes in sea surface temperature (SST) and its effect on the spawning areas and catch of T. pacificus were analysed for 27 spawning seasons (September–April 1978–2006) in the Sea of Japan and East China Sea. The spawning area was inferred between the limits of 21–41°N and 121°–142°E, 100–500-m depth, the mean Kuroshio axis, and the 19.5–23°C SST range. The results revealed that the area surrounding Kyushu Island is gaining importance as a spawning area. In addition, the discontinuity of the spawning ground in the East China Sea (around 29°N 128°E) during the winter spawning period was demonstrated to be associated with a decrease in the catches by both the Japanese and the Korean fleets. This constriction of the spawning ground would act as an obstacle to either the adult squid, making it difficult for them to reach the most southern grounds, or the paralarvae and juveniles, which, because of adverse environmental conditions, might not be able to survive the early stages of the feeding migration.Rosa, A. L., Yamamoto, J., and Sakurai, Y. 2011. Effects of environmental variability on the spawning areas, catch, and recruitment of the Japanese common squid, Todarodes pacificus (Cephalopoda: Ommastrephidae), from the 1970s to the 2000s. – ICES Journal of Marine Science, 68: 1114–1121.
Introduction
The Japanese common squid, Todarodes pacificus (Cephalopoda: Ommastrephidae), is distributed in the northwest Pacific between 25 and 50°N, near Japan, the Korean Peninsula, and Russia. It is targeted by both Japanese and Korean fleets, and catch data are available since the early 1900s from Japan and since the late 1930s from Korea (Murata, 1989). These data reveal that the Japanese catch is bigger than the Korean one, except for the period after the late 1980s.
Apart from the interannual variation, catches of T. pacificus display a long-term variability, with smaller catches (<200 × 103 t) until the late 1940s, followed by periods of bigger (early 1950s until late 1970s and from early 1990s on) and smaller catches (late 1970s until early 1990s). This pattern of variation has been related both to overfishing (Murata, 1989) and to regime shifts in the North Pacific (Sakurai et al., 2000). This correspondence between catch or stock size and the North Pacific regime shifts has also been observed for other squid species, e.g. spear squid Loligo bleekeri (Tian, 2009).
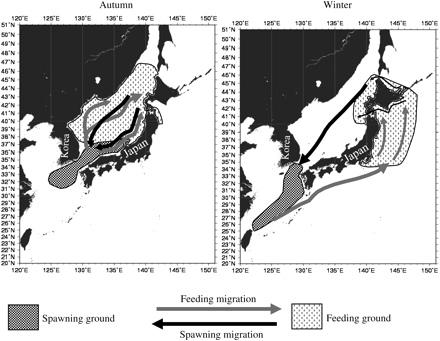
The Japanese common squid stock comprises three cohorts based on the spawning period: summer, autumn, and winter. The last two cohorts, especially the winter cohort, make up most of the stock's biomass (Murata, 1989; Kawabata et al., 2006). As with the red (or neon) flying squid (Ommastrephes bartramii; Ichii et al., 2004), the different cohorts have different spawning areas, with the autumn cohort spawning in a more northern area than the winter cohort. Eggs of the autumn cohort are spawned between September and December in the Tsushima Strait and in the Sea of Japan off southern Honshu Island (Goto, 2002; Yamamoto et al., 2002; see Figure 1). The hatchlings are then transported north by the Tsushima Warm Current (Okutani, 1983; Goto, 2002). They reach Hokkaido by winter, where they remain until returning to the spawning ground along the same route.
Schematic migration pattern of the T. pacificus autumn and winter cohort. Figure adapted from Murata (1989) and Sakurai et al. (2000).
The winter cohort spawns mainly in the East China Sea from Kyushu to Taiwan (Figure 1) from January to April (Hatanaka et al., 1985; Murata, 1989; Sakurai et al., 2000). The main migration route of the hatchlings is the Pacific Ocean along the Japanese islands via the Kuroshio Current. Some hatchlings are also transported to the Sea of Japan and the east coast of the Korean Peninsula (Hatanaka et al., 1985). Juveniles migrate north to the feeding grounds around Hokkaido and between the end of summer and the beginning of autumn, the squid return to the spawning grounds via the Sea of Japan (Bower et al., 1999; Kawabata et al., 2006; Kidokoro and Sakurai, 2008).
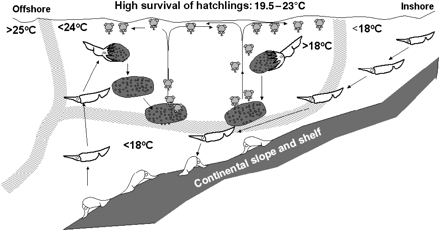
By combining the results from larval surveys and captivity experiments, Sakurai et al. (2000) proposed the following reproduction process, which is summarized in Figure 2. After resting on the seabed, adult females ascend and spawn. The spawned egg masses sink until they reach a neutrally buoyant depth. Once hatched, the hatchlings (mantle length <1 mm) swim towards the surface, being abundant in the surface and mixed layer (Yamamoto et al., 2007). This depth range allows the hatchlings to maintain a higher swimming activity, as well as providing a better feeding environment (Yamamoto et al., 2007) and transport by the currents to the feeding grounds. Laboratory experiments have demonstrated that hatchling survival rates are highest at 19.5–23°C (Sakurai, 2006).
Reproductive hypothesis for the Japanese common squid, T. pacificus, initially proposed by Sakurai et al. (2000) and complemented by Sakurai (2006). Figure adapted from Sakurai (2006).
Larval surveys can be used to estimate the stock's status (Kidokoro, 2010), but they require substantial investments of money, energy, and time. Advances in remote-sensing technology have improved data resolution and quality, allowing for detailed fisheries oceanography studies; for example, the Japanese scallop in Funka Bay, Japan (Radiata et al., 2008). Sea surface temperature (SST) is one of the easiest physical parameters to measure and its distribution has been related, either directly or indirectly, to the life cycle and fisheries of many cephalopods (Robin and Dennis, 1999; Yatsu et al., 2000; Arkhipkin et al., 2004; Ichii et al., 2004).
The purpose of this study was to investigate the relationship between environmental variability and the T. pacificus spawning grounds of the autumn and winter cohorts from the 1970s to the early 2000s. The size and distribution of the inferred spawning area were used to analyse the variation in commercial catch; then, an explanation for the variation in recruitment and consequently catch of the winter cohort is proposed.
Data and methodology
The inferred spawning area (hereafter referred to as the spawning area) was calculated using non-variable and variable parameters. To account for autumn and winter cohorts, the geographic limits for the spawning area were set at 21 and 40°N and at 121 and 142°E. Bower and Sakurai (1996) reported that in captivity, the females rest on the bottom of the tank before spawning. In addition, studies using bottom trawls revealed that fully ripe and spent females often aggregate in shelf and slope areas (Hamabe and Shimizu, 1966; Yamada, 1998). Considering this, and based on Sakurai et al. (2000), a depth limitation to the spawning area was imposed. For this study, spawning was considered to occur in areas with depths between 100 and 500 m.
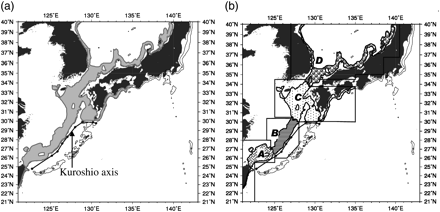
Previous studies (Bower et al., 1999) have demonstrated that hatchlings are found in higher density in areas west of the Kuroshio axis and that larger paralarvae are caught near the Kuroshio Front. Hence, to analyse the area where spawning is most likely, the Kuroshio axis was also considered as limiting the spawning area distribution, although the Kuroshio has a slightly different flow pattern from year to year. For this study, the location of the axis was considered as its mean position indicated by Yamashiro et al. (1993). However, considering its deviation from the mean and seasonal variability over the 100–500-m depth area, the location of the mean axis described by Yamashiro et al. (1993) will only influence the spawning area south of Kyushu Island (Figure 3a).
Features of the study area. (a) Total inferred spawning ground (grey area); (b) four subareas used in the study. Also plotted is the mean Kuroshio axis location based on Yamashiro et al. (1993).
Finally, the spawning area was defined to be where the SST ranged between 19.5 and 23°C. This range was based on laboratory experiments, which have demonstrated greater survival rates of hatchlings within this range (Sakurai, 2006). SST data were obtained from the Japan Meteorological Agency; they comprised grid data with 1° × 1° resolution during 1970–1984 and MGDSST (Merged satellite and in situ data Global Daily Sea Surface Temperature) of 0.25° × 0.25° resolution during 1985–2006. The MGDSST data are derived from satellite infrared sensors (AVHRR/NOAA), microwave sensors (AMSR-E/AQUA), and in situ SST (buoy and ship). In summary, the spawning area was inferred as the area where three non-variable parameters, 21–40°N 121–142°E, the 100–500-m depth, and the mean Kuroshio axis, and one variable parameter, the 19.5–23°C SST range, were superimposed. It was calculated monthly for January 1970–December 2006, a total of 444 months.
The spawning area considered in this study includes a wide geographic area, consisting of the Sea of Japan, Tsushima Strait, and East China Sea. The total spawning area was divided into four subareas, A–D (Figure 3b). Subarea D represented the spawning area in the Sea of Japan (including the northern part of the Tsushima Strait), and Subarea C the area surrounding Kyushu Island (including the southern part of the Tsushima strait, which is a potential spawning area for both the autumn and the winter cohorts). Subarea B represented the central part of the East China Sea, and Subarea A was the southernmost part of our study area. The size of these subareas was analysed both individually and in combination (C + D for the autumn cohort and A + B and A + B + C for the winter cohort). Based on the definitions described above, the spawning area was plotted monthly on SST maps, and its distribution was analysed. From these plots, two patterns of the winter spawning area distributions were observed and their influence on the catch was analysed using Kruskal–Wallis ANOVA by ranks. These two patterns were designated as favourable and unfavourable, depending on continuity/discontinuity of the spawning ground distribution in the central area of the East China Sea (i.e. Subarea B in this study).
For this study, a spawning season was considered to be between September of year n and April of year n + 1, with the autumn cohort between September and December and the winter cohort between January and April. Using this classification, the total seasonal spawning area was inferred as the sum of the spawning areas of the 6 months included in one season, resulting in 36 spawning seasons analysed. Commercial monthly catch data between 1979 and 2007 from the Japanese and Korean fleets were obtained from the Japanese Fisheries Agency and used to compare periods with different spawning conditions. The peak period of catches was considered to be June–September for the autumn cohort and October–January for the winter cohorts.
Results
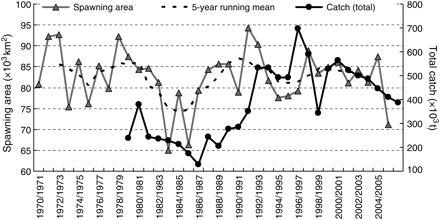
After inferring the monthly spawning area, the total seasonal spawning area was calculated. The results are plotted in Figure 4, together with the total (Japanese and Korean) commercial catch. Apart from the interannual variation, the catches displayed a similar long-term trend with spawning area size. It was lowest, 65 × 103 km2, during the cold regime, when catches were also low. Increases in the spawning area in the late 1980s and early 1990s corresponded to increases in the total catch.
Total inferred spawning area (with 5-year running mean) and total (Japan and Korean combined) commercial catch of the T. pacificus. Data on commercial catch obtained from the Japanese Fisheries Agency.
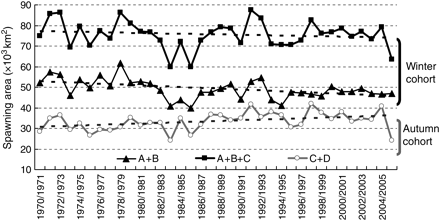
Figure 5 shows the spawning area for the subarea combinations, together with the linear tendency lines. The combination for autumn spawning (C + D) displayed an increasing trend. However, a similar trend was not observed for the two combinations associated with the winter spawning area: A + B and A + B + C. Although both combinations displayed a decreasing trend, the rate of decrease was not so strong when the combination included Subarea C, which, combined with the autumn period data, suggests that the area surrounding Kyushu is gaining importance as a spawning area for both spawning periods.
Inferred subarea combination for autumn (Subarea C combined with D) and winter (Subarea A combined with B, and Subarea A combined with B and C) cohorts.
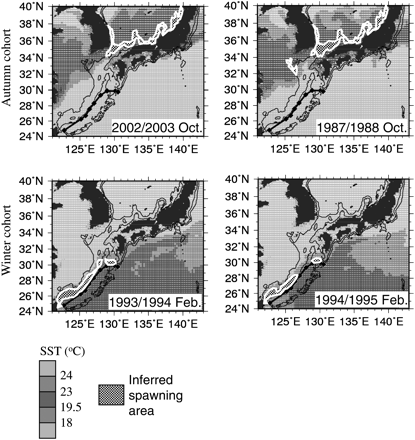
Figure 6 shows examples of the two patterns of spawning area distribution for both the autumn (upper panels) and winter (lower panels) periods. These figures were obtained by superimposing the inferred spawning area (represented by the black and white checked area) in SST maps. The autumn cohort is represented by the 2002/2003 and the 1987/1988 spawning seasons, and the winter cohort by the 1993/1994 and 1994/1995 spawning seasons. These seasons were chosen because they allowed easy visualization of the two patterns present during the study period. Regarding the autumn spawning ground distribution, no discontinuous zones can be observed and no apparent differences between the two patterns were found. However, in terms of the winter spawning ground distribution, a clear difference between the two patterns was observed, which showed a discontinuity of the spawning area in the central area of the East China Sea (∼29°N 128°E). For convenience, the two patterns will be referred to as favourable and unfavourable patterns, corresponding to continuous and discontinuous patterns, respectively. Table 1 illustrates which of the two patterns were present in the 4 months included in the winter spawning period for spawning seasons between 1970/1971 and 2005/2006. Here, the favourable pattern is represented by O and the unfavourable by X. Considering only the period for which catch data are available, the unfavourable pattern was present in 12 seasons (i.e. between 1979/1980 and 1983/1984, plus 1985/1986, 1988/1989, 1991/1992, 1993/1994, 1994/1995, 1999/2000, and 2004/2005), whereas the favourable pattern was present in 16 seasons (i.e. 1978/1979, 1984/1985, 1986/1987, 1987/1988, 1989/1990, 1990/1991, 1992/1993, 1995/1996–1998/1999, 2000/2001–2003/2004, and 2005/2006). In addition, horizontal lines illustrate the limits of the different regime shifts in the North Pacific, as used in this study: until 1975/1976 (inclusive) warm regime, from 1976/1977 to 1987/1988 cold regime, and from 1988/1989 to 2005/2006 (end of the study period) warm regime. In terms of these regimes, it is clear that in the current warm regime there has been an increase in the number of months with the favourable spawning area distribution pattern (from ∼36 to 68% of the total number of months in each period).
Matrix spawning area distribution pattern in the months January -April from the 1970/1971 to the 2005/2006 spawning seasons.
| Season . | January . | February . | March . | April . |
|---|---|---|---|---|
| Warm regime | ||||
| 1970/1971 | O | X | X | O |
| 1971/1972 | O | X | X | O |
| 1972/1973 | O | O | X | O |
| 1973/1974 | X | X | X | O |
| 1974/1975 | O | O | X | X |
| 1975/1976 | X | X | X | O |
| Cold regime | ||||
| 1976/1977 | X | X | X | O |
| 1977/1978 | O | X | X | X |
| 1978/1979 | O | O | O | O |
| 1979/1980 | O | X | X | O |
| 1980/1981 | X | X | X | O |
| 1981/1982 | X | X | X | O |
| 1982/1983 | O | X | X | O |
| 1983/1984 | X | X | X | X |
| 1984/1985 | X | O | O | O |
| 1985/1986 | X | X | X | O |
| 1986/1987 | O | O | X | O |
| 1987/1988 | O | O | O | O |
| Warm regime | ||||
| 1988/1989 | O | X | X | O |
| 1989/1990 | O | O | O | O |
| 1990/1991 | O | X | O | O |
| 1991/1992 | O | X | X | O |
| 1992/1993 | O | O | X | O |
| 1993/1994 | O | X | X | O |
| 1994/1995 | O | X | X | O |
| 1995/1996 | O | X | O | O |
| 1996/1997 | O | O | O | O |
| 1997/1998 | O | O | O | O |
| 1998/1999 | O | O | O | O |
| 1999/2000 | O | X | X | O |
| 2000/2001 | O | O | O | O |
| 2001/2002 | O | X | O | O |
| 2002/2003 | O | O | O | O |
| 2003/2004 | O | X | O | O |
| 2004/2005 | O | X | X | O |
| 2005/2006 | O | O | O | O |
Favourable pattern by O and unfavourable pattern by X. Also marked are the limits of the different regime shifts used in this study: until 1975/1976 (inclusive) warm regime, from 1976/1977 to 1987/1988 cold regime, and from 1988/1989 to 2005/2006 (end of the study period) warm regime.
Examples of the two spawning area distribution patterns: favourable (left panels) and unfavourable (right panels), for the autumn (upper panels) and winter (lower panels) cohorts. Grey scale represents SST and the inferred spawning area is marked in black and white check.
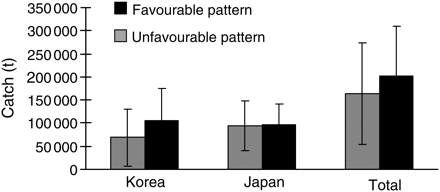
The existence of the two patterns of spawning area distribution is likely to influence the commercial catch. In fact, the catch data demonstrated that the mean catch between October and January (corresponding to the peak of the winter cohort catch) was larger in the years where the favourable pattern was observed, especially off Korea (Figure 7). Moreover, the Kruskal–Wallis ANOVA by ranks demonstrated that there was a significant difference in the commercial catch between the two patterns (p < 0.05). To analyse the individual importance of each month, a Kruskal–Wallis ANOVA by ranks was computed for January, February, March, and February–March combined (four computations). The results only revealed significant differences in the winter cohort catch when considering the month of January alone (p < 0.01). Because the winter cohort is responsible for the majority of the biomass, it is expected that the two patterns will influence not only the winter cohort catch, but also the total Japanese common squid catch. As expected, the Kruskal–Wallis ANOVA by rank analysis for the total catch revealed similar results for the 3-month combination (January–March) and January (p < 0.01). For the total catch, the month of March also displayed significant results (p < 0.05).
Japanese, Korean, and total commercial catch for the months of October to January in favourable (black) and unfavourable (grey) spawning area distributions. Data on commercial catch obtained from the Japanese Fisheries Agency.
Discussion
Sakurai et al. (2002) reported no significant changes in the autumn cohort spawning ground between the different regimes. The same was observed in the current study. However, the same was not observed for the winter spawning period. The main result of this study is not the size of the spawning area, but its distribution, especially regarding the winter spawning season. Two spawning area distribution patterns were identified. These patterns can be characterized by the continuity or discontinuity of spawning-ground distribution in the central East China Sea, around 29°N 128°E. The results suggest that a discontinuous (unfavourable pattern) during January–March, but mainly in January, will result significantly in a decrease in the catch in the following fishing season. These two patterns are directly related to the SST during winter. Robin and Dennis (1999) demonstrated the importance of water temperature, especially during winter, for Loligo forbesi and L. vulgaris in the English Channel.
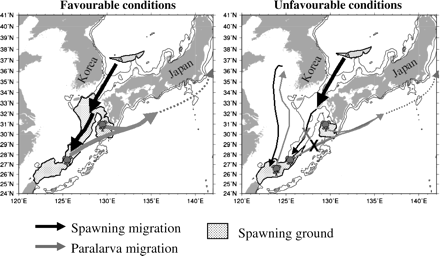
The following mechanism is proposed to explain the importance of the central East China Sea spawning area for the winter cohort spawning success and consequently higher catches. In terms of the favourable pattern, adult squid return to the spawning area and encounter favourable spawning conditions from the Tsushima Strait to the southern part of their spawning range. After hatching, the hatchlings are transported by currents to their feeding grounds. This transport is mainly via the Kuroshio Current, following a migration route along the Pacific coast of Japan. However, some hatchlings are transported by the Taiwan Warm Current or the Yellow Sea Warm Current to the west coast of the Korean Peninsula. This process is summarized in Figure 8 (left panel).
Hypothesized mechanism occurring in years with favourable and unfavourable spawning area distribution pattern.
When the unfavourable pattern is present, the spawning area is divided into northern (around Kyushu Island, Subarea C) and southern areas (southern East China Sea. Subarea A). The adult squid, when returning to the spawning ground through the Tsushima Strait, would still find favourable conditions for spawning in the area south of Kyushu. However, the discontinuity in the spawning area distribution on the central East China Sea (Subarea B) might prevent the squid from reaching the most southern available spawning ground. This could result in an increase in egg mass density in a single zone and possibly reduced survival. In the scenario where the spawning stock reaches the southern spawning ground and spawns successfully, the hatchlings would not find good environmental conditions during the early stages of their feeding migration through the Pacific migration route, reducing their survival, and consequently reducing the catch. The reduction in stock abundance associated with larval exposure to lower SSTs has also been observed for other species (Hatfield et al., 1998; Yatsu et al., 2000). With the reduction in the Pacific route, the hatchlings would be transported more successfully by the Taiwan Warm Current, so increasing recruitment to the west coast of the Korean Peninsula (Figure 8, right panel). This would transform what used to be a secondary migration route into the main migration route. The influence of oceanographic conditions in the migration route was also reported by Onitsuka et al. (2010) in a numerical simulation study of the diamond squid (Thysanoteuthis rhombus).
Choi (2003) analysed the Korean catch data for T. pacificus on both the west and east (Sea of Japan) coasts of the Korean Peninsula, from 1980 to 2000. This temporal range includes both the cold and the current warm regime, which this study demonstrated to be associated with bad and good patterns, respectively. Choi's results revealed a clear difference in the catch between the two regimes, which was especially visible on the west coast. Although only representing a small percentage of the Korean catch (on average less than 10%), catches off the west coast almost doubled during the cold regime. During the warm regime, which should be associated with a good pattern and therefore bigger catches off both the western and eastern coasts of Korea, there was almost zero catch off the west coast. This might be because in the presence of good spawning conditions, the northern (around Kyushu Island; Subarea C) and the central (central East China Sea; Subarea B) spawning areas might be sufficient for the entire cohort to spawn, reducing the use of the southern (subarea A) spawning ground. These two areas (Subareas C and B), unlike the southernmost area (Subarea A), are not strongly influenced by the Taiwan Warm Current, which is mainly responsible for transporting hatchlings to the west coast of Korea. Squids have been reported to display active movement to maintain a physiological preference (Garrison et al., 2002). In this case, the adult stock's active choice of spawning ground might be the reason for the clear separation of catches in the Korean Peninsula between warm and cold regimes.
Our results suggest that the continuity/discontinuity of the spawning area in the East China Sea can influence the catch of the T. pacificus winter cohort. Sakurai et al. (2002) also related the adult stock size with the cold (before 1988) and warm regimes. According to those authors, during the warm regime, an overlap of the autumn and the winter cohort spawning area occurs, because of the expansion of the winter one, and both the winter and the autumn cohorts have the same relative importance. This results in an increase in reproductive success. Conversely, during the cold regime, the winter spawning area shrinks and the autumn cohort consequently gains importance compared with the winter one, and the reproductive success increases (see Figure 4 of Sakurai et al., 2002). Waluda et al. (2001) demonstrated a correlation between the proportion of hatching area and the fishery for Illex argentinus. The current study did not focus on the hatching area, but on the spawning area. However, because the spawning and hatching areas of the Japanese common squid are quite similar, the results presented are in agreement with Waluda et al. (2001).
The use of the spawning area in predicting the commercial catch of the T. pacificus has some limitations. First, the spawning area was calculated using an SST range limitation. Atmospheric factors, e.g. wind, might change the SST and/or the surface-layer water temperature, but still maintaining a relatively stable water column, allowing spawning. This can be an obstacle to finding a direct quantitative relationship between spawning area and catch. In addition, the same atmospheric and other oceanographic factors (e.g. wind, current speed, or presence of eddies), might influence Japanese common squid distribution, as for other species (Dawe et al., 2000; Agnew et al., 2005; Dawe et al., 2007) and hence its survival and mortality, both during the feeding and the reproductive migration. Such factors probably vary interannually, making it difficult to make a direct connection between the spawning ground and the yield.
This study demonstrates that the distribution (rather than size alone) of the T. pacificus spawning ground, as calculated using the 100–500-m depth range, the Kuroshio axis mean position, and the 19.5–23°C SST range, can be a good qualitative indicator for inferring the subsequent catch of this species. However, additional research is necessary to analyse the dispersion stemming from current transport during early life stages.
Acknowledgements
We thank J. R. Bower, H. Kidokoro, N. Yamashita, and two reviewers for their helpful comments and suggestions on the manuscript, the named three also for the research that resulted in this study. We also thank the Japanese Fisheries Agency for the commercial catch data and to the Japan Meteorological Agency for the sea surface temperature data, without which this study could not have been done.


