-
PDF
- Split View
-
Views
-
Cite
Cite
Shaara M. Ainsley, David A. Ebert, Gregor M. Cailliet, Age, growth, and maturity of the whitebrow skate, Bathyraja minispinosa, from the eastern Bering Sea, ICES Journal of Marine Science, Volume 68, Issue 7, July 2011, Pages 1426–1434, https://doi.org/10.1093/icesjms/fsr072
Close - Share Icon Share
Abstract
Skates are a common bycatch in groundfish fisheries in the Bering Sea; however, their life-history characteristics are not well known. The study is the first to investigate the age, growth, and age at maturity of Bathyraja minispinosa. Ages were estimated using sectioned vertebrae and several growth models were compared. The Gompertz model was the best fit and no significant differences were detected between sexes for any model. The maximum age estimated was 37 years, and parameter estimates generated from the three-parameter von Bertalanffy model were k = 0.02 year−1 and L∞ = 146.9 cm total length (TL). Males reached their size at 50% maturity larger than females (70.1 and 67.4 cm, respectively), but no significant differences in the estimated size or age at maturity were found. Whereas B. minispinosa is smaller than many skate species in the eastern Bering Sea, it has a considerably longer estimated lifespan, indicating that size may not be a reliable method of estimating the vulnerability of a rajid species to population declines in the eastern North Pacific.Ainsley, S. M., Ebert, D. A., and Cailliet, G. M. 2011. Age, growth, and maturity of the whitebrow skate, Bathyraja minispinosa, from the eastern Bering Sea. – ICES Journal of Marine Science, 68: 1426–1434.
Introduction
In recent decades, there has been growing concern over the fishing pressure placed on elasmobranch populations around the world, because of their relatively slow growth, late maturation, and low fecundity (Dulvy et al., 2000; Stevens et al., 2000; Dulvy and Reynolds, 2002). The barndoor skate, Dipturus laevis, in the western North Atlantic (Casey and Myers, 1998) and the common skate, Dipturus batis, from the Irish Sea (Brander, 1981), are frequently cited as examples of skates that are vulnerable to fishing pressure. Despite the lack of a directed fishery for skates in the eastern Bering Sea, skates made up an estimated 51–76% of the total bycatch in the “other species” category between 1992 and 2005 in Alaskan commercial bottom-trawl and longline fisheries (Gaichas et al., 2005). An increase in skate landings in the eastern North Pacific and the development of a directed skate fishery in the Gulf of Alaska have led to growing interest in the management of skates in this region.
The whitebrow skate, B. minispinosa (Ishiyama and Ishihara, 1977), is 1 of 14 known skates of the genus Bathyraja (Chondrichthyes: Rajiformes: Arhychobatidae) on the eastern Bering Sea continental slope (Stevenson et al., 2008). The taxonomy of skates in the eastern Bering Sea is still not well defined, and correct species identification has been problematic. Therefore, in most fisheries, skate species are lumped together as one bycatch category, despite differences in abundance, distribution, and life-history characteristics. Until recently in the eastern Bering Sea, skates were managed as part of the “other species” category along with taxonomically and biologically dissimilar groups (i.e. sharks, sculpins, squid, and octopus). The management plan was amended in 2010 to remove skates from the “other species” category. Therefore, skates in the eastern Bering Sea and Aleutian Islands will now be managed with their own harvest specifications (Ormseth et al., 2010). However, all skate species other than Bathyraja parmifera will still be collectively managed in an “other skates” category. If differences exist among the life-history traits of Bering Sea skate species, some may be more vulnerable to overfishing than others.
Bathyraja minispinosa has been recorded from the Sea of Okhotsk off Hokkaido, Japan, to the Gulf of Alaska and has the sixth highest mean density of the skates on the eastern Bering Sea slope (Mecklenburg et al., 2002; Stevenson et al., 2008). Although B. minispinosa is not a common species in the region and made up only 5.15% of the total skate biomass during the 2008 trawl survey of the eastern Bering Sea continental slope (Ormseth et al., 2010), its relatively limited distribution and low abundance may make it especially susceptible to overexploitation. An in-depth examination of the life-history traits of B. minispinosa has yet to be conducted (Orlov, 1998; Ebert, 2005).
Between 2003 and 2005, there was a direct skate fishery in the Gulf of Alaska, targeting two of the larger skate species, Raja binoculata and R. rhina (Ormseth and Matta, 2007a). In 2009, a fishery began in Prince William Sound in the Gulf of Alaska (K. Goldman, pers. comm.), despite concerns that life-history data available for skate species are insufficient to manage properly a fishery in Alaskan waters (Ormseth and Matta, 2007b). With the re-emergence of a directed fishery for skates in the region, and the potential for expansion of the skate fishery into the eastern Bering Sea, it has become imperative to estimate life-history parameters for all species in the Alaskan skate complex.
Methods
Bathyraja minispinosa were collected by trawl on the National Marine Fisheries Service Alaska Fisheries Science Center's (NMFS–AFSC) eastern Bering Sea continental slope survey during summer 2004. The survey covered the continental slope from northwest of Unalaska Island (55°95′N 168°92′W) to the Navarin Canyon (60°16′N 179°68′W) near the US–Russian border. The survey is a random-stratified sampling design made up of 83 predetermined bottom-trawl stations (Hoff and Britt, 2005). Samples were collected using a Poly Nor's eastern, high-opening trawl outfitted with mud-sweep roller gear during ∼30-min trawls. For a detailed description of the sampling methods used by NMFS on the 2004 survey, see Hoff and Britt (2005). NMFS fishery biologists and observers in the eastern Bering Sea collected additional vertebral samples in 2006 and 2007. All samples were frozen on board and returned to the laboratory for analysis.
Several morphometric measurements were taken on board. These included total length (TL), measured in millimetres from the tip of the snout to the tip of the tail, and disc width (DW), measured from wing tip to wing tip. Also, the inner clasper length was recorded for each male and the width of the oviducal gland for each female. Each individual was assigned a level of maturity based on examination of the gonads and the rigidity of the claspers, using the maturity criteria developed by Ebert (2005).
Sections of ∼10–15 vertebrae from the anterior portion of the vertebral column were removed. For comparison, segments were taken from the posterior portion of the vertebral column of a subsample of skates, with at least ten vertebrae separating the anterior and posterior vertebral samples. Additionally, six or more of the anteriormost caudal thorns were preserved. Both structures were immediately frozen. Whole reproductive tracts were collected from a subsample of both sexes and preserved in 10% formalin. As the observers only recorded sex and did not assign a maturity stage or measure and retain reproductive tracts, sample sizes varied depending on the analysis.
Preparation of ageing structures
The vertebrae were cleaned of all tissue and cartilaginous arches, then air-dried. To test the assumption that centra grow in proportion to the TL of the skate, the diameters of one centrum from each individual were measured to the nearest 0.01 mm. For each, two diameters were taken at 90° angles, and a mean centrum diameter (MCD) was regressed against the TL of the skate.
Centra were embedded in a polyester casting resin before sectioning. Using a low-speed Buehler Isomet saw with diamond-edged blades (Buehler Isomet, Lake Bluff, IL, USA), a section containing the nucleus was extracted from each centrum using spacers between 0.3 and 0.6 mm thick. Sections were secured to a microscope slide using Cytoseal 60, then polished using progressively finer wet–dry sandpaper to provide optimal thickness for viewing the pattern. Mineral oil was brushed on vertebral sections to enhance viewing of the band pattern and to remove surface irregularities.
Sections of caudal thorn were cleaned of as much excess tissue as possible and placed in 5% trypsin for at least 10 h, depending on temperature, in batches of approximately ten. After soaking in trypsin, the remaining tissue was removed, and the structures were air-dried. The width, height, and length of three thorns from each individual were measured to the nearest 0.01 mm. The mean for each parameter was plotted against the TL of the skate using a non-linear regression analysis.
To investigate the usefulness of staining techniques on the readability of the caudal thorns, several methods were compared. The first was a technique adapted from LaMarca (1966) using Alizarin Red S in a 1:9 ratio of Alizarin to 0.2% NaOH. Another technique was adapted from Carlson et al. (2003) and Johnson (1980) using crystal violet. The resulting thorns were compared for visibility of banding patterns. Banding patterns in B. minispinosa caudal thorns were best visualized after staining in 1% crystal violet for 15 min. Two techniques for counting the banding on the thorns were compared: first, direct observation via a dissecting microscope, and second, using digital photos taken with the same microscope. The benefit of using the microscope directly was the ability to manipulate the light and angle while counting, potentially making the counts more accurate. The benefit of the photographic method was that once a photograph had been taken, several readings could be made from that single photo, increasing precision. Given the difficulty in photographing the concave vertical surface of the thorn, it was decided that all thorn counts would be conducted under a microscope rather than on the photographs.
Age determination
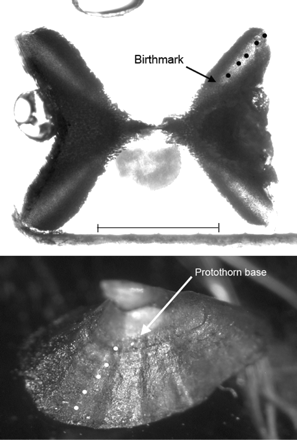
The birthmark (age 0) on the vertebral centra was described by a change in angle of the corpus calcareum, and band counts began from that point (Figure 1). A band pair was defined as one translucent and one opaque growth zone across the corpus calcareum and, when possible, the intermedialia of the vertebrae. Preliminary examinations of the vertebrae revealed that banding in the intermedialia was not present in every individual. Thin bands on centra, which did not span the width of the corpus calcareum and were not visible in the intermedialia, were considered check marks and were not counted. Likewise, thin opaque bands diverging from larger opaque bands were termed splits and not considered separate bands. Readings were conducted blind, meaning that the reader did not know the length, sex, or prior age estimations of the fish while determining the age.
A vertebra (top) and a caudal thorn (bottom) from a male B. minispinosa (31.0 cm TL) with an estimated age of 5 years. Black dots (vertebra) and white dots (caudal thorn) represent the band pairs (or ridges) counted to obtain age estimates. The birthmark on the vertebra and the base of the protothorn are marked by arrows. The scale bar is ∼1 mm for both photos.
Vertebral centra were photographed using a SPOT RT camera (Diagnostic Instruments, Inc., Sterling Heights, MI, USA) attached to a dissecting microscope with transmitted light, and the band counts were based on these photographs. Each centrum was read three times. However, read 1 was considered a practice round for the reader to become familiar with the samples, and it was not used for the final age estimation or precision assessments, although the value was considered when determining whether a fourth read would be necessary. Occasionally, a fourth read was conducted if reads 2 and 3 did not agree.
A protothorn, or embryonic thorn, was considered the reference point from which the subsequent bands were counted (Gallagher and Nolan, 1999; Figure 1). Two different techniques for reading the ridges of the caudal thorns were compared. First, the thorns were photographed using the SPOT camera and microscope, and the ridges apparent in the photo of each individual were counted. Ridges were also counted under a dissecting microscope, as the reader manipulated the light and thorn angle to visualize all possible ridges. As for the vertebrae, readings were conducted blind, and the reader did not know the prior age estimations of the skate while determining the age.
Precision, error analysis, and validation
Contingency tables were used to determine whether there was a significant bias among the two readings (Hoenig et al., 1995; Evans and Hoenig, 1998; Goldman, 2002). Further, the precision and error analyses among readings of the same centrum were assessed in several ways: the index of average percent error (IAPE), coefficient of variation (CV), and index of precision (D; Beamish and Fournier, 1981; Chang, 1982; for details, see Ebert et al., 2009). Estimates of precision were calculated based on reads 2 and 3 (and 4 when appropriate), excluding individuals with mean age estimates of zero. Those individuals were excluded because in the calculations (APE, CV, and D), a value is divided by the average age calculated for each fish, which is not possible when the average age is zero.
To assess whether the timing of the band pairs reflected annual deposition, two types of indirect age validation were conducted: edge analysis (qualitative) and marginal increment analysis (MIA; quantitative). As the first band pair is not completely formed in age 0 fish, individuals younger than an estimated age of 4 years were not included in validation assessments. Only those with relatively good clarity were chosen for the assessment. The marginal increment ratios (MIRs) were calculated as the ratio of the marginal (edge) band-pair growth in millimetres over the growth of the penultimate band pair (Conrath et al., 2002). To test for differences in mean MIRs among months, a one-way ANOVA was computed using SPSS® 11.0 (SPSS Inc., Chicago, IL, USA).
Modelling growth
Six growth models were fitted separately for males and females to the age-at-length data using SigmaPlot® 10.0 (Systat Software Inc., Chicago, IL, USA): logistic (modified from Ricker, 1979), Gompertz (modified from Ricker, 1979), three-parameter von Bertalanffy growth function (VBGF; von Bertalanffy, 1938), two-parameter VBGF (von Bertalanffy, 1960), four-parameter Richards model (Richards, 1959; Neer and Thompson, 2005), and a three-parameter polynomial function (for details, see Ebert et al., 2009). The common three-parameter VBGF includes t0 to simplify yield calculations, but it is important to keep in mind that this parameter, which is defined as the age at which the organism would be zero length, is largely artificial and has no biological meaning for elasmobranchs (Cailliet et al., 2006). For the two-parameter version of the VBGF, L0 was set to an estimated length at birth of 14.5 cm (J. Hoff, pers. comm.). Using the resulting parameters of the three-parameter VBGF, an estimated length at birth was calculated as  to determine whether the value fell within the range of observed values of 14–15 cm (Cailliet et al., 2006).
To examine for possible differences between sexes for each model, a likelihood ratio test adapted from Kimura (1980) was calculated in Excel® (Microsoft, Redmond, WA, USA) following Haddon (2001). A goodness-of-fit was assessed for each model by comparing the CV (r2), residual mean squared error (MSE), and the significance levels (Carlson and Baremore, 2005; Neer and Thompson, 2005).
Maturity

To test for a difference between the mean number of mature ova in the left and right ovaries, a paired t-test was conducted in SPSS®. The relationship between the TL of the female and the total number of mature ova by month was examined in SPSS®, using analysis of covariance (ANCOVA).
Results
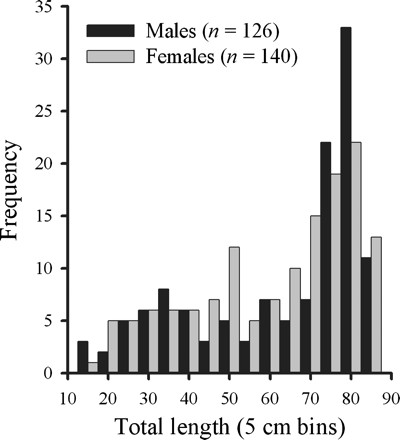
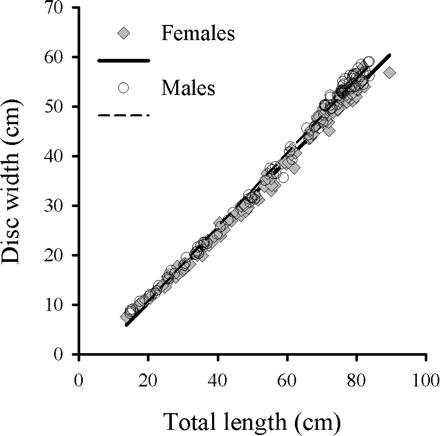
On the AFSC–NMFS eastern Bering slope survey, 268 B. minispinosa were caught by trawl between 199 and 1169 m deep. Of these, 218 were used for analysis of age and growth. NMFS–AFSC biologists and observers provided an additional 46 vertebral samples, of which 45 were suitable for age determination. Therefore, vertebrae from 263 skates were used for the analysis of age and growth. Males ranged between 14.7 and 83.7 cm TL, and females from 13.6 to 89.5 cm TL (Figure 2). A strong linear TL–DW relationship was identified for both males (n = 107; DW = 0.75 TL − 4.23; r2 = 0.99) and females (n = 114; DW = 0.72 TL − 3.91, r2 = 0.99). ANCOVA indicated a significant difference in the TL–DW relationship (slopes) between sexes (F1,217 = 12.34, p < 0.01; Figure 3).
Length frequencies of male and female B. minispinosa used for age determination collected from fishery-independent surveys and fisheries observers' samples, 2004–2007.
Relationship between DW and TL for female (n = 114, DW = 0.7188 TL − 3.9094, r2 = 0.9926) and male (n = 107, DW = 0.7475 TL − 4.2299, r2 = 0.9940) B. minispinosa.
Relationships between centrum and caudal thorn
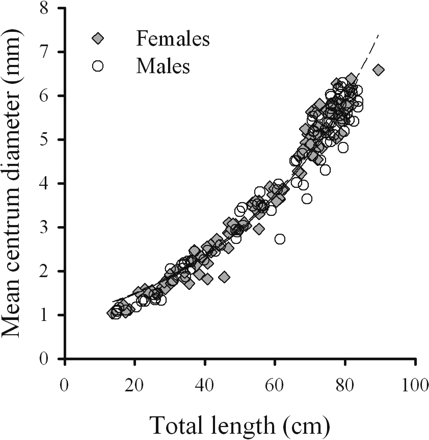
There was a significant increase in the MCD with increasing TL (p < 0.01), but the relationship was not linear and the centrum diameter relative to TL increased at a greater rate in larger skate (Table 1, Figure 4). Additionally, significant, positive non-linear relationships were found between mean thorn height and TL, mean thorn width and TL, and mean thorn length and TL (Table 1). Results of the Kolmogorov–Smirnov tests indicated that all residuals from the relationships between centrum and caudal thorn, presented in Table 1, did not significantly deviate from a normal distribution (p > 0.05).
Relationships between TL (independent, x) and various measurements of B. minispinosa age-determination structures (dependent, y).
| Parameter . | Equation . | r2 . | p-value . |
|---|---|---|---|
| MCD | y = 0.83 e0.03x | 0.97 | <0.01 |
| Mean thorn height | y = 0.46 x0.46 | 0.71 | <0.01 |
| Mean thorn width | y = 0.03 x1.24 | 0.95 | <0.01 |
| Mean thorn length | y = 0.17 x0.83 | 0.90 | <0.01 |
| Parameter . | Equation . | r2 . | p-value . |
|---|---|---|---|
| MCD | y = 0.83 e0.03x | 0.97 | <0.01 |
| Mean thorn height | y = 0.46 x0.46 | 0.71 | <0.01 |
| Mean thorn width | y = 0.03 x1.24 | 0.95 | <0.01 |
| Mean thorn length | y = 0.17 x0.83 | 0.90 | <0.01 |
Relationship between MCD and TL for female (n = 111) and male (n = 106) B. minispinosa, where MCD = 0.8294 e0.0248 TL (r2 = 0.967).
Caudal thorns
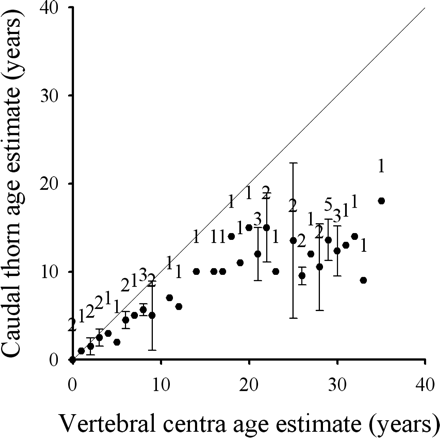
To compare age estimates derived from caudal thorns with the final ages estimated from vertebral centra, one read was conducted on a single thorn of each skate (n = 50). Age estimates from caudal thorns were in agreement with age estimates from centra for only the first few years, after which thorn estimates were much lower (Figure 5). This was reflected in the results of the χ2 analysis of the contingency tables, which found a significant bias between age estimates using the pooled test statistic (McNemars') method (χ2 = 45.0, p < 0.01).
Relationship between the vertebral centra band counts and the mean band count of caudal thorns from B. minispinosa (n = 50). The 45° line represents 1:1 agreement between band counts. The error bars indicate ±the 95% confidence intervals, and the sample size is shown above the symbol.
Anterior vs. posterior centra
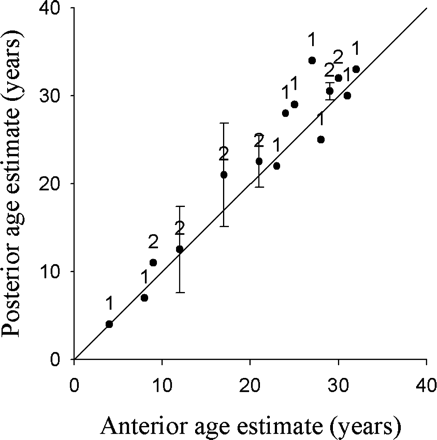
Visual assessment of the pairwise age-difference plot comparing anterior and posterior centra showed no significant bias (Figure 6; n = 21). Two of the three tests of symmetry indicated that differences may be attributed to random error (Bowker's, χ2 = 19.0, p = 0.33; Evans–Hoenig, χ2 = 7.0, p = 0.14), and the third detected a slight systematic bias (McNemar's, χ2 = 4.26, p = 0.04). McNemar's test, also referred to as the maximally pooled test, detects asymmetry when the individual differences are small, but reinforce themselves upon pooling (Evans and Hoenig, 1998). As this test showed a significant difference, it means that if there is asymmetry, the differences are slight and probably a consequence of the small sample size, rather than a systematic bias. Because visually there was no bias and only one test, which was pooled, indicated slight bias, anterior centra were used for the balance of the age study.
Age-bias plot of age estimates between the anterior read and the mean of the posterior reads of B. minispinosa vertebral centra (n = 21). The 45° line represents 1:1 agreement between band counts. The error bars indicate ±95% confidence intervals, and the sample size is shown above the symbol.
Precision, bias, and validation
Of the 263 vertebrae for which the age was determined, only 187 were deemed usable (71.1%), and two of these did not have sufficient biological data (e.g. TL or sex) for analysis, leaving 185 samples. The IAPE (4.78%), CV (6.57%), and D (4.02%) all showed an acceptable level of precision among reads. Visual assessment of the pairwise age-bias plot showed no consistent bias, and the contingency table χ2 tests of symmetry indicated that the differences were from random error (Bowker's, χ2 = 97.7, d.f. = 99, p = 0.52; McNemar's, χ2 = 0.12, d.f. = 1, p = 0.72; Evans–Hoenig, χ2 = 7.81, d.f. = 7, p = 0.35).
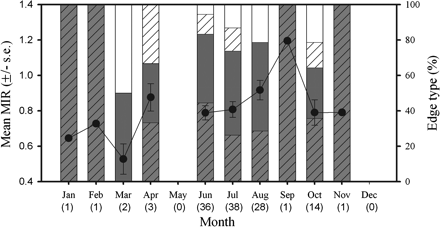
In all, 125 vertebrae were measured for MIA and assigned edge types. Only individuals with vertebrae that were estimated to be 4 years old or more were used in the edge analysis. Although samples were available from 10 months, sample sizes per month varied greatly. For example, there was only one sample each from January and February, but because most of the sampling was in July, many more samples were available from that month than from any other. To have similar sample sizes among months for statistical analysis, not all samples collected in July were used in edge analysis, and 38 samples were selected randomly from those vertebrae for use in age estimation. An ANOVA was conducted excluding months with sample sizes <14, and the results indicated that there was no significant difference in the MIR values among the months of June, July, August, and October (F3,112 = 1.45, p = 0.23; Figure 7). Given the limited temporal scope of just four consecutive months, insufficient data were available to validate a single band pair, one opaque and one translucent, being deposited annually.
Monthly variation in B. minispinosa centrum edge type and mean MIR ± 1 s.e. (n = 125) determined from pooled sexes. Sample sizes are depicted below each month in parenthesis. Hatched grey, narrow opaque edge; grey, broad opaque edge; hatched white, narrow translucent edge; white, broad translucent edge.
Growth models
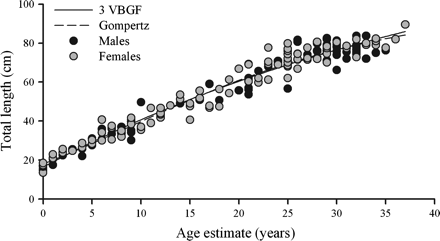
Estimated ages ranged from 0 to 37 years (n = 97) for females and 0 to 35 years (n = 88) for males. The maximum band count of 37 years was assigned to the largest skate from the study, a mature female (89.5 cm TL). The male with the greatest band count of 35 years was 76.2 cm TL, whereas the largest male aged was estimated at 33 years (83.7 cm TL).
No significant difference was found between male and female growth curves for any of the models based on the results of a likelihood ratio test, so the sexes were pooled (three-parameter VBGF: χ2 = 2.82, d.f. = 3, p = 0.42; two-parameter VBGF: χ2 = 0.96, d.f. = 2, p = 0.62; Gompertz: χ2 = 3.12, d.f. = 3, p = 0.37; logistic: χ2 = 3.09, d.f. = 3, p = 0.38; Richards: χ2 = 2.82, d.f. = 4, p = 0.59; polynomial: χ2 = 3.08, d.f. = 3, p = 0.38).
All growth models fitted the data well (r2 > 0.96, p < 0.01; Table 2), but the Gompertz model yielded the best fit (Figure 8). Moreover, the Gompertz model estimated a more biologically realistic L∞ than did the standard three- and two-parameter VBGFs. The L∞ estimates from the three-parameter VBGF were much higher than the reported maximum sizes for the species (Table 2).
Parameters for each growth model for males, females, and combined sexes of B. minispinosa.
| Growth model . | Sex . | L∞ . | k . | t0 . | L0 . | g . | p . | a . | b . | c . | r2 . | Mean square error . |
|---|---|---|---|---|---|---|---|---|---|---|---|---|
| Three-parameter VBGF | Males | 129.0 | 0.0255 | −4.8565 | – | – | – | – | – | – | 0.9601 | 19.46 |
| Females | 171.9 | 0.0162 | −6.6565 | – | – | – | – | – | – | 0.9552 | 18.92 | |
| Pooled | 146.9 | 0.0206 | −5.7604 | 16.4 | – | – | – | – | – | 0.9576 | 19.15 | |
| Two-parameter VBGF | Males | 125.3 | 0.0270 | – | 14.5 | – | – | – | – | – | 0.9609 | 19.26 |
| Females | 137.5 | 0.0236 | – | 14.5 | – | – | – | – | – | 0.9534 | 19.87 | |
| Pooled | 130.8 | 0.0254 | – | 14.5 | – | – | – | – | – | 0.9571 | 19.47 | |
| Gompertz | Males | 94.8 | 1.7228 | – | – | 0.0687 | – | – | – | – | 0.9611 | 18.97 |
| Females | 106.2 | 1.7186 | – | – | 0.0561 | – | – | – | – | 0.9564 | 18.43 | |
| Pooled | 100.2 | 1.7134 | – | 18.1 | 0.0618 | – | – | – | – | 0.9586 | 18.69 | |
| Logistic | Males | 86.5 | 0.1099 | 11.8472 | – | – | – | – | – | – | 0.9606 | 19.19 |
| Females | 93.1 | 0.0956 | 13.3722 | – | – | – | – | – | – | 0.9564 | 18.40 | |
| Pooled | 89.6 | 0.1022 | 12.5704 | – | – | – | – | – | – | 0.9584 | 18.78 | |
| Richards | Males | 90.5 | 0.0256 | – | 0.8833 | – | 0.3544 | – | – | – | 0.9610 | 19.69 |
| Females | 104.2 | 0.0162 | – | 0.8976 | – | 0.5002 | – | – | – | 0.9561 | 19.12 | |
| Pooled | 96.5 | 0.0206 | 0.8883 | – | 0.4205 | – | – | – | 0.9581 | 19.25 | ||
| Polynomial | Males | – | – | – | – | – | – | 15.1273 | 2.8151 | −0.0262 | 0.9617 | 19.09 |
| Females | – | – | – | – | – | – | 17.5784 | 2.4697 | −0.0163 | 0.9565 | 18.7660 | |
| Pooled | – | – | – | – | – | – | 16.4472 | 2.6225 | −0.0207 | 0.9586 | 18.9207 |
Parameters: L∞, asymptotic length; k, growth coefficient; t0, theoretical age at zero length; L0, length at birth; g, instantaneous growth rate; p, shape parameter; a, b, and c, constants.
The three-parameter VBGF [Lt = 146.92(1 − exp (−0.02(t+ 5.76))), p < 0.0001, r2 = 0.9576) and Gompertz  , p < 0.0001, r2 = 0.9586) growth models fitted to length-at-age data for combined sexes of B. minispinosa (n = 185).
Maturity and reproduction
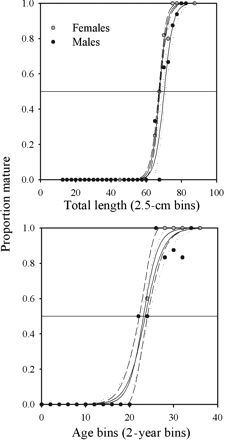
The size at first maturity was 65.7 cm TL for males, and the largest immature male was 79.5 cm TL. Male B. minispinosa reach TL50 at 70.1 cm (r2 = 0.96, p < 0.01, n = 27; Figure 9), slightly larger than the TL at which there was a sharp increase in clasper length at around 68 cm TL (n = 125, range: 6–188 mm). The youngest mature male was estimated at 22 years and males reached Age50 at 23 years (r2 = 0.95, p < 0.01, n = 18; Figure 9).
(Top) Estimated TL50 for female and male B. minispinosa, with 95% confidence intervals depicted by dashed (female) and dotted (male) lines (67.4 and 70.1 cm TL for females and males, respectively). (Bottom) Estimated Age50 for female and male B. minispinosa (23.5 and 23.1 years for females and males, respectively).
For females, the size at first maturity was 66.8 cm TL, and the largest immature female was 73.3 cm TL. Females reached TL50 at 67.4 cm (r2 = 0.99, p < 0.01, n = 28; Figure 9), slightly larger than the point at which the oviducal widths showed a sharp increase at 65 cm TL (n = 106, range: 1–59 mm). The results of the F-test showed no significant difference in TL50 between sexes (ARSS: F24,51 = 1.62, p = 0.07). The youngest mature female was estimated at 23 years and females reached Age50 at 23.5 years (r2 = 0.97, p < 0.01, n = 19; Figure 9). Moreover, there was no significant difference in Age50 between sexes (ARSS: F16,33 = 1.35, p = 0.22).
Nine gravid females were encountered throughout the 3 months of the survey, three in June and six in July. A one-sample Kolmogorov–Smirnov test found the distributions of ova counts in both ovaries of mature females to be not significantly different from a normal distribution (left ovary: Z = 0.79, n = 28, p = 0.56; right ovary: Z = 0.68, n = 28, p = 0.74). A paired t-test found no significant difference between the mean numbers of mature ova in either ovary (paired t = 0.14, d.f. = 27, p = 0.89). No relationship was found between the total number of mature ova and the maternal TL for any month (ANCOVA TL: F1,28 = 1.28, p = 0.270; month: F2,28 = 1.43, p = 0.26; TL × month: F2,28 = 1.47, p = 0.25).
Discussion
Published studies have suggested that the maximum TL of a skate species may be an indicator of vulnerability to overfishing (Walker and Hislop, 1998; Dulvy et al., 2000; Frisk et al., 2001). Those authors based their models on evidence from life-history studies that indicated that species of similar maximum size shared similar demography. However, B. minispinosa, although smaller than many other skate species in the region, has a considerably longer estimated lifespan than most Alaskan Bathyraja species documented in the literature. Additionally, there is recent evidence that species such as B. maculata and B. lindbergi have similarly long lifespans (Ebert et al., 2009). The results of this study seem to show that size is not a reliable approach to estimating the vulnerability of a rajid to potential population declines in the eastern North Pacific, and underscore the importance of estimating growth parameters for each species in a skate assemblage, because size alone cannot predict longevity and growth rate.
All growth models fitted the B. minispinosa data well, although the Gompertz model was the best. The results from this study agree with other authors who found that versions of the Gompertz model better characterized the growth of skates and rays than standard VBGFs (Neer and Cailliet, 2001; Neer and Thompson, 2005; Matta and Gunderson, 2007).
Some recent studies have found caudal thorns to be useful structures for age determination (Gallagher and Nolan, 1999; Henderson et al., 2004; Matta and Gunderson, 2007; Serra-Pereira et al., 2008), but the results of this study show that the deposition of ridges on the thorns does not agree with the banding on the vertebral centra. Age estimates derived from caudal thorns were consistently lower than those derived from vertebrae after 5 years of age. Some bands on the thorns of B. minispinosa appeared to be much thicker than others, in contrast to the examples shown graphically in both Gallagher and Nolan (1999) and Henderson et al. (2004), which display evenly spaced bands. This may be an indication that the bands are not deposited in a predictable manner for all skate species.
Other studies have reached similar conclusions (Gallagher, 2000; Perez, 2005; Davis et al., 2007), and the collective results demonstrate that caudal thorns cannot be considered reliable structures for the age determination of all skate species. Although caudal thorns grow in size along with the skate, they are external and do not support any body weight, so may not grow in a temporally consistent manner. Further, because they are external they are subject to damage and erosion, which may wear down the banding pattern throughout the life of a fish.
Indirect validations based on mean MIR values and edge types were inconclusive for the vertebrae of B. minispinosa. The analysis was hindered by edge types that were difficult to discern and by a small sample size for months other than summer. In the months available, edge types did confirm a pattern of predominantly opaque bands deposited in summer (June–October), in agreement with Matta and Gunderson (2007), who found support for annual band deposition in another species of Bathyraja from the eastern Bering Sea, B. parmifera, using both MIR values and edge types. Although annual banding has not been validated directly for B. minispinosa, it was assumed for this study that a single band pair was deposited each year, because there is substantial evidence that this is true for other skate species (Holden and Vince, 1973; Ryland and Ajayi, 1984; Waring, 1984; Abdel-Aziz, 1992; Natanson, 1993; Sulikowski et al., 2005; Matta and Gunderson, 2007; Natanson et al., 2007). Given the high maximum age estimated for this species and others in the region (Ebert et al., 2009), and considering the management implications, it will be imperative to validate age estimates for skates in the North Pacific directly.
Whereas most teleosts begin to mature at between 40 and 80% of their maximum size (Beverton and Holt, 1959), elasmobranchs mature at a much larger relative size (Holden, 1974), and skates mature at between 75 and 90% of their maximum TL (Ebert, 2005), which may be an indication of greater vulnerability to overfishing. Size at maturity was at 67.4 cm TL (23.5 years) for female B. minispinosa and 70.1 cm TL (23 years) for males, corresponding to 75 and 84% of maximum observed length, respectively. The discrepancy between males and females in TL50 as a percentage of maximum size is a consequence of males maturing larger than females, but growing to a smaller maximum size. This difference may reflect a sampling bias rather than a biological difference between sexes. Perhaps larger males, or smaller mature males, in the population were not sampled by the opportunistic method used in this study. However, this would seem unlikely given that the largest female featured (89.5 cm TL) exceeded the maximum size currently reported in the literature (Mecklenburg et al., 2002; Ebert, 2005). The estimates of TL50 relative to maximum TL are lower than those of Ebert (2005) because of the larger maximum sizes included here, as well as the different estimates of TL50.
No difference in TL50 was detected between sexes. Many elasmobranch females mature larger than their male counterparts (Cortés, 2000), yet this is not always true in skates (Ebert, 2005; Ruocco et al., 2006; Ebert et al., 2008). Skates can have substantially different TL50 values between males and females, a possible reason lying in the reproductive biology and overall morphology of the fish. Skates demonstrate a single oviparous reproductive mode, only carrying two egg cases at a time rather than a dozen or more embryos. Internal space may not be as limiting to oviparous, dorso-ventrally flattened species, so female skates may not experience the evolutionary pressure to grow to large size compared with males, as may be the case in viviparous sharks and rays.
Age at maturity is a critical parameter for demographic modelling of elasmobranch populations, and therefore for fisheries management. No difference in this parameter was detected between sexes, indicating that the data from combined sexes may be used in demographic analysis. This is beneficial for the management of less common species such as B. minispinosa, because combining the data will provide larger sample sizes.
The life-history traits of B. minispinosa in combination with the relatively limited distribution and low abundance of the species probably render it especially susceptible to overexploitation. For this reason, directed skate fishing along the eastern Bering Sea continental slope is not supported by the results here. Annual or biannual slope surveys, such as the NMFS–AFSC survey, should be encouraged, however, to monitor skate abundance at a species-specific level. In particular, attention needs to be paid to the status of some of the less common, but longer-lived skate species such as B. minispinosa.
Acknowledgements
We are grateful to the many people from NMFS–AFSC who supported our work. In particular, we thank Jerry Berger, Lyle Britt, Sarah Gaichas, Jerry Hoff, Beth Matta, Jay Orr, and Duane Stevenson from NMFS–AFSC in Seattle for their input and cooperation in allowing us to participate on NMFS–AFSC survey cruises in the eastern Bering Sea. Lisa Natanson of NMFS Northeast Fisheries Science Center provided critical feedback and analytical support throughout the project. The help of students, alumni, and interns was also of importance, and we thank the following for their assistance: Joe Bizzarro, Chante Davis, Heather Robinson, Wade Smith, Megan Winton, and Jasmine Maurer (Pacific Shark Research Center/Moss Landing Marine Laboratories). Funding for the project was provided by the North Pacific Research Board under project 715 and by NOAA/NMFS to the National Shark Research Consortium and the Pacific Shark Research Center. Animal care approval was obtained from the Institutional Animal Care and Use Committee (IACUC #801) at San José State University. This is North Pacific Research Board contribution no. 291.


