


Abstract
The Food and Agriculture Organization (FAO) strategy for improving information on the status and trends of capture fisheries (FAO Strategy STF) was endorsed by Member States and the UN General Assembly in 2003. Its overall objective is to provide a framework, strategy, and plan to improve knowledge and understanding of the status and trends of fisheries as a basis for policy-making and management, towards conservation and sustainable use of resources within ecosystems. The FAO supports the implementation of FAO Strategy STF in developing countries through a project known as FAO FishCode–STF, and an initiative funded by the World Bank entitled the “BigNumbers project”. The BigNumbers project underscored the importance of small-scale fisheries and revealed that catches by and employment in this sector tend to be underreported. An inventory of data collection systems made under the FAO FishCode–STF project showed that small-scale fisheries are not well covered. Their dispersed nature, the weak institutional capacity in many developing countries, and the traditional methods used make routine data collection cumbersome. Innovative sampling strategies are required. The main priority is a sample frame for small-scale fisheries. Sustainable strategies are most likely to be found outside the sector through population and agricultural household censuses and inside the sector through the direct involvement of fishers.de Graaf, G. J., Grainger, R. J. R., Westlund, L., Willmann, R., Mills, D., Kelleher, K., and Koranteng, K. 2011. The status of routine fishery data collection in Southeast Asia, central America, the South Pacific, and West Africa, with special reference to small-scale fisheries. – ICES Journal of Marine Science, 68: 1743–1750.
Introduction
The UN's Food and Agriculture Organization (FAO) is the only international institution that reports on global fishery statistics. For 2008, these showed a total production of 142 million tonnes: 80 million tonnes from marine capture fisheries, 10 million tonnes from inland capture fisheries, and 52 million tonnes from aquaculture. These activities provide employment to 180 million people (FAO, 2011). However, in reporting to FAO, countries do not have to differentiate between their small- and large-scale sectors, resulting in the small-scale sector being generally undervalued.
Small-scale fisheries are often characterized by resource depletion, poor economic performance (manifest as poverty in fishing-dependent communities), food and/or nutritional insecurity, and social and cultural stress (Andrew et al., 2007; Bene et al., 2007). These issues are particularly acute in the developing world as a result of there being fewer alternatives for development and the absence of any social-security infrastructure. Historically, however, small-scale fisheries have received relatively little attention within both international and national agendas. This has resulted in a general lack of coherent, reliable, and accessible information on them. This information gap hinders the formulation of relevant policies for the sector, and the development of fishery- and water-management plans that include small-scale fisheries. In a global review of 281 national policy papers, including 50 on poverty-reduction strategies, in few countries did it appear that fishing communities were included among the target groups and that the fisheries sector was accorded an explicit role in poverty reduction and food security (Thorpe, 2004).
Knowledge of the status and trends of capture fisheries, including socio-economic aspects, is key to sound development of policy, better decision-making, and responsible fishery management. It is necessary at a national level for the maintenance of food security and for describing the social and economic benefits of fisheries. Such information is also essential for assessing the validity of fisheries policy and for tracking the performance of fishery management. With an increasing number of countries adopting schemes of decentralized management, including co-management, and many starting to embrace the ecosystem approach to fisheries (EAF), more accurate and timely information is required for managing fisheries and other aquatic resources in a responsible manner.
However, chronic problems of insufficient human and financial resources for data collection, or inefficient data collection schemes, have often resulted in poor-quality information that led to no or limited use of statistics for fishery management and policy development. Consequently, only dwindling support has been given to the systematic improvement of national fishery data and information collection systems. These challenges indicate that there is an urgent need to terminate this vicious cycle of problems.
Concerned about the persistent deficiencies in collection systems worldwide for fisheries data and information, FAO, at the request of its Committee on Fisheries (COFI), developed a strategy for improving information on status and trends of capture fisheries (FAO Strategy STF). COFI adopted the Strategy by consensus, and in 2003 it was endorsed by the FAO Council and by the UN General Assembly.
The FAO Strategy STF recognizes “that many small-scale and multi-species fisheries, particularly in developing countries, are not well monitored, are probably underestimated and consequently not adequately considered in the development of plans and policies for fisheries”. To assist implementation of the FAO Strategy STF, the FAO FishCode–STF Project became operational in November 2004. This carried out national inventories of routine data collection systems covering small- and large-scale fisheries and implemented part of the initiative by the World Bank, the WorldFish Center, and the FAO to reassess employment and production in small-scale fisheries (the BigNumbers project).
This paper summarizes the results of these activities and presents proposals for improving data collection in small-scale fisheries.
The importance of small-scale fisheries: the BigNumbers project
The BigNumbers project (World Bank, FAO, and WorldFish Center, 2010a) evaluated the status of small- and large-scale fisheries through case studies in the following 17 developing and 11 developed countries. The selected countries in the BigNumbers project are not a random or representative sample, but account for 55% of reported marine and inland catches. The case studies were executed in full collaboration with national authorities, with a view to progressively accounting for disparities and securing greater inclusion of previously unaccounted fishing activities. The required data came from routine data collection, ad hoc surveys, project reports, and expert knowledge from inside and outside the fishery sectors. For all countries, data were collected on (i) production, (ii) employment, (iii) fuel efficiency, and (iv) the fishery contribution to gross domestic product. The data were analysed in a standardized manner. Finally, the results for the selected counties were extrapolated to a global level using various raising factors. The methodology is described in the study report (WorldBank, FAO, and WorldFish Center, 2010a). A summary of the key global indicators for developed and developing countries resulting from this study are presented in Table 1.
Developing: Bangladesh, Cambodia, China, India, Indonesia, Myanmar, Thailand, Vietnam, Philippines, Ghana, Mozambique, Nigeria, Senegal, three countries around Lake Victoria (Kenya, Tanzania, Uganda), and Brazil.
Developed: Denmark, France, Greece, Italy, the Netherlands, Portugal, Spain, UK, Canada, Japan, and Norway.
Global data for small- and large-scale fisheries in developed and developing countries estimated by the BigNumbers project (WorldBank, FAO, and WorldFish Center, 2010a).
| Small-scale fisheries | Large-scale fisheries | ||||||
|---|---|---|---|---|---|---|---|
| Parameter | Marine | Inland | Total | Marine | Inland | Total | Total |
| Production (million tonnes) | |||||||
| Total annual catch | 34 | 14 | 48 | 56 | 1 | 57 | 105 |
| Developed | 6 | 1 | 7 | 22 | 0.5 | 22.5 | 29.5 |
| Developing | 28 | 13 | 41 | 34 | 0.5 | 34.5 | 75.5 |
| Employment (full time and part time; million people) | |||||||
| Number of fishers | 12.9 | 19.4 | 32.4 | 2.2 | 0.8 | 2.9 | 35.3 |
| Developed | 0.7 | 0.1 | 0.8 | 0.3 | 0.0 | 0.3 | 1.1 |
| Developing | 12.3 | 19.3 | 31.6 | 1.8 | 0.8 | 2.6 | 34.2 |
| Number of post-harvest jobs | 35.6 | 40.8 | 76.4 | 7.4 | 0.3 | 7.7 | 84.1 |
| Developed | 1.3 | 0.2 | 1.5 | 0.8 | 0.0 | 0.8 | 2.3 |
| Developing | 34.4 | 40.5 | 74.9 | 6.6 | 0.3 | 6.9 | 81.8 |
| Total workforce | 48.6 | 60.2 | 108.8 | 9.5 | 1.1 | 10.6 | 119.4 |
| Developed | 1.9 | 0.3 | 2.2 | 1.1 | 0.0 | 1.1 | 3.3 |
| Developing | 46.7 | 59.9 | 106.5 | 8.4 | 1.1 | 9.5 | 116.1 |
| Number of women employed | 17.6 | 32.5 | 50.1 | 6.7 | 0.3 | 7.0 | 57.1 |
| Developed | 0.8 | 0.1 | 1.0 | 0.4 | 0.0 | 0.4 | 1.4 |
| Developing | 16.8 | 32.3 | 49.1 | 6.3 | 0.3 | 6.6 | 55.7 |
The BigNumbers project demonstrated that, globally, 119 million persons depend directly on capture fisheries for their livelihoods, as full- or part-time workers. Nearly all (96%) of them live in developing countries (116 million), and the vast majority of fishers and fish workers (109 million) are employed in the small-scale sector. Almost half the workforce are female (57 million), of which 33 million work in inland fisheries. These figures do not include the aquaculture sector, nor people with other occupations (e.g. farmers) who engage in fishing only as an occasional or complementary source of food and income.
The FAO reported a total employment of 180 million persons, of which 156 million are in capture fisheries and 24 million in aquaculture. The difference between the BigNumbers project (119 million) and the FAO estimate (156 million) for capture fisheries is mainly related to the assumed ratios between primary jobs (fishers) and secondary jobs (processors, fish sellers, boat-builders). In the BigNumbers project, this was 1:2.4, whereas the FAO used a ratio of 1:3.0 (Valderrama et al., 2010; FAO, 2011). The BigNumbers project estimated a global production of 105 million tonnes, of which 90 million tonnes were derived from marine fisheries and 15 million tonnes from inland fisheries. Nearly half (45%, 48 million tonnes) of the global production comes from small-scale fisheries, of which 85% (41 million tonnes) is caught in developing countries (Table 1).
These results are slightly higher than the officially reported production of marine capture fisheries (80 million tonnes) and 50% more than the 10 million tonnes reported for inland fisheries (FAO, 2011). The global reported catches cannot be separated between small- and large-scale fisheries, but we argue that these differences are mainly related to data collection constraints in small-scale fisheries.
The distribution of these key indicators over low-income food deficient (LIFD) countries and non-LIFD countries (Table 2) shows that 33% of the global catch (34.2 million tonnes) comes from LIFD countries, and most of that (76%) is caught by small-scale fishers, The results further reveal the importance of small-scale fisheries for developing and LIFD countries, stressing the need to look at fisheries in a broad context with regard to, for instance, sustainable resource management, food security, and poverty alleviation.
Global catch data (millions of tonnes) for small- and large-scale fisheries in LIFD countries and non-LIFD countries, as estimated by the BigNumbers project (WorldBank, FAO, and WorldFish Center, 2010a).
| Small-scale fisheries | Large-scale fisheries | ||||||
|---|---|---|---|---|---|---|---|
| Countries | Marine | Inland | Both | Marine | Inland | Both | All fisheries |
| Non-LIFD | 15.3 | 6.7 | 22.0 | 48.0 | 0.7 | 48.8 | 70.8 |
| LIFD | 18.7 | 7.3 | 26.0 | 8.0 | 0.3 | 8.2 | 34.2 |
| All | 34 | 14 | 48 | 56 | 1 | 57 | 105 |
Structured approaches to routine data collection
The most important sources of data are long-term collections of information on fishing fleets and fishing effort, together with the associated landings in weight and value, biological information about the catches, trip costs, and details of crew and fishers. In most countries, this information is collected through routine data collection systems implemented by the fishery authorities. The collection and analysis of fishery data are costly and time-consuming, and the way in which data are collected is strongly influenced by the budget and personnel available, and the extent to which fishers and others cooperate. To be relevant and cost-effective, fishery data collection systems must have clear objectives and appropriate strategies; these should be based on the priorities and requirements of data users. Therefore, data collection requires a logically structured approach, as described in the guidelines for the routine collection of capture-fishery data (FAO, 1999). This includes a sequential pathway, starting from an understanding of why data are needed, leading to the questions “What data need to be collected?” and “How will data be collected?”.
Identifying the different policy issues and their information requirements, followed by comparing the requirements with available information, identifies gaps in national data collection systems. This approach was used in the inventories of such systems compiled by the FAO FishCode–STF project over the period 2005–2008.
Major issues in national fishery policies
The FAO FishCode–STF project, in close collaboration with regional fisheries organizations, constructed national inventories of routine data collection systems in four regions: Southeast (SE) Asia, central America, the South Pacific, and West Africa. These were prepared for regional workshops on the improvement of routine fishery data collection organized in collaboration with: the Southeast Asian Fisheries Development Center (SEAFDEC; FAO–SEAFDEC, 2005a, b), the Organización del Sector Pesquero y Acuícola del Istmo Centroamericano (OSPESCA; FAO–OSPESCA, 2010a, b), the Secretariat of the Pacific Community (SPC) in the South Pacific (FAO–SPC, 2010), the Fishery Committee for the Eastern Central Atlantic (CECAF), and subregional bodies (the Fishery Committee for the West Central Gulf of Guinea, FCWC, and the Regional Fisheries Committee for the Gulf of Guinea, COREP) in West Africa (FAO, 2010a, b, c). The inventories identified various fisheries policy issues and their information requirements. These requirements were then compared with collections and known availability.
The inventories indicated that, for many countries, the main issues in fishery policies are sustainable resource use, increased fish production, and earnings of foreign currency. Livelihood aspects, biodiversity/environment issues, and food security are only incorporated in fishery policies by about half the 48 countries studied. Food security is included slightly more often by LIFD countries than by others (Figure 1). When looking at the four regions (Figure 2), it seems that resource use is a major policy issue everywhere. Increased fish production and foreign currency earnings are major issues in central America and the South Pacific, whereas livelihood aspects are only well covered in the South Pacific.
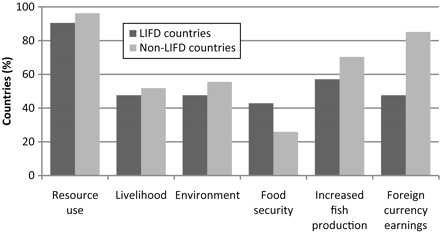
Main issues in the national fishery policies of 21 LIFD and 27 non-LIFD countries in SE Asia, the South Pacific, West Africa, and central America obtained from the FAO FishCode–STF project inventories.
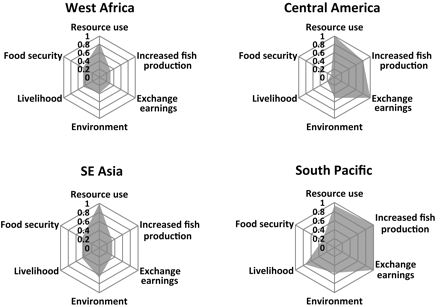
Main issues in the national fishery policies of West African, central American, South Pacific, and SE Asian countries obtained from the FAO FishCode–STF project inventories.
Major issues in fishery data collection
Socio-economic data collection
The traditional focus on resource management is also reflected in data collection. Only a few countries regularly collect information on fisher income (21%), employment in fisheries sectors (42%), number of households depending on fisheries (30%), fisher organizations (21%), and livelihood aspects (15%; Figure 3).
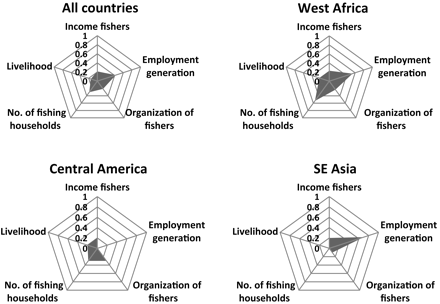
Socio-economic data coverage for the countries studied by the FAO FishCode–STF project in central America, SE Asia, and West Africa (no data were available for the South Pacific).
Data collection for resource management
Basic indicators for resource management are total catch, structural data (e.g. number of vessels), catch per unit effort (cpue), fishing effort, and catches allocated between major species.
The data collection inventories indicate that the basic indicators for resource management are reasonably covered for large-scale fisheries, but that there are huge gaps for small-scale fisheries (Figure 4). In SE Asia, the basic indicators for resource management are reasonably covered for both small- and large-scale fisheries, but a major constraint is still species composition. In the South Pacific, they are collected for large-scale fisheries, but there is almost no information for small-scale fisheries. In central America, the total catch and fishing effort are reasonably covered for large-scale fisheries, but again almost no data are collected for small-scale fisheries. In West Africa, the availability of resource-management indicators for both sectors is problematic (Figure 5).
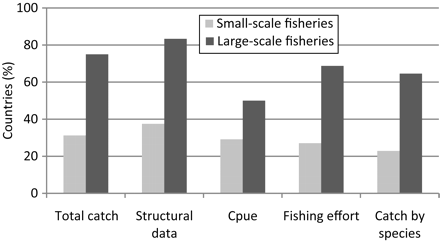
Coverage of basic data for resource management for small- and large-scale fisheries from routine data collection, as obtained from the FishCode–STF project inventories of the 48 countries studied.
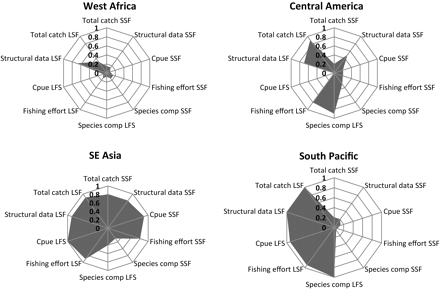
Coverage of basic data for resource management for small- (SSF) and large-scale fisheries (LSF) from routine data collection in West Africa, central America, SE Asia, and the South Pacific obtained from the FishCode–STF project inventories.
Discussion
Fishery statistics
The primary purpose behind collecting, compiling, and analysing capture-fishery statistics should be to support regional, national, and local decision-making in policy development, sectoral planning, and fishery management. However, the FAO FishCode–STF inventories reveal that data collection schemes often do not meet national objectives. The requirements of regional fishery-management organizations, and even those of FAO at a global level, are often cited as reasons for collecting statistics. Ideally, these considerations should be secondary (but nevertheless important) outputs of national statistical programmes. If this were more widely recognized, national support for improving fishery statistics could be enhanced, and donors might expand their support for such activities in developing countries. However, during the past decade, financial support for the development and maintenance of national fishery statistics has decreased sharply in real terms (WorldBank, FAO, and United Nations, 2010), although statistical requirements have increased dramatically. These now include all sorts of data, such as bycatch and discards, fishing capacity, illegal fishing, vessels authorized to fish on the high seas, economic factors (costs, revenues, prices, subsidies), employment, management systems, inventories of stocks and fisheries, and interactions with aquaculture. The increasing acceptance of the need to adopt management policies incorporating the EAF has contributed to these demands.
The results of the studies reported here do not come as any surprise, therefore. They simply confirm that although in many countries the traditional indicators such as total catch, its value, and export earnings are well covered, especially for industrial fisheries, there are major concerns about these data for small-scale fisheries. The officially reported global production (80 million tonnes) cannot be separated between industrial and small-scale fisheries (FAO, 2011). The BigNumbers project estimated the global production of marine fisheries to be 90 million tonnes, of which 34 million tonnes were from small-scale fisheries and 56 million tonnes from large-scale fisheries (WorldBank, FAO, and WorldFish Center, 2010a). This estimate is still in the range 80–100 million tonnes forecast by the FAO (Gulland, 1972; Grainger and Garcia, 1996; Garcia and Grainger, 2005). Therefore, although general trends are probably reasonably well reflected by the available global statistics, the actual figures reflect bias and, in particular, they underestimate the importance of the small-scale sector. This has obvious implications for policy-making, with the small-scale sector often being inadequately considered.
The FAO believes that working with individual countries is the only way to improve fishery statistics. The statistics are primarily for national needs with regard to policy actions and fishery management, but should also serve regional fishery bodies and economic organizations. In many countries, years of support have been provided by the FAO and donors to establish and enhance national data collection systems. However, once the external support is withdrawn, the systems often degenerate and eventually become dysfunctional. As revenues from the small-scale sector are often negligible, it is unlikely that scarce government funds will be directed in that direction. The only way to rectify current deficiencies is to change the data collection approach of fisheries line agencies.
A multisectoral approach and the importance of institutional cooperation
Government priorities will only change if the importance of small-scale fisheries for food security and employment is recognized; only then will small-scale fisheries be considered in the scope of national policies. For this to take place, however, further data are needed. There seems to be a vicious cycle: without additional funding, it may appear that these data cannot be collected. This is not the case, though, because the real constraint is often the single-fishery sectoral approach of line agencies. This is clearly illustrated by the poor coverage of socio-economic aspects of small-scale fisheries in national fishery data collections and policies. There is often limited crossover between sectors, and little awareness of important data on fisheries available from other government agencies working in rural development and agriculture. For small-scale fisheries, data on livelihoods, food security, poverty alleviation, and socio-economics are often collected through surveys implemented by these agencies. A more multisectoral approach among fishery agencies, along with better institutional cooperation, could strengthen the available information on small-scale fisheries with little or no financial implications. A multisectoral approach is indeed anticipated by the EAF. The urgent need for greater cooperation, involving social scientists and economists in fishery research and management, was realized while implementing the EAF in the Benguela Current large marine ecosystem area (Cochrane et al., 2007). However, such cooperation is often hampered by the tendency in fisheries research to focus on the socio-economics, followed by economic considerations inevitably dominating, but human conditions and perspectives cannot be reduced to economics alone (Cochrane et al., 2007).
Priorities and the minimum requirements
The long-term sustainability of data collection in small-scale fisheries, given the limitations on budgets and staff, can only be achieved through differentiating between “need-to-know” and “nice-to-know” information. Statistical requirements have increased dramatically over recent decades as the objectives of data collection moved gradually from the production of annual statistical yearbooks towards electronic fishery information systems (FISs). Unfortunately, it is often the case that the types of data targeted are adopted from applications elsewhere and are collected by fishery agencies without considering how they will be used or their application to management. Given the lack of funds and staff, it is essential to go back to basics, to set priorities, and to select the essential variables to be examined. This can best be achieved by following the structured approach described in the guidelines for routine data collection in capture fisheries (FAO, 1999). This means trimming the system by removing all “nice-to-know” variables.
The role of routine data collection
It must be realized too that the FIS data needed to support policies for the EAF, food security, poverty alleviation, and climate change cannot be collected through routine data collection alone. Routine data collection should be carried out in a robust and simple manner to provide the basic long-term data on fleet structures, number of fishers, landing sites, catches, species compositions, landing values, and sometimes fishing effort. Additional information, such as biomass, gear-based cpue data, biodiversity, state of the ecosystem, stock status, and socio-economic and livelihood aspects, should be covered through separate monitoring programmes, or insightful scientific research with its own adequate frequency of implementation. With limited human and financial capacity, the long-term sustainability of data collection in small-scale fisheries can only be guaranteed by focusing on the basics and applying appropriate statistical approaches.
Sample-based surveys
The dispersed character of small-scale fisheries implies that they can be covered only through sample-based surveys. The foundation of such a survey is “the sample frame” which is used to design the sampling scheme and to estimate the parameters of the target fishery. Statistical procedures for sample-based fishery surveys are well described in various guidelines, e.g. Caddy and Bazigos (1985), Sparre and Venema (1998), Stamatopoulos (2002), and Cadima et al. (2005). For small-scale fisheries, these are often subject to budget and staff constraints, leading to statistically invalid results. However, the cost of data collection in small-scale fisheries could be minimized without violating statistical procedures, by changing the approaches to establishing the sampling frame and the sampling methodology.
The sampling frame
Structural information on the number, characteristics, and spatial distribution of vessels, gears, fishers, landing sites, and fishing communities is traditionally obtained through a frame survey, which is essentially a fishery census (Bazigos, 1974). These should be updated regularly, but this does not happen often because of their high cost. For example, the last marine frame survey in Bangladesh was carried out in 1984/1985, and in Nigeria, the 1976 survey was only updated in 2006. In Benin, frame surveys are only done if donor funds are available, and in Guinea, the first inland survey was made in 2010. This explains why outdated and unreliable structural information was indicated as a major bottleneck for the assessment of small-scale fisheries in central America and West Africa (FAO–OSPESCA, 2010a; FAO, 2010a, c). However, some alternative approaches could be considered.
Vessel registers and licenses
In many countries, the fishery regulations allow for or oblige small-scale fishing vessels to be registered, and boat-owners must have an official license to fish. Full registration, combined with the licensing and numbering of vessels, could provide basic structural data on small-scale fisheries, so could replace frame surveys. In China, this system is in place for professional small-scale inland fisheries, but unfortunately it has not been implemented in most other countries.
Use of external resources
For inland fisheries, the BigNumbers project indicated a global annual production of some 15 million tonnes, and employment in this sector at about 61 million people (Table 1). These figures do not include subsistence or occasional fishers. The case studies examined in the BigNumbers project showed massive underreporting of subsistence fisheries, whose contribution to food security and poverty alleviation in developing countries is not sufficiently recognized (WorldBank, FAO, and WorldFish Center, 2010b). Again, the main bottleneck is the sample frame, and the lack of information on how many people/households are engaged in subsistence fisheries. Structural information on subsistence fisheries cannot be obtained through frame surveys or registration. The only way to obtain a good sample frame is to make use of external resources, e.g. by including fishery questions in more general activities such as a population or agricultural census. In Vanuatu, for example, three fishery-related questions have been incorporated in the census questionnaire: (i) household uses a private canoe/boat, (ii) household uses a shared/community canoe/boat, (iii) household fishes for subsistence and/or commercial purposes. Therefore, subsistence- and commercial-fishing households have been identified, and their boats enumerated and located. This type of information demonstrates how cost-effective sample-based household surveys can be constructed (FAO–SPC, 2010).
Sampling approaches and methods
Fishery scientists are often responsible for the design and implementation of routine data collection systems. Because of their involvement in fishery management, they tend to put high demands on such systems by asking for too many variables to be covered in the field. This not only makes data collection difficult, but may also result in statistically unreliable data as a consequence of low sample sizes. Traditionally, fishery agencies opt for direct measurement of the catches at the landing sites. Sampling the vessel landings is time-consuming, and it should be discussed whether the landing of all species should be recorded by routine data collection systems. Resource limitations (time available for sampling and budget) determine how many samples can be taken monthly, and if they are too few, the overall results will be statistically invalid. Statistical accuracy could be improved, however, by routinely recording only those species covered by a fishery-management plan, whereas the full species composition of the landings could be determined through separate scientific surveys.
Although it is likely that better information would result from direct measurement, data collection by fishers sending catch reports to an agency can be a viable and cheaper option. Boat owners and fishers know their daily catch even to species level, and they know how long they have been fishing. Providing them with a simple logbook, to be completed on a voluntary basis, or within a co-management scheme could have beneficial results.
The use of proxy indicators is also an option, especially for subsistence fisheries. The direct measurement of catch and effort is extremely difficult in subsistence fisheries, so estimated total catches based on fish-consumption data could be used to determine the likely level of subsistence production (WorldBank, FAO, and WorldFish Center, 2010b).
Availability of information on small-scale fisheries
Fishery managers have mainly focused on large-scale industrial fisheries, partly because they are more visible, tend to be urban, and produce much of the fish entering international trade. In contrast, the contribution of small-scale fishers, subsistence production, and inland fisheries is often grossly underestimated. As a result, the real economic importance of the small-scale sector often remains hidden and is neglected in national, regional, and local policies and plans. Raising awareness of small-scale fisheries is particularly relevant not only because the livelihoods of many people depend on them, but also because they provide nutritious food and some degree of security for many poor households in developing countries. In such countries, small-scale fisheries also underpin the social fabric of many communities (WorldBank, FAO, and WorldFish Center, 2010a). Awareness of their importance can be improved at national, regional, and global level through:
disaggregation of fishery statistics at country level into large- and small-scale fisheries;
agreement on the key indicators for the different fisheries sectors to permit effective policy formulation and tracking of progress and trends;
development of partnerships at regional and global levels to improve the quality and availability of key information on small-scale fisheries to support and improve the capacity for appropriate data collection and analysis, particularly in developing countries.
Conclusions
These studies have shown the importance of small-scale fisheries and reveal that their catches and employment tend to be greatly underreported. The collection of basic data on small-scale fisheries needed for resource management is unsatisfactory. Their dispersed nature, the weak institutional capacity in many developing countries, and the proposed approaches originating from developed countries, make routine data collection difficult. Innovative sampling strategies are required. The main priority is to determine the best sample frame for small-scale fisheries. Sustainable strategies are most likely to be found outside that sector, taking the direct involvement of fishers away from data collection.
