-
PDF
- Split View
-
Views
-
Cite
Cite
Joseph Kane, Multiyear variability of phytoplankton abundance in the Gulf of Maine, ICES Journal of Marine Science, Volume 68, Issue 9, September 2011, Pages 1833–1841, https://doi.org/10.1093/icesjms/fsr122
Close - Share Icon Share
Abstract
Significant interannual changes in phytoplankton abundance were identified in the Continuous Plankton Recorder time-series collected in the Gulf of Maine from 1961 to 2008. Abundance levels of nearly all the common taxa began to increase in 1990 and remained elevated through 2001. During that period, total numbers were above average throughout the year, with an unusual bloom in late summer. Multivariate analysis of abundance identified three consecutive multiyear periods of varying abundance levels: low to average from 1961 to 1989, above average or very high from 1990 to 2001, and below average thereafter, through 2008. Phytoplankton abundance patterns were closely aligned to the rising trends displayed by several of the common zooplankton taxa. The North Atlantic Oscillation was the only environmental variable examined that showed some association with time-series abundance trends of plankton. The index was primarily positive in the 1990s, which would favour the propagation of warm, nutrient-rich slope water into the region. Perhaps the increased influx of this water, along with feedback enrichment from abundant zooplankton stocks and reduced top-down control by the relative scarcity of the dominant copepod Calanus finmarchicus, combined with a low salinity to make the 1990s a unique decade for plankton change in the Gulf of Maine.Kane, J. 2011. Multiyear variability of phytoplankton abundance in the Gulf of Maine. – ICES Journal of Marine Science, 68: 1833–1841.
Introduction
US Fisheries managers have been mandated to adopt the ecosystem-based fishery management of stocks under their jurisdiction (Rosenberg et al., 2000). The approach includes the assessment of how variability in environmental factors and the abundance of lower trophic levels influence stock recruitment. Understandably, most marine research in the Northwest Atlantic has focused on higher trophic levels, with less attention paid to the phytoplankton community at the base of the foodweb. However, monitoring long-term trends in phytoplankton is crucial to understanding the biological responses to anthropogenic and natural oscillations within marine ecosystems. Basic changes to phytoplankton community structure could resonate up through the entire foodweb and impact upper trophic levels that are of commercial and ecological importance.
The Gulf of Maine (herein referred to as GOM) is a large, semi-enclosed shelf sea of the Atlantic Ocean off the northeastern coast of North America. The pioneering work of Henry Bigelow first described the abundance and seasonal progression of phytoplankton biomass in the region (Bigelow, 1914, 1924). It is now generally accepted that the larger components of the phytoplankton community present in NW Atlantic shelf waters usually follow an annual cycle that begins with a spring diatom bloom, followed by dinoflagellate dominance in summer. In most regions, a secondary pulse evident during autumn is strongly dominated by dinoflagellates offshore and weakly dominated by them nearshore (O'Reilly and Zetlin, 1998). Many studies in the GOM (e.g. Lillick, 1938; Hurlburt and Corwin, 1970; Marshall, 1976) have described the temporal and spatial patterns of the common phytoplankton species that inhabit the region.
The GOM is under the influence of several hydrodynamic forces that affect physical–biological interactions throughout the region. These include the surface influx of cold water low in salinity from the Scotian Shelf (Mountain, 2004) and the deep-water inflow of warm, more-saline slope water through the Northeast Channel (Ramp et al., 1985). Recent studies have shown that zooplankton community structure in the GOM shifted to a greater dominance by smaller species when salinity decreased during the early 1990s (Pershing et al., 2005). This low-salinity water originated from far north, off Labrador (Houghton and Fairbanks, 2001), perhaps caused by increased export of freshwater from the Arctic as a result of local warming (Greene and Pershing, 2007). GOM zooplankton population trends have also been linked to the changing climatic conditions associated with the variability of the North Atlantic Oscillation (NAO; Conversi et al., 2001; Greene and Pershing, 2001). It is unknown whether these physical changes have also transformed phytoplankton community structure in the GOM.
The Continuous Plankton Recorder (CPR) survey was initiated in the GOM in 1961 and provides a unique spatial and temporal time-series of plankton observations for the region. Great care has been taken to maintain consistency in both collection and analysis of the samples. Although many studies have examined zooplankton variability with this dataset (Jossi and Goulet, 1993; Conversi et al., 2001; Pershing et al., 2005; Kane, 2009), the phytoplankton time-series has never been analysed. However, it should be stressed that the sampler collects only semiquantitative information on phytoplankton and that the mesh used does not capture small species. Another important caveat is that because the CPR only samples at an approximate depth of 10 m, the catch will be biased towards species that favour the upper surface layer. Despite these drawbacks, the sampler does capture a consistent fraction of each taxon that can be used to monitor the distribution, abundance, and community composition of phytoplankton (Robinson, 1970; Richardson et al., 2006).
This study examines the interannual variability of phytoplankton species composition and abundance collected by the CPR from 1961 to 2008. Multivariate analysis was used to determine whether phytoplankton community structure changed during the time-series. In addition, to assess the link between phytoplankton and environmental variability, phytoplankton abundance trends were compared with year-to-year variations in temperature, salinity, zooplankton abundance, and climatic indices.
Methods
Plankton data
Monthly plankton surveys in the GOM have been conducted by NOAA Fisheries since 1961 using CPRs towed by ships of opportunity. The sampler was towed for ∼450 km between the Massachusetts coast and Cape Sable, Nova Scotia. As the vessels followed slightly different courses over the years, a polygon was developed to define the region surveyed by the CPR (Jossi and Benway, 2003; Kane, 2009). The recorder collects plankton at ∼10 m depth as it was towed at speeds between 10 and 17 knots. Water enters the CPR through a 1.61-cm2 aperture and is filtered through bolting silk of 0.270 mm mesh. A second layer of silk covers the first, and both were spooled into a tank containing 4% formaldehyde. In the laboratory, the silk roll was unwound and cut into pieces representing 18.5 km sections that were assigned geographic positions and reference distance values (kilometre from standard transect origin). Filtering efficiency was assumed to be 100%, with each sample representing 3 m3 of water.
Alternate sections of silk were examined for phytoplankton and zooplankton using the standard techniques described by Batten et al. (2003). Phytoplankton species were enumerated as the number of times the taxon was present in 20 fields of view across each sample. These 20 fields amount to 1/10 000 of the area of the filtering silk. This number is then converted to a semiquantitative estimate of phytoplankton abundance using the techniques described by Robinson and Hiby (1978). Counts from the 4342 samples analysed in this study are reported here as numbers m−3.
Annual abundance indices were calculated for each of the species and cumulative taxa categories examined in this analysis. The data were log10(n + 1)-transformed and the average annual cycle of each taxon's abundance was computed by fitting a spline curve function to the time-series monthly mean abundance values. Anomalies from the seasonal cycle were then averaged over each year to produce an annual abundance index. Although the CPR survey attempts to collect data every month along the entire transect, weather or financial constraints sometimes prevented operations. Surveys that did not have at least five samples or that had poor spatial coverage were classified as incomplete and excluded from the analysis. Survey coverage of the region in 1963 and from 1974 to 1977 was too sparse to calculate an annual anomaly.
The cumulative phytoplankton taxa categories include the phytoplankton colour index (PCI), which was determined by matching the green staining of the CPR silk to one of four values on a standard colour chart that represents a semi-quantitative estimate of phytoplankton biomass. The other categories presented here are the total sums of all diatoms, dinoflagellates, and species identified in each sample.
Zooplankton taxa categories examined here include life-stage groupings of the five most common copepod species, the total counts of all protozoans, and the total number of all identified taxa. The Calanus spp. CI–CIV counts are primarily Calanus finmarchicus (Pershing et al., 2005). Annual anomalies of these zooplankton cumulative indices were calculated using the same methods that were described earlier for phytoplankton taxa.
Biodiversity was quantified using taxonomic richness, which has been shown to be the best diversity index for a large CPR dataset (Beaugrand and Edwards, 2001). A value was calculated for each sample from complete surveys, then averaged for the year.
Environmental data
Surface and bottom measurements of temperature and salinity were made routinely on CPR surveys (Jossi and Benway, 2003). These measurements were also made on broad-scale surveys of the GOM from 1978 on (Mountain, 2004). Annual anomalies of each measurement collected within the CPR polygon were calculated using the same methods described earlier for plankton abundance data.
Plankton abundance was compared with two broad-scale indices of climate variability known to affect physical and biological measurements across the North Atlantic: (i) the winter phase of the North Atlantic Oscillation (NAO), and (ii) the Atlantic Multidecadal Oscillation (AMO). The NAO is an index that is based on the difference of normalized sea-level pressures between Lisbon, Portugal, and Stykkisholmur/Reykjavík, Iceland, from December through March (Hurrell, 1995). Changes in the NAO influence the temperature and volume transport of water in the GOM. As previous studies have linked plankton dynamics with 2-year lagged values of the NAO (Greene and Pershing, 2001), here I also examine the lag relationships between variables. The AMO is a mode of natural variability in the North Atlantic that is associated primarily with long-duration changes in sea surface temperature (Kerr, 2000). It is characterized by alternating cool and warm phases that last several decades.
Data analysis
Multivariate techniques using the PRIMER 6.1.5 software package (Clarke and Warwick, 2001) were used to detect interannual trends in samples and to explore the relationships between the different datasets. Initially, the biotic relationship between any 2 years was represented by the Bray–Curtis index (Bray and Curtis, 1957), which measures the similarity (or dissimilarity) in species composition. The triangular matrix of similarity between each pair of years was then classified into groups using two techniques: (i) hierarchical agglomerative cluster analysis with similarity permutation tests (SIMPROF), to delineate significant groupings, and (ii) non-metric multidimensional scaling (MDS). Clusters of statistically significant (p < 0.05) years that were also isolated by low stress (<0.20) MDS ordinations were judged to be years with similar phytoplankton community structure. Analysis of similarity percentages (SIMPER) was used to identify the taxa responsible for the dissimilarity between these groups of years. Principal component analysis (PCA) of the abundance anomaly time-series was also performed to examine relationships in the data. Plots of the first two principal components provided a means of identifying similar years and portraying long-term trends.

Results
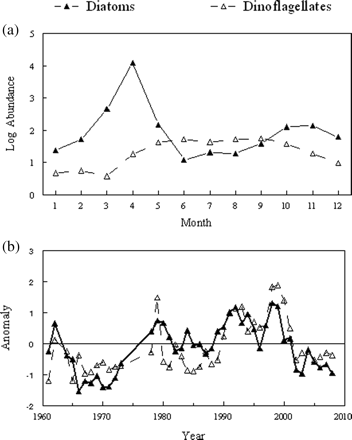
Diatoms and dinoflagellates dominate the phytoplankton community sampled by the CPR in the GOM. These two groups made up 93.9% of the total number of cells captured along the transect during the time-series. As is typical of temperate waters, the larger diatoms dominated the spring bloom and usually peaked during April, with a secondary, minor bloom in October/November (Figure 1a). The less-abundant dinoflagellates increased rapidly from their annual minimum in March and remained elevated from May to September (Figure 1a). Previous studies have described similar observations for this region (e.g. O'Reilly and Zetlin, 1998).
(a) Average monthly log10 means (number m−3), and (b) annual abunndance anomalies for total diatom and dinoflagellate counts measured by CPR samplers in the GOM Maine from 1961 to 2008.
Despite the inherent differences between the two major phytoplankton groups, their interannual abundance trends were remarkably similar (r = 0.62, p < 0.01). Both could be described roughly as low in the 1960s and early 1970s with a pulse in the late 1970s, variable in the 1980s with most years below average, above average from 1990 to 2001, and below average from 2002 on (Figure 1b). The most striking pattern in the time-series for both groups was the persistent above-average values measured throughout the 1990s.
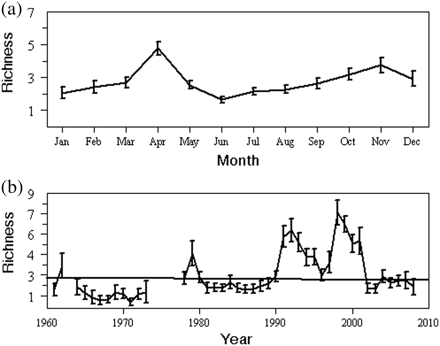
There was also a strong seasonal signal in phytoplankton diversity (Figure 2a). Species richness increased slowly through winter and peaked during April. It then declined sharply for 2 months before slowly increasing again through November. The most notable feature of the diversity time-series was the sharp increases in the early and late 1990s (Figure 2b). Like abundance, taxonomic richness was above average from 1990 through 2001.
(a) Seasonal cycle and (b) inter-decadal trends in phytoplankton biodiversity. The bars show 95% confidence intervals.
Multivariate analysis of phytoplankton community structure was restricted to the 25 taxa whose presence was ≥1% (Table 1). The cumulative abundance of these taxa constituted 96.1% of the total phytoplankton cells collected during the time-series. The timing of the annual abundance peaks varied among species, with most occurring in spring and autumn (Table 1). The three most abundant taxa captured were the diatoms Thalassiosira spp., Rhizosolenia hebetata semispina, and Phaeoceros spp., whose numbers all peaked during April. The next most abundant taxa were the dinoflagellates Ceratium tripos and Ceratium longipes, which peaked during September and June, respectively.
Time-series of mean abundance (number m−3) and proportions of the common phytoplankton taxa captured by the CPR sampler in the Gulf of Maine between 1961 and 2008.
| Taxon . | Type . | Maximum . | Mean . | Frequency . | Composition . | Cumulative . |
|---|---|---|---|---|---|---|
| Thalassiosira spp. | Diatom | April | 5 636 | 22.9 | 21.9 | 21.9 |
| Rhizosolenia hebetata semispina | Diatom | April | 2 784 | 14.1 | 10.8 | 32.7 |
| Phaeoceros spp. | Diatom | April | 2 219 | 18.7 | 8.6 | 41.3 |
| Ceratium tripos | Dino | September | 1 885 | 14.3 | 7.3 | 48.6 |
| Ceratium longipes | Dino | June | 1 814 | 17.5 | 7.0 | 55.6 |
| Silicoflagellatae | Other | November | 1 466 | 11.1 | 5.7 | 61.3 |
| Hyalochaete spp. | Diatom | April | 1 416 | 14.1 | 5.5 | 66.8 |
| Ceratium fusus | Dino | November | 1 350 | 15.3 | 5.2 | 72.1 |
| Thalassiothrix longissima | Diatom | April | 1 333 | 8.7 | 5.2 | 77.2 |
| Thalassionema nitzschioides | Diatom | April | 1 329 | 11.8 | 5.2 | 82.4 |
| Nitzschia seriata | Diatom | November | 901 | 6.1 | 3.5 | 85.9 |
| Coscinodiscus spp. | Diatom | November | 675 | 8.1 | 2.6 | 88.5 |
| Ceratium macroceros | Dino | November | 379 | 4.9 | 1.5 | 90.0 |
| Rhizosolenia alata alata | Diatom | November | 311 | 4.7 | 1.2 | 91.2 |
| Ceratium lineatum | Dino | November | 194 | 3.4 | 0.8 | 91.9 |
| Skeletonema costatum | Diatom | October | 191 | 2.2 | 0.7 | 92.7 |
| Ceratium arcticum | Dino | May | 151 | 2.0 | 0.6 | 93.3 |
| Peridinium spp. | Dino | May | 123 | 3.2 | 0.5 | 93.7 |
| Rhizosolenia imbricata shrobsolei | Diatom | November | 118 | 1.5 | 0.5 | 94.2 |
| Biddulphia aurita | Diatom | April | 115 | 1.2 | 0.4 | 94.6 |
| Ditylum brightwellii | Diatom | November | 101 | 1.2 | 0.4 | 95.0 |
| Prorocentrum micans | Dino | November | 88 | 1.4 | 0.3 | 95.4 |
| Corethron criophilum | Diatom | November | 82 | 1.5 | 0.3 | 95.7 |
| Dinophysis spp. | Dino | September | 61 | 1.5 | 0.2 | 95.9 |
| Phaeocystis | Other | June | 39 | 1.0 | 0.2 | 96.1 |
Maximum, month of maximum abundance; Frequency, frequency of occurrence; Composition, percentage composition; Cumulative, cumulative percentage composition; Dino, dinoflagellate.
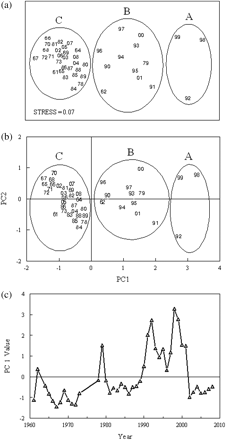
Cluster analysis and the underlying SIMPROF procedure delineated three major groupings of years with significantly (p < 0.01) different community structure: (Group A) 1992, 1998, 1999; (Group B) 1962, 1979, 1990, 1991, 1993–1997, 2000, 2001; (Group C) 1961, 1964–1973, 1978, 1980–1989, 2002–2008. The MDS ordination plot reinforced the cluster dendrogram, partitioning and aligning the years into similar groupings (Figure 3a). The 0.07 stress value indicated that the ordination provided a good representation of community structure.
Results of the (a) MDS, and (b) PCA of annual phytoplankton commmunity structure in the GOM, 1961–2008. Encircled groups are the years strongly grouped by cluster analysis. (c) Principal component time-series for the dominant mode.
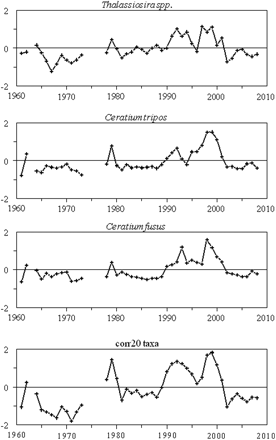
The PCA ordination of the annual anomalies also placed the same years close together, providing further proof that annual abundance patterns were similar in these three groupings (Figure 3b). The first principal component explained 65.3% of the total variation in the phytoplankton community. When viewed as a time-series, the first principal component captures the leading interannual pattern displayed by the phytoplankton community (Figure 3c). On an interdecadal time-scale, PC1 displayed the same prominent feature as the abundance indices: an increase in the early 1990s that persisted until 2001. It assigned positive weights to nearly all taxa, with the three largest values assigned to Ceratium tripos, Thalassiosira spp., and Ceratium fusus. These three species, which peak during different months (Table 1), were all abundant during the 1990s (Figure 4). The SIMPER procedure (results not shown) also showed that the abundance variability of these species were most responsible for splitting the years into the three cluster groupings. The second principal component accounted for 11.2% of the total variance. This mode assigned strong positive weights to the diatoms Phaeoceros spp. and R. hebetata semispina. The time-series associated with it was highly variable, with weak positive values throughout the 1980s. Together, these two components captured 76.5% of the total variance in the phytoplankton dataset.
Annual abundance anomalies of the three phytoplankton taxa most responsible for the dissimilarities that partioned the time-series into three major groups of years. Also shown is the annual anomaly time-series of the combined abundance for the 20 species positively correlated with each other.
Species associations were examined in greater detail by calculating pairwise correlation coefficients between annual abundance anomalies. In total, 20 of the taxa had positively correlated interannual trends, most of them statistically significantly (p < 0.01; data not shown). As expected, the trend of the combined abundance from these taxa (referred to herein as the corr20 group) show the shift to greater abundance in the 1990s, demonstrated by the cumulative indices and the dominant species (Figure 4).
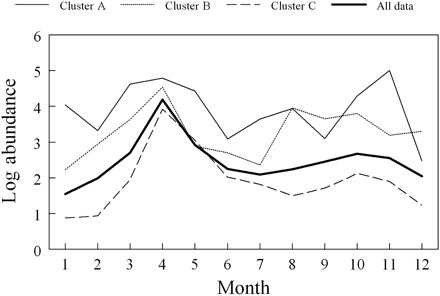
The different cluster groupings had substantial differences in the magnitude and shape of the annual cycle. Phytoplankton counts for groups A and B were much higher than for group C during the second half of the year and into winter (Figure 5). The average pattern for these years also reveals a late summer increase and a pronounced autumn bloom. There was no evidence of a late-summer surge in the group C years, and the autumn bloom was usually small. The abundance gap between the clusters diminished during the spring maximum (Figure 5).
The annual cycle of total phytoplankton counts (number m−3) for all data, and for the three groups of years identified by multivariate analysis.
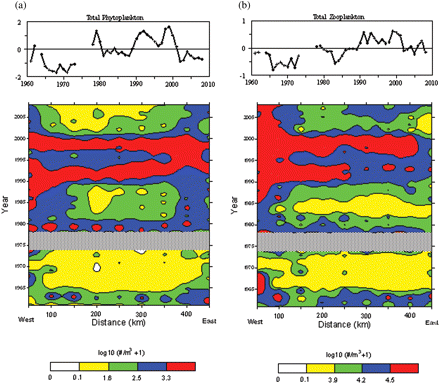
Annual anomalies of total zooplankton and phytoplankton counts were highly correlated with each other (r = 0.79, p < 0.01). Trend lines were not identical, but both demonstrate low abundance from the mid-1960s through the early 1970s, and above-average values during the 1990s (Figure 6). Distribution maps of both phytoplankton and zooplankton total counts along the transect clearly show that these high and low periods were not spatially restricted, but were present throughout the GOM (Figure 6). Numbers declined in the 2000s, but both groups continued to be common in westernmost waters. Abundance trends of individual zooplankton taxa groupings were also highly correlated with overall phytoplankton counts, except for the dominant copepod C. finmarchicus (Table 2). Early life stages of this large herbivore were positively correlated (r = 0.36), but correlation coefficients between late-stage copepodites and phytoplankton cumulative indices were all negative (Table 2). It is of note that none of the zooplankton indices were significantly correlated with the PCI (Table 2).
Spearman's correlation coefficients between zooplankton and phytoplankton annual abundance anomalies measured along the GOM CPR transect with the asterisk indicating variables judged to be significantly correlated (p < 0.01).
| Taxon . | Total phytoplankton . | Phytoplankton colour . | Corr20 group . |
|---|---|---|---|
| Total zooplankton | 0.79* | 0.29 | 0.80* |
| Calanus spp. CI–CIV | 0.36 | 0.08 | 0.37 |
| Centropages typicus CIV–CVI | 0.67* | 0.27 | 0.68* |
| Calanus finmarchicus CV–CVI | −0.10 | −0.11 | −0.12 |
| Pseudocalanus spp. | 0.60* | 0.15 | 0.61* |
| Oithona spp. CIV–CVI | 0.86* | 0.37 | 0.85* |
| Protozoa | 0.44* | 0.05 | 0.44* |
C, copepodite stage.
Annual abundance anomalies and distribution of (a) total phytoplankton and (b) zooplankton counts measured by CPR samplers in the GOM from 1961 to 2008.
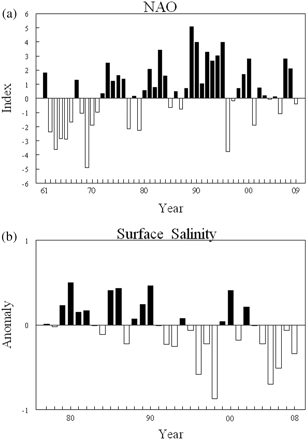
The NAO was the only environmental variable for which the interannual trend was strongly associated with phytoplankton abundance. The annual patterns of total phytoplankton counts, total diatoms, the corr20 group, and one of the dominant taxa were significantly correlated (p < 0.05) with the NAO (Table 3). Phytoplankton levels were low during the 1960s when the winter NAO was mainly negative (Figures 6a and 7a). The reverse was observed in the 1990s, when phytoplankton anomalies and the NAO were both primarily positive (Figures 6a and 7a). Correlation coefficients were higher and significant, with more taxa at 2-year lag intervals (Table 3), the time necessary to pass before upstream conditions impact water in the GOM.
Spearman's correlation coefficients between annual abundance anomalies of phytoplankton cumulative groupings and the five most abundant taxa with climatic and environmental variables.
| Taxon . | NAO index . | NAO LAG2 . | AMO index . | Surface temperature . | Bottom temperature . | Surface salinity . | Bottom salinity . |
|---|---|---|---|---|---|---|---|
| Corr20 group | 0.33* | 0.46** | 0.10 | −0.03 | 0.12 | 0.02 | −0.28 |
| PCI | 0.13 | 0.26 | −0.08 | −0.08 | 0.01 | −0.07 | −0.01 |
| Total phytoplankton | 0.33* | 0.48** | 0.07 | −0.02 | 0.15 | 0.06 | −0.26 |
| Diatoms | 0.36* | 0.43* | −0.01 | 0.00 | 0.14 | 0.12 | −0.19 |
| Dinoflagellates | 0.15 | 0.32* | 0.31 | 0.02 | 0.11 | −0.28 | −0.36 |
| Thalassiosira spp. | 0.21 | 0.46** | 0.11 | −0.06 | 0.18 | −0.16 | −0.31 |
| Rhizosolenia hebetata semispina | 0.36* | 0.24 | −0.09 | −0.04 | −0.06 | 0.17 | 0.03 |
| Phaeoceros spp. | 0.18 | 0.54** | 0.00 | −0.32 | 0.00 | −0.12 | 0.20 |
| Ceratium tripos | 0.11 | 0.36* | 0.25 | 0.15 | 0.33 | −0.11 | −0.30 |
| Ceratium longipes | 0.16 | 0.28 | 0.20 | −0.19 | −0.07 | −0.35 | −0.31 |
NAO, North Atlantic Oscillation; AMO, Atlantic Multidecadal Oscillation; PCI, phytoplankton colour index.
*Significant correlations at p < 0.05.
**Significant correlations at p < 0.01.
Time-series of annual values for (a) the winter NAO index from 1961 to 2008, and (b) anomalies of surface salinity measured in the GOM since 1977.
Discussion
The phytoplankton community in the GOM changed dramatically in the early 1990s. Abundance levels of nearly all the common taxa increased sharply and remained elevated through 2001. The surge was not seasonal during this period; total numbers were above average throughout the year, with an unusual bloom in late summer. Diversity also increased sharply in the 1990s, topping out in the early and late years of the decade. Multivariate analysis of annual abundance anomalies supported these findings by classifying the time-series into three multiyear periods defined by varying abundance levels. Although a few above-average years (1962, 1979) fall outside the classification period, phytoplankton abundance trends in the GOM can be summarized as follows: low–average in the 1960s through the late 1980s, above average or very high from 1990 to 2001, and below average thereafter, through 2008.
This study is one of many that have demonstrated that the 1990s was a highly productive period for plankton stocks in the western North Atlantic. CPR and net data have shown that during that decade, the zooplankton populations in the GOM and the adjacent Georges Bank region increased and underwent a community shift, where the abundance of smaller copepod species increased by an order of magnitude and that of larger ones declined (Pershing et al., 2005; Kane, 2007). Biodiversity of the CPR zooplankton time-series in the GOM also increased sharply during the 1990s and remained high through 2001 (Record et al., 2010). Increases in zooplankton and phytoplankton stocks were also reported on the Newfoundland and Scotian shelves (Head and Sameoto, 2007).
The decadal increases were all associated with freshening of the upper surface waters. This low-salinity water originated from far north, off Labrador, and its influx affected inshore waters from the Canadian shelf to the Mid-Atlantic Bight (Mountain, 2004). As the results of field studies in the GOM noted that low salinity during winter increased stratification enough to enhance winter phytoplankton production (Durbin et al., 2003), investigators speculated that increased phytoplankton may have fuelled the changes to the zooplankton community (Pershing et al., 2005; Kane, 2007). The results of the present study confirm that hypothesis by showing that phytoplankton food stocks were extraordinarily high during the 1990s. However, extension of the time-series into the late 2000s has shown that surface freshening alone was not the only factor that triggered increased production in the 1990s. Salinity indices in the GOM from 2003 to 2008 were all negative, with values in 2005 and 2006 comparable with the low salinities recorded in the late 1990s (Figure 7b). There was no evidence that this low salinity led to increased production at the base of the food chain. Total phytoplankton counts were all below average during the 2000s (Figure 6a).
Annual abundance anomalies reflect year-round processes in the GOM. Low values of surface salinity would enhance phytoplankton growth mainly during winter, when it would reduce vertical mixing and concentrate cells in the euphotic zone. Numerical studies have now confirmed that low salinity can cause early blooms on the Scotian Shelf and in the eastern GOM (Ji et al., 2008). However, the model also revealed that the early drawing down of nutrients and the low mixing associated with fresher waters would combine and reduce overall spring productivity. This would explain why total phytoplankton counts during the April maximum in the 1990s were not substantially higher than the values recorded in the preceding and subsequent decades (Figure 6a). What triggered the high summer/autumn production during the 1990s is uncertain. As part of the nutrient pool used by phytoplankton is derived from recycling of zooplankton excretory products, it is likely that top-down input from the high zooplankton stocks of the decade was a contributing factor. Moreover, because rates of excretion are size-dependent, with larger zooplankton producing less mass than smaller organisms, the large stocks of small copepod species during the 1990s would have promoted increased recycling of production in summer surface waters that would have enhanced phytoplankton biomass. Studies have shown that faecal pellets of microzooplankton and small mesozooplankton are mostly recycled or reprocessed in the water column by microbial decomposition and coprophagy, contributing more to processes in the water column than to benthic ecosystems (Turner, 2002). Similar patterns observed in CPR data collected in the northern North Atlantic led Colebrook (1982) to speculate that zooplankton influenced phytoplankton abundance through some feedback mechanism, which was probably nutrient recycling. Top-down control and possible trophic cascading has been demonstrated with CPR data from the Eastern Scotian Shelf (Frank et al., 2005). Those authors found an increase in phytoplankton colour and small copepods that was accompanied by a decrease in large copepods, linked to a trophic cascade caused by the collapse of some fish populations. The decadal changes in zooplankton community structure in the GOM during the 1990s may have enhanced top-down modulation of the phytoplankton community.
The NAO was the only variable examined in this study for which the interannual variability was significantly correlated with phytoplankton trends. It is believed that biological production in the GOM could be influenced by the NAO in how it affects the transport of water that enters along the bottom through the Northeast Channel. Positive and negative NAO indices are associated, respectively, with (i) warm southern slope water, or (ii) cold Labrador slope water propagating into the Gulf (Greene and Pershing, 2001). As warmer slope water is richer in inorganic nitrogen, positive NAO years should favour increased phytoplankton production. Such was the case during the 1990s, when phytoplankton anomalies and the NAO were both primarily positive. The reverse was the case in the 1960s, when the winter NAO and phytoplankton levels were both predominantly negative. However, because the more buoyant low-salinity surface waters impede winter convective mixing in the GOM (Taylor and Mountain, 2009), nutrients would have been trapped below the mixed layer during the 1990s, and unavailable for primary production during spring. Thermal stratification would set in as surface waters warm in April, continuing to keep the nutrient-rich waters from the euphotic zone. This would end with the autumn overturn, when the enriched waters would flood the surface layers and boost autumn and winter production during high-NAO years.
The second most abundant species captured in GOM CPR and net surveys are the late stage copepodites of the important herbivore C. finmarchicus (Kane, 2009). Abundance peaked during late spring and remained high throughout summer. Abundance levels along the transect were depressed during the 1990s (Pershing et al., 2005), causing negative correlations between them and the cumulative phytoplankton abundance indices (Table 3). As past studies have noted that phytoplankton growth is enhanced by the decline in C. finmarchicus (Longhurst and Williams, 1992; Frank et al., 2005), decreased top-down predation pressure from C. finmarchicus likely also played a role in the high phytoplankton levels measured during the summer surveys of the 1990s. Although it appears counterintuitive that the abundance of this copepod would be low in the presence of high-phytoplankton stocks, C. finmarchicus abundance in the GOM is at least partially dependent on processes influencing distant waters. A large part of the GOM population must be restocked annually from upstream, either from surface or deep waters that flow into the region (Johnson et al., 2006). Moreover, increased predation from the abundant pelagic fish stocks in the region during the 1990s (Overholtz, 2002) likely contributed to the reduced abundance of the copepods and a lowering of the predation pressure on phytoplankton stocks.
Several studies have shown that the 1990s was a decade in which large changes in the abundance of plankton were observed in the Northwest Atlantic. These differences were dramatic enough to be referred to as a regime shift that reflected an ecosystem altered by changing climate (Pershing et al., 2005). Many studies found correlations between shelf-wide freshening and plankton abundance trends, with possible linkages to higher trophic levels (Sameoto, 2001; Frank et al., 2005; Greene and Pershing, 2007; Kane, 2007). However, the low salinity measured in the 2000s was accompanied by low production of plankton, indicating that other factors also played a key role in the decadal phytoplankton bloom. Possible mechanisms that may have intertwined with shelf-wide freshening to make the 1990s a unique decade include: (i) a feedback mechanism from elevated stocks of smaller zooplankton that enriched the waters, (ii) reduced top-down pressure from generally smaller stocks of C. finmarchicus, and (iii) high levels of nutrients released during the autumn overturn. Of course, results from trends in the relatively short GOM time-series (1961–2008) need to be interpreted with caution. Additional years added to the CPR time-series will increase the ability to understand and explain the factors that combine to control the plankton populations of the GOM.
Acknowledgements
I thank the many scientific staff of the Narragansett, RI, USA, NOAA Fisheries Laboratory that collected and processed the data from the Gulf of Maine CPR surveys.


