


Abstract
The large fish indicator (LFI) was developed in the North Sea as a size-based indicator of fish community state. It is now established as OSPAR's fish community Ecological Quality Objective (EcoQO) metric and will be applied across all OSPAR regions. To produce a protocol for use when developing regional LFIs, the North Sea experience is interpreted using data from the Celtic Sea. Differences in fish community species composition and size distribution were reflected in a different species complex and large fish threshold (50 cm) for the Celtic Sea LFI. However, a lag of 12–14 years in the relationship between assemblage-averaged fishing mortality Fcom,y and the LFI suggested similar underlying ecological mechanisms to the North Sea. The indicator responded to changes in small fish biomass that follow fishing-induced changes in the level of predation by large demersal piscivores. The Celtic Sea LFI showed maximum observed values >0.40 before 1990, and 0.40 is here proposed as an EcoQO. Development of regional LFIs demands a flexible process rather than a strictly prescriptive protocol.Shephard, S., Reid, D. G., and Greenstreet, S. P. R. 2011. Interpreting the large fish indicator for the Celtic Sea. – ICES Journal of Marine Science, 68: 1963–1972.
Introduction
The large fish indicator (LFI) was developed as a univariate indicator of fish community “state” (Cury and Christensen, 2005; Greenstreet et al., 2011). It describes the proportion (by weight) of the fish community that is larger than some length threshold (40 cm for the North Sea; Greenstreet et al., 2011), so expresses a well-understood community response to exploitation—the curtailment of age and size structure (Haedrich and Barnes, 1997; Shin et al., 2005)—by quantifying change in the biomass contribution to the community of the larger individuals/species that are typically removed by fishing. A key utility of the indicator is its sensitivity (Rice and Rochet, 2005) to the effects of fishing and relative insensitivity to environmental variability (Shin et al., 2005; Link et al., 2010). However, it also offers simplicity of calculation and theoretical transparency that imparts accessibility to both managers and stakeholders (Greenstreet, 2008). Additionally, it provides a metric that can be related easily to a defined Ecological Quality Objective (EcoQO; Heslenfeld and Enserink, 2008) based on a reference period when the fish community was considered to be exploited sustainably. In the North Sea, the EcoQO is an LFI of ≥0.30, corresponding to the range of values evident between 1925 and 1983 when most exploited stocks were above the precautionary spawning-stock biomass reference limit Bpa (Greenstreet et al., 2011).
The LFI has been adopted as the fish community EcoQO for OSPAR regions and was proposed as an index for foodwebs in the EU Marine Strategy Framework Directive (MSFD; EC, 2010)—note that the decision proposes indices, but does not adopt them. This will entail application of the indicator to widely varying marine systems and fish communities and also to somewhat differing survey methodologies. Although such size-based metrics do respond to fishing in variable environments (Blanchard et al., 2005, 2010; Greenstreet and Rogers, 2006), a current limitation of the LFI as a management tool for general use is that it has been developed and applied almost exclusively in the North Sea (OSPAR region II) and that there have been few systematic attempts to investigate its performance elsewhere. This is significant because the ecological mechanisms that underpin changes in the LFI may be more complex than first believed. Changes in the North Sea LFI are strongly influenced by variation in small fish biomass related to variable predation mortality as fishing alters the biomass of large piscivorous fish, i.e. the indirect effect of fishing, which alters the denominator part of the LFI equation (Daan et al., 2005; Greenstreet et al., 2011). This indirect response of the LFI to changes in fishing mortality (F, the most ecologically relevant measure of fishing pressure; Piet et al., 2007) shows a temporal lag of >12 years (Greenstreet et al., 2011).
Such underlying complexity suggests that system-specific effects of community composition or predator–prey dynamics could shift the function and efficacy of the indicator. This has immediate implications for selecting a species complex with which to calculate new regional LFI metrics. OSPAR originally intended that an EcoQO should be developed that safeguarded the general “health” of the North Sea fish community. However, the current LFI, based on the first quarter (Q1) International Bottom Trawl Survey (IBTS), focuses only on demersal fish. This development largely reflects concern that non-representative sampling of some pelagic species, e.g. blue whiting (Micromesistius poutassou), by the survey Grande Ouverture Verticale trawl might bias univariate community metrics (Greenstreet and Hall, 1996; Greenstreet et al., 1999, 2011). However, in the Celtic Sea, juvenile blue whiting form an important part of the demersal prey complex (Pinnegar et al., 2003; Trenkel et al., 2005; Mahe et al., 2007), and large catches were taken regularly in the UK West Coast Groundfish Survey (WCGFS). Juvenile blue whiting in the Celtic Sea may occupy a similar ecological niche to Norway pout in the North Sea (Albert, 1994; Greenstreet, 1996), which are considered to be sampled representatively by the survey gear (Greenstreet and Hall, 1996; Greenstreet et al., 1999) and are included in the LFI calculation. Similarly, although rarely sampled in the North Sea, catch rates of boarfish (Capros aper) in the IBTS were believed to be representative, and this species is included in the LFI. In the Celtic Sea, boarfish form large pelagic shoals and are unlikely to be representatively sampled by the Portuguese high headline trawl (vertical opening ∼4.5 m) used in the WCGFS. Such contrasts in the role or strategy of given species can also apply within regions; in the North Sea, LFI series for different subareas differ markedly (ICES, 2010). Survey data suggest that predator–prey relationships among Celtic Sea demersal fish differ between the eastern shelf and western slope areas (Trenkel et al., 2005), perhaps implying similar spatial heterogeneity in the LFI. Differences in community structure between and within regions may also influence the large fish size threshold at which the LFI responds most effectively to fishing mortality.
In this paper, an LFI was developed and evaluated for the Celtic Sea, an ecosystem where the demersal fish community may differ in terms of structural and functional organization from that of the North Sea. The demersal fish community of the North Sea is thought to be top-down controlled by predation and fishing mortality, whereas that of the Celtic Sea is believed to be bottom-up limited by production of macrobenthos (Heath, 2005a, b). In the Celtic Sea too, groundfish survey data are more limited in time-series length. Constructing a Celtic Sea LFI of ecological transparency and management utility (Nicholson and Jennings, 2004) was undertaken in an adaptive manner that attempted to address the issues highlighted above. The goal was to produce a flexible protocol that could be followed in the development of LFI metrics for other OSPAR or MSFD regions.
Methods
Fisheries-independent survey catch data from the Q1 (March) UK WCGFS were used for this analysis. This survey was operated by the Centre for Environment, Fisheries and Aquaculture Science (Cefas) using a Portuguese high headline trawl fitted with a 20-mm codend liner. The survey took place in March each year and included most of the Celtic Sea region (Figure 1), with effort varying around n=30–60 hauls per year in the study area. Sampling effort and spatial coverage were limited for the first 2 years of the survey (1984 and 1985), so we used only data from 1986 to 2004, when the survey was concluded. Data consisted of the number of fish caught by species and length category per trawl sample of given duration (min) and footprint (wingspread × distance towed) in each ICES rectangle sampled. Data were standardized by deleting all hauls <25 min and >35 min duration, giving “standard” tows of ∼30 min. Additionally, rectangles sampled in fewer than half of all years were excluded to minimize the potential for bias associated with variation in sampling effort or spatial variation in fish community composition. Catch numbers at length (L) were converted to weight (W) at length using weight–length relationships (W=αLβ), where the α and β parameters were derived from survey data when available (only main commercial species were weighed) or from FishBase (www.fishbase.org). Catch weight at length for each species and length class in each trawl sample was converted to density (kg km−2) by dividing by the trawl footprint. For each year, the LFI was calculated by dividing the biomass of fish exceeding the specified large size threshold by the total biomass of all fish caught.
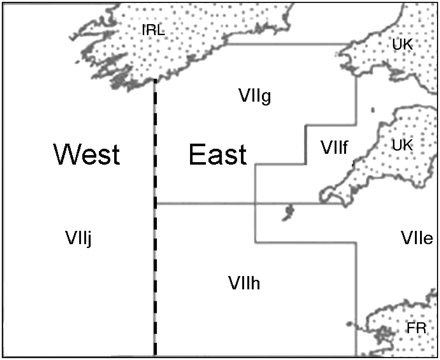
Chart showing the overall region for which a Celtic Sea LFI was derived, and the division of the area into western and eastern subregions (dashed vertical line).
Species complex and length threshold
Considering apparent differences in the ecology of demersal fish occupying the Celtic Sea, we calculated the LFI based on the North Sea complex (Greenstreet et al., 1999), but first excluding boarfish and second excluding boarfish but including blue whiting. Over the entire Celtic Sea WCGFS, mean length of demersal fish was larger than in the North Sea; >13% of all fish caught were larger than the current North Sea LFI threshold of 40 cm. Hence, for each of the two species complexes, we tested 40 cm then larger 45 and 50 cm thresholds. For management purposes, an optimal LFI should respond strongly to a single, specific pressure, i.e. fishing (Rice and Rochet, 2005), so it is important to select an indicator definition in which the underlying fishing response signal is least confused by interannual variation (environmental noise). In this respect, a sixth degree polynomial smoother was fitted to each LFI series, and the series showing the least interannual variation, and consequently the smoother with the highest value of r2, was selected as the best definition for the Celtic Sea LFI.
Spatial variation
Using the optimal species complex and length threshold determined above, separate LFI series were calculated for both western (532 survey hauls) and eastern (476 survey hauls) subregions of the Celtic Sea (Figure 1), and for the whole region. Similarity (correlations) between each subregional time-series and between the two subregional and whole-region time-series was examined using linear regression to assess the extent to which a single regional indicator reflected changes in the status of the fish community in both subregions.
Ecological processes behind the Celtic Sea LFI
 is the mean LFI across years, CV(B>50 cm) and CV(B≤50 cm) are the interannual coefficients of variation in the biomass of fish >50 and ≤50 cm, respectively, and corr(B>50 cm,B≤50 cm) is the temporal correlation between B>50 cm and B≤50 cm.
Defining a reference level for the Celtic Sea LFI
Relating the Celtic Sea LFI to fishing mortality
The WCGFS LFI series was tested for temporal autocorrelation (a) using an autocorrelation function plot in R and (b) by using AIC to compare a gls model (LFI=a+ b× year) with a gls model including an autoregressive (AR1) variance structure. No significant temporal autocorrelation in the LFI was observed (p>0.05), so time-series of LFI and Fcom,y were compared using simple correlation analysis. As in Greenstreet et al. (2011), time-lags in the relationship (correlation) between Fcom,y and the LFI were examined. As the WCGFS was carried out in March, the LFI would be little influenced by cumulative mortality in that year. A lag of 1 year was therefore considered the baseline, and lags of 1–16 years (earlier F data were not available) were tested.
Results
Comparison of LFI series for two species complexes and three length thresholds suggested that the North Sea complex excluding boarfish but including blue whiting, and using a large fish threshold of 50 cm, was optimal in terms of leading to the smoothest time-series (Figure 2). The fitted smoother accounted for 84.1% of the variation in this series, giving the highest value of r2. Over the survey period, >10% of fish were >50 cm, but in years towards the end of the time-series, fewer fish >50 cm were caught, suggesting that larger length thresholds might leave the metric susceptible to small catches of large fish in future.
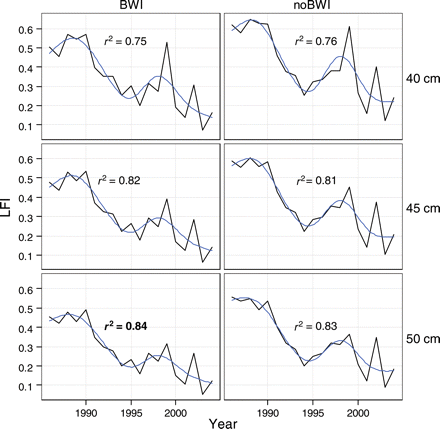
Time-series of the Celtic Sea LFI for two species complexes: North Sea excluding boarfish (noBWI) and North Sea excluding boarfish and including blue whiting (BWI). Three length thresholds for large fish are used (40, 45, and 50 cm). The fitted line is a smoother (sixth order polynomial) with fit (r2) given for each line. The r2 for the selected LFI (50 cm, including blue whiting) is shown emboldened.
All subsequent analyses refer to this optimal definition of the LFI. Series of this metric for the eastern and western subregions of the Celtic Sea (Figure 3) were closely correlated (p<0.001, r2=0.52), and both the eastern (p<0.001, r2>0.79) and the western (p<0.001, r2>0.89) LFI series were highly correlated with the overall regional Celtic Sea LFI.
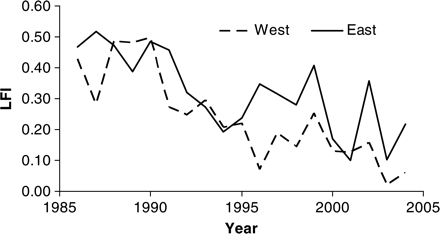
LFI series for eastern and western subregions of the Celtic Sea.
A state–space plot, showing the biomass of small fish plotted against that of large fish, revealed two distinct regimes in the size structure of the Celtic Sea fish community (Figure 4). From 1986 to 1991, the system had relatively high biomass of large fish, yielding relatively high values of LFI. Subsequently, from 1992 to 2004, the biomass of small fish increased, yielding lower LFI values. The minimum LFI was in 2003, when a peak in catches of small fish corresponded to a low biomass of large fish. WCGFS biomass time-series for the six most common species within both the small and large fish components showed contrasting trends (Figure 5). Having accounted for temporal autocorrelation, large fish biomass declined significantly (t19=−6.860, p<0.001), and this remained the case even when spurdog were removed from the analysis (t19=−3.112, p=0.007). Small fish biomass showed a weak, though non-significant, positive trend (t19=1.881, p=0.077). Estimates of interannual CV(B>50 cm) and CV(B≤50 cm) from the Taylor series expansion for each of the LFI series tested, shown in Figure 2, are listed in Table 1. These demonstrate that, no matter which LFI definition was used, variation in the Celtic Sea LFI was influenced more by changes in the abundance of large fish than by changes in the abundance of small fish. As the large size threshold was increased, so the interannual variation in large fish biomass increased, whereas the variation in small fish biomass decreased. The inclusion of blue whiting had no effect on the interannual variation in large fish on the LFI, but it marginally increased the variation in small fish biomass.
Interannual coefficients of variation (CV) of large and small fish components with three different large fish thresholds and where the demersal fish assemblage either includes or excludes blue whiting.
| Large fish threshold (cm) | Blue whiting included | Large fish CV | Small fish CV |
|---|---|---|---|
| 40 | No | 0.53 | 0.37 |
| 45 | No | 0.56 | 0.35 |
| 50 | No | 0.58 | 0.33 |
| 40 | Yes | 0.53 | 0.38 |
| 45 | Yes | 0.56 | 0.36 |
| 50 | Yes | 0.58 | 0.34 |
| Large fish threshold (cm) | Blue whiting included | Large fish CV | Small fish CV |
|---|---|---|---|
| 40 | No | 0.53 | 0.37 |
| 45 | No | 0.56 | 0.35 |
| 50 | No | 0.58 | 0.33 |
| 40 | Yes | 0.53 | 0.38 |
| 45 | Yes | 0.56 | 0.36 |
| 50 | Yes | 0.58 | 0.34 |
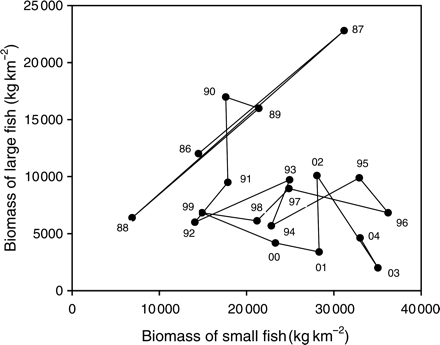
State–space plot of relative biomass of small (≤50 cm) and large (>50 cm) fish over time (years) in the Celtic Sea.
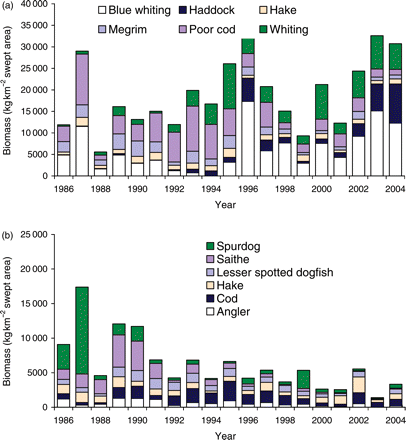
Trends in biomass of (a) the six small fish species, and (b) the six large fish species for which greatest biomass was observed in the Celtic Sea WCGFS.
The assemblage-averaged precautionary plot suggested that the community was exploited within precautionary limits until 1981, but overexploited (i.e. Fcom> Fcom,pa) for most of the remaining period (Figure 6). Despite this, assemblage-averaged biomass remained above Bcom,pa until 2007. The decline in Bcom was not critical until 2005, but there was a clear shift in the structure of the community from 1990 (Figure 4), coinciding with the period when the LFI started to decline from its initial relatively stable level (Figure 2). Assuming therefore that 1990 represents a tipping point, the point in time when prolonged overexploitation finally started to have an adverse impact on the state of the demersal fish community, we use 1990 as the reference period and adopt the fitted smooth LFI value then as the EcoQO for the Celtic Sea LFI. This gives an EcoQO of 0.4 for the WCGFS dataset, contrasting starkly with the observed minimum LFI of 0.05 in 2003. Correlations of LFI against assemblage-averaged fishing mortality (Fcom,y) showed strong relationships for the WCGFS dataset at 10–14 year time-lags (Figure 7).
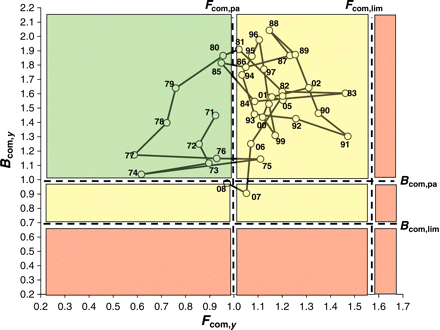
Precautionary plot showing trends in assemblage-averaged fishing mortality Fcom,y and biomass Bcom,y from 1971 to 2008. Note that fishing mortality exceeded the precautionary reference point Fcom,pa in every year between 1985 and 2007.
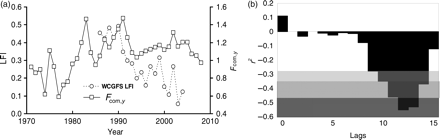
Trends in (a) community-averaged fishing mortality ( ) and the LFI, and (b) cross-correlations, expressed as values of r2, between the LFI time-series and
  at various time-lags (years). The shading indicates significance levels: light grey, 0.05 > p > 0.001; intermediate grey, 0.001 > p > 0.0005; dark grey, p < 0.0005.
Discussion
The LFI is currently used as the principle state indicator for the North Sea demersal fish community and as the basis for the OSPAR North Sea fish community EcoQO. The metric has been adopted as the fish community EcoQO for other OSPAR regions and was proposed as a foodweb indicator within the EU MSFD. This would entail application of the LFI to widely varying marine systems and fish communities. However, complex underlying ecological mechanisms suggest that the indicator should be evaluated carefully, understood, and tuned for each new system and survey dataseries. Using the example of the Celtic Sea, a system having key ecological differences from the North Sea, we developed a flexible protocol to direct the process.
We first described a process for selecting an appropriate species complex from which to calculate an LFI series. For the Celtic Sea, the optimal LFI was based on the North Sea complex but including (juvenile) blue whiting and excluding boarfish. This reflected a compromise between defining a complex that is ecologically meaningful and has consistent catchability (Cotter et al., 2009; Trenkel and Cotter, 2009) and one that yields a state indicator that robustly illustrates changes in the fish community over time (Jennings and Dulvy, 2005). In developing LFIs for further marine regions, it may be important to ensure that the species complex defined includes species that, like blue whiting in the Celtic Sea and Norway pout in the North Sea, constitute the prey of large fish in the community. However, unlike boarfish in the Celtic Sea, species catchability in the sampling gear should be relatively constant across time and space (Trenkel and Cotter, 2009).
A Taylor expansion series showed that the inclusion of blue whiting maximized the influence on the metric of interannual changes in the biomass of small fish. However, the Celtic Sea LFI was still most strongly influenced by changes in large fish biomass, a direct effect of fishing. Direct removal of large piscivorous fish by fishing typically results in reduced predation pressure on small fish prey (Greenstreet et al., 1997; ICES, 2006b). This can lead to increases in small fish biomass that represent an indirect effect of fishing (Daan et al., 2005). The North Sea LFI is approximately equally affected by variation in the biomasses of large and small fish, suggesting approximately equal sensitivity to both the direct and the indirect effects of fishing (Greenstreet et al., 2011). The relative importance of direct and indirect processes needs to be understood if new regional LFIs are to have robust management utility.
Optimal state indicators need to be “responsive primarily to a human activity, with low responsiveness to other causes of change” (ICES, 2001). In the North Sea, observed changes in small fish biomass have greatly exceeded changes in large fish biomass (Greenstreet and Hall, 1996; Greenstreet et al., 1997; Daan et al., 2005), reflecting the influence of environmental variability on small r-type species (Corten, 1990). The definition of the large fish length threshold strongly influences whether size-based state indicators respond more to small fish biomass (influenced by environmental “noise”) or to the depletion of large fish, primarily a fishing effect and therefore the main signal of interest (Dulvy et al., 2004). Correspondingly, increasing the length threshold to 50 cm reduced interannual (environmental) variability in the WCGFS LFI and probably also increased sensitivity to any major underlying long-term signal. This provided a powerful indicator to support the management (Nicholson and Jennings, 2004).
Prior insight into community length distributions should guide selection of reasonable length thresholds to test. Notably, appropriate length thresholds may be survey-dependent even within the same geographic region. Comparison of catches between the WCGFS and the French EVHOE survey showed differences in the proportion of large individuals (Trenkel et al., 2004).
The larger (50 cm) LFI threshold reflects the greater proportion of large fish in the Celtic Sea compared with the North Sea, and the greater abundance of large-bodied species, such as rays, spurdog, hake, and anglerfish. This difference between Celtic Sea and North Sea fish communities may simply reflect different physical habitat and environmental conditions. However, it is also apparent that the two communities have been subjected to different fishing exploitation histories. Whereas community-averaged fishing mortality rates peaked at similar levels (around 1.4) at around the same time (late 1980s), mortality rates in the North Sea registered ∼0.8 as early as 1960, whereas in the Celtic Sea, mortality was only ∼0.3 in 1971. The North Sea has been fished more intensively for longer, and perhaps previously abundant large elasmobranch species were fished out before the North Sea IBTS survey commenced (Walker and Heessen, 1996; Walker and Hislop, 1998; Greenstreet et al., 1999).
There were no major differences in LFI trajectory between eastern and western subregions of the Celtic Sea, and both series resembled the overall regional series reasonably closely, so the overall regional indicator was used. Fine-scale spatial heterogeneity in the Celtic Sea LFI has been observed (Shephard et al., in press), but was not evident at the current larger east–west scale. In the North Sea, some subareas also show markedly differing trends in LFI, probably driven by regional differences in habitat and benthic community (Fraser et al., 2008; Reiss et al., 2010), but these also average out at a larger scale. Nonetheless, a systematic analysis of the factors (environmental and/or anthropogenic) that drive fine-scale heterogeneity in the LFI would be valuable. This may apply particularly when developing LFI series for OSPAR regions outside the North Sea, and likewise for other subregions of the MSFD Northeast Atlantic region, because only the North Sea is covered by a single groundfish survey. Hence, although a single LFI can be derived simply for the whole North Sea, it is much more difficult to do so than for other OSPAR regions. Here, we have developed an LFI and determined an appropriate EcoQO management target for the Celtic Sea, but the Celtic Sea is only part of OSPAR region III. To develop an overall region III LFI and EcoQO, it would be necessary to develop a protocol for integrating series from separate and overlapping surveys.
A state–space plot of small vs. large fish biomass for the Celtic Sea suggests a shift from a system dominated by large fish to one dominated by small fish, and this conclusion is supported by changes in the biomass of each size component. In the North Sea, removal by fisheries of demersal piscivores has caused marked predation release among the smaller demersal fish captured in surveys and shifted the production demand to planktivores (Heath, 2005b). This indirect predator–prey mechanism has led to greater small fish biomass, which has had a significant influence on variation in the North Sea LFI. A similar mechanism seems likely in the Celtic Sea, where there is evidence that mean size (Blanchard et al., 2005) and mean trophic level (Pinnegar et al., 2002) have declined with fishing as large piscivores decreased in abundance and smaller species and size groups increased.
This apparent similarity in trends and ecological mechanism between the North Sea and the Celtic Sea supports the application of the LFI to other regions, if an appropriate species complex and a length threshold for large fish are defined. However, the observed steady decline in large fish biomass over the WCGFS survey series adds evidence that the direct fishing effect has had more influence on the Celtic Sea than on the North Sea LFI. This could partly express marked declines in the Celtic Sea in the biomass of larger elasmobranchs, e.g. spurdog. However, negative trends in Celtic Sea spurdog abundance conform to that of other species and were not solely responsible for the overall trend, which remained significant even when this species was removed from the analysis.
A plot of Bcom,y against Fcom,y showed that biomass stayed above precautionary limits through almost 20 years of sustained overfishing. This is in contrast to the North Sea where biomass was already close to Bpa during the LFI reference period in the early 1980s. Hence, the Celtic Sea appears to have been in a less perturbed state than the North Sea at the start of the survey series, as emphasized by the persistence in the Celtic Sea of certain (non-assessed) elasmobranchs that are scarce in the North Sea. Considering the need to reduce the rate of biodiversity loss (WSSD, 2002), the presence of vulnerable large species may demand more conservative management objectives in the Celtic Sea than in the North Sea, where the community is now dominated by a few assessed and exploited species. The observed values of the LFI in the Celtic Sea were highest in 5 years up to 1990. An EcoQO based on the WCGFS LFI in 1990 provides a value of 0.40, contrasting with current values of ∼0.10. This proposed EcoQO is higher than that for the North Sea (0.30), reflecting the dominance of large piscivores and the frequently larger maximum size of some of these species in the Celtic Sea, as well as the presence of larger elasmobranchs. However, LFI targets developed from other surveys in this region may differ (Trenkel et al., 2004).
This is at least the third study to comment on the existence and length of the time-lag between the response of demersal fish community size composition metrics to changes in fishing mortality (F; see also Daan et al., 2005; Greenstreet et al., 2011). However, both Daan et al. (2005) and Greenstreet et al. (2011) analysed the same North Sea Q1 IBTS data. Detection of a similar time-lagged response of the LFI to changes in F in the completely independent Celtic Sea series, with lags of comparable duration, strongly corroborates the reality of such lags. This is particularly so because trends in F differed substantially between the two regions. In the North Sea, F peaked in 1986 and had declined by ∼60% by 2008. The 1983–2008 LFI time-series in the North Sea therefore mainly covered a period of recovery in the demersal fish community (Greenstreet et al., 2011). The converse was true in the Celtic Sea. Considerable variability in F was observed, with peaks in 1983 and 1991, but a generally increasing trend until 2005; only from 2006 on has any marked reduction in F been evident. Therefore, the Celtic Sea LFI time-series mainly covered a period of increasing perturbation of the demersal fish community. Greenstreet et al. (2011) hypothesized that lag durations in the relationship between the LFI and F during increasing disturbance phases may be shorter than those observed during recovery. Our Celtic Sea result supports this hypothesis, but the greater influence of direct fishing effects (removal of large fish) on the Celtic Sea LFI may also partly explain the shorter lag-time.
Management implications
Our interpretation of the LFI process of Greenstreet et al. (2011) underscores the importance of tuning ecosystem indicators before applying them to new systems, and we have presented a protocol that can be used to develop new regional LFI series. In terms of management value, the tuned LFI appears to satisfy most of the Rice and Rochet (2005) criteria for a useful fisheries management indicator. However, a key issue that has been elucidated here pertains to indicator responsiveness; in that, there is a decadal time-lag between fishing pressure (F) and fish community state (LFI). This lag does seem to be a real property of trophic mechanisms in the community, so should be expressed by any good indicator. However, it still presents challenges for the practical application of the LFI as an EcoQO metric and reaffirms the fact that sophisticated modelling approaches may be necessary to make robust predictions about how the fish community will respond to management actions. As a first-order approach, Greenstreet et al. (2011) utilized the long time-lag to use the F time-series up to the current date to forecast future variation in the LFI. Following the same procedure, we were able to forecast the LFI 10 years into the future (Figure 8). Changes in F up to 2008 may bring about a recovery in the LFI to just over 0.2; only half way towards our proposed Celtic Sea EcoQO target of 0.4 (Figure 8). Extending our current F time-series for a further 6 years and assuming equal year-on-year reductions in F suggests that an overall reduction in F of 20%, from 0.972 in 2008 to 0.775 in 2014, might be sufficient to achieve the Celtic Sea EcoQO by 2024 (Figure 8), 4 years after the year (2020) when the EU MSFD requires good environmental status.
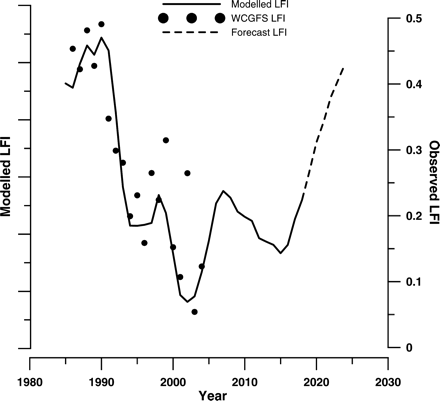
Average modelled LFI predictions from five linear regression models regressing community-averaged fishing mortality on the WCGFS LFI with time-lags of 10–14 years. As regression models smooth the data, the range of the predicted values was less than that of the observed values. Hence, the model predictions are plotted on a unit-less axis, rescaled to match the observed data range. The trend line therefore shows the relative variation in the LFI predicted by the model. Actual WCGFS LFI values are plotted to demonstrate the goodness of fit of the observed data to the model predictions.
However, as stressed by Greenstreet et al. (2011), such simple statistical models do not provide an adequate basis for real management. Process-based theoretical community models are more appropriate for this purpose. Several such models recently published (Benoît and Rochet, 2004; Shin and Cury, 2004; Hall et al., 2006; Pope et al., 2006; Maury et al., 2007; Blanchard et al., 2009; Greenstreet et al., 2011) discuss the pros and cons of these models to identify the particular attributes needed by a process-based theoretical community model that would best support scientific advice for management. More recently, progress has been made in developing a specific model to support management towards the North Sea's LFI EcoQO (Speirs et al., 2010). More generic community models (e.g. Rossberg et al., 2008) have been used to investigate likely recovery trajectories for the Celtic Sea LFI following reductions in F. Although these models predict multidecadal recovery periods, they suggest that recovery could follow an exponential function that would simplify multiyear management advice.
Acknowledgements
This study used survey data supplied by Cefas (UK) and the Irish Marine Institute; Steve Warnes and David Stokes provided advice and comments on the data. We are also grateful to editor Verena Trenkel, whose rigorous comments improved the final manuscript. SS was funded through a grant to Deirdre Brophy from the Department of Education Ireland, Technological Sector Research: Strand III Core Research Strengths Enhancement Programme.
