


Abstract
The boarfish (Capros aper) is a pelagic species of recent interest to the fishing industry, with landings increasing by >500% over the past 3 years. The objective of the study was to provide a method for age determination based on whole sagittal otoliths, with the results to be used in stock assessment. Translucent zones laid down at regular intervals are identified by marginal increment analysis as seasonally recurring. Translucent zones are formed between September/October and March/April, regardless of fish age. The occurrence of the first annulus is validated by analysis of presumed daily growth increments. Subsequent annulus deposition is homogenous between individuals and allows general guidelines to be derived for interpreting the age of boarfish using their otoliths.Hüssy, K., Coad, J. O., Farrell, E. D., Clausen, L. A. W., and Clarke, M. W. 2012. Age verification of boarfish (Capros aper) in the Northeast Atlantic. – ICES Journal of Marine Science, 69: 34–40.
Introduction
The boarfish (Capros aper) is a deep-bodied, laterally compressed, pelagic shoaling species distributed from Norway to Senegal, including the Mediterranean Sea, the Azores, the Canary Islands, Madeira, and the Great Meteor Seamount (Holgersen, 1954; Quéro, 1986; Froese and Pauly, 2010). Boarfish were historically considered rare in the Northeast Atlantic, although they have been documented to have undergone temporary periodic increases in abundance (Couch, 1844; Gatcombe, 1879; Day, 1880–1884; Cunningham, 1888; Cooper, 1952). Between the 1980s and 2000, overall abundance appears to have increased in the Bay of Biscay, over the Galician continental shelf, and in the Celtic Sea (Farina et al., 1997; Pinnegar et al., 2002; Blanchard and Vandermeirsch, 2005). The relative abundance of boarfish in the Bay of Biscay increased from 0.3% in 1973 to 16.4% in 2000, resulting in the species becoming one of the dominant ones in the fish community there (Blanchard and Vandermeirsch, 2005).
Boarfish have until recently been an unwelcome bycatch in mixed demersal, pelagic, and crustacean trawl fisheries (Fonseca et al., 2005; Borges et al., 2008). In the Northeast Atlantic, they are often caught together with mackerel (Scomber scombrus) and horse mackerel (Trachurus trachurus), and occasionally with blue whiting (Micromesistius poutassou). Before 2001, however, there were no recorded landings of boarfish from the NE Atlantic in ICES Statlant or FAO Fishstat datasets, and initial landings were in the region of 1–600 t. Since then landings have increased significantly, and an important industrial fishery has developed, executed primarily by Irish and Danish refrigerated seawater vessels in ICES Areas VIIg, VIIh, and VIIj. The fishery developed unregulated from 2007 to 2010, during which period the landings increased from 18 382 to >100 000 t. The lack of reliable biological data for the species has precluded a stock assessment, however, so a precautionary total allowable catch of 33 000 t was set for 2011.
White et al. (2011) provided the first estimates of age, growth, and maturity of boarfish in the NE Atlantic and suggested that it was long-lived (26 years) and late-maturing (5.25 years), with a relatively fast growth rate (K = 0.186 year−1). They suggested that the presence of old fish was not surprising given that, at the time they studied it, the stock was essentially a virgin one that had not undergone significant directed fishing pressure. However, the apparent late age-at-maturity is in stark contrast to that of other small pelagic shoaling fish and may indicate a species that is more susceptible and less resilient to exploitation (White et al., 2011). That study was based on sectioned sagittal otoliths and the assumption that the zonation patterns observed represented annuli. Validation and/or verification of the periodicity of zone deposition is required to confirm the reliability of such estimates, and White et al. (2011) stressed the need for age validation of the species in future.
The objective of the present study was therefore to provide this verification of annulus formation and hence age estimates by (i) identifying structures representing annuli through marginal increment analysis (MIA), (ii) identifying the first annulus by daily increment analysis, and (iii) corroborating fish age by analysis of annual growth patterns in the otoliths. The results were used to formulate a set of guidelines to help future age determination of the species.
Material and methods
Samples were collected from September to November 2009 and January to July 2010, off the southwest and northwest coasts of Ireland in the western Celtic Sea (Figure 1), from both commercial and research vessels. No samples were available from December or August. Five fish were selected randomly for each month and age class (ages 4–7), and all fish available for the other age classes (ages 2, 3, and 8), for a total sample size of 232 fish. Total length (TL) was measured to the nearest millimetre below, and for the present sample ranged from 80 to 130 mm. Sagittal otoliths were removed with forceps after cutting the head through the mouth and front, then cleaned before storage in labelled trays.
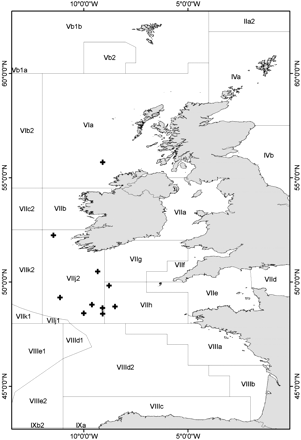
Map of the sampling area, plus signs representing the catch locations of the boarfish used in this study.
Analysis of whole otoliths
The left otolith was used for analysis. Whole otoliths were examined after various immersion times in distilled water, different concentrations of ethanol and propylene glycol, and under different light settings, to determine an optimal procedure. Undiluted propylene glycol and an immersion time of 6 min resulted in the best contrast between growth zones and the clearest resolution at the edge. Otoliths were viewed on a black background, under a circular reflected light source, using a Leica MZ12 microscope at a magnification of 0.63 pixels µm−1. Images were digitized using a Leica DFC290 camera with standard set-up (8 bits per channel, 2048 × 1536 pixel frame, 35 ms exposure). Images were randomized to preclude a biased interpretation by the reader.
Total otolith radius was measured along the longest distances from the primary primordium to the tip of the otolith edge in three dorsal (d1, d2, d3) and three ventral (v1, v2, v3) axes (using IMAGE PRO ver. 5.0; available at www.imagehouse.dk; Figure 2). To determine the best axis for further measurement, axis lengths were regressed against fish length. Correlation was best with the dorsal anterior axis (d1) next to the V-shaped incision at the end of the sulcus (r2 = 0.56, n = 232), so this setting was used for subsequent measurements. Correlation coefficients (r2) for the remaining dorsal axes were d2 = 0.38 and d3 = 0.18, and for the ventral axes v1 = 0.29, v2 = 0.32, and v3 = 0.34.
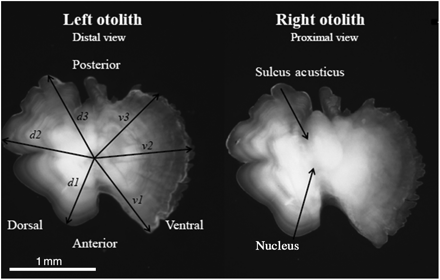
A pair of boarfish otoliths with indications of their orientation and the different axes used for analysis.
Contrast between growth zones in the images was optimized by the application of a local equalization filter, and the zones were identified manually. An annulus is defined as the translucent zone, often referred to as a winter zone or a winter ring. The width of each opaque and translucent zone was measured from the nucleus to the edge, along axis d1. MIA was carried out to validate the seasonality in annulus deposition (see review in Campana, 2001). The width of the current year's growth from the start of the last opaque zone to the edge of the otolith (y) was calculated from the width of the last opaque and translucent zones. The entire previous year's growth (y − 1) was calculated as the sum of the second last opaque zone and the following translucent zone. Examined as a function of time (e.g. months), a cyclical pattern in the marginal increment ratio (MIR) of y and y − 1 demonstrates a general growth pattern in all fish, and a change from a value close to 1 to a low value indicates the completion of 1 year's growth and the initiation of a new opaque zone.
Analysis of otolith sections
To identify the formation of the first annulus, presumed daily increment structure during the first year of life was examined. Otoliths were mounted on microscope slides with the proximal side face up, using thermoplastic resin (Buehler Thermoplastic Cement no. 40–8100; www.buehler.com). Otoliths were then ground on both sides on a rotating wheel (Buehler) covered with a silicon carbide grinding paper (grit 1200) at 40 Hz until nucleus and primary growth increments were visible, after which the section was polished with a lapping film (3 µg). Images were digitized (Leica DFC320 camera and Leica IM 50 frame grabber) using a standard set-up (8 bits per channel, 2048 × 1536 pixel frame, 200 ms exposure). Daily growth increments were examined at a magnification of 4.28 pixels µm−1, based on otolith optical characteristics in a profile of grey values (caliper tool of IMAGE PRO) ranging between 0 (black) and 255 (pure white). The start of an increment was defined as a rising point of inflection between the previously formed opaque zone and the subsequent transparent zone, and it was calculated from the divergence of the individual pixels’ grey values from the running average. The width of an increment was calculated as the distance to the next raising point of inflection.
Results
Marginal increment ratio
MIR reveals the expected cyclical pattern associated with true annulus formation (Figure 3; n = 232). One year's growth (one opaque and one translucent zone) is completed between February and March, where the ratio shifts from high to low values. This process is associated with high variability. Differences in MIR between months were tested with Student's t-test using a significance level of p = 0.05. In Figure 3, where all fish are pooled, the letters identify months in which ratios do not differ significantly. This analysis confirms a change in MIR between February and March, as well as between October and November. For statistical testing within individual age classes, sample sizes were only sufficiently large for ages 4–7. Within each of these age classes, the same pattern as in the pooled sample was evident, with significant differences in ratio between February and March, as well as between October and November (Figure 4). The observed change in MIR is associated with a change in the frequency of translucent and opaque zone formation (Figure 5), with opaque zones formed from March to July/August and translucent zones from September to February.
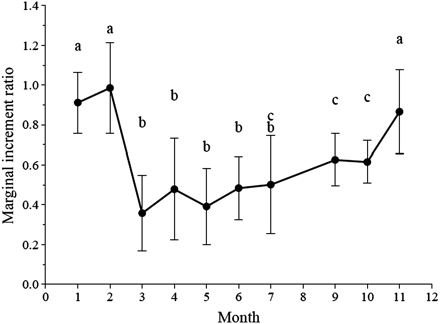
The MIR in relation to the month of capture. Letters above each value indicate months that are not statistically different (data points = average ± s.d.).
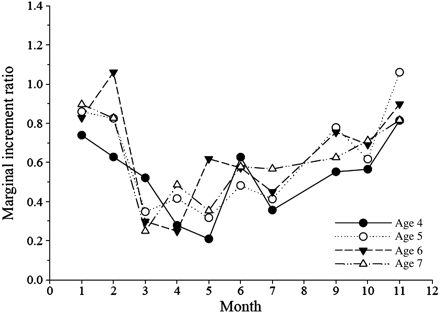
The MIR in relation to the month of capture by age class.
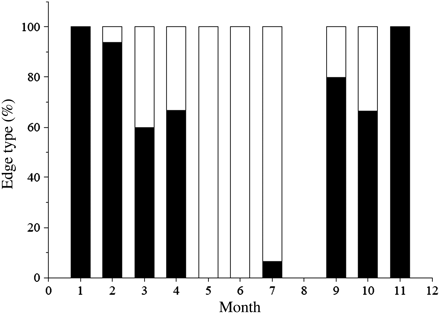
Visual appearance of the otolith edge as a percentage of the total number of otoliths analysed each month (white, opaque; black, translucent).
Analysis of daily increments
The daily increments reveal a consistent pattern, with clearly defined increments from the edge of the nucleus (Figure 6) and widths increasing to a maximum of ca. 7 µm, and thereafter decreasing and finally fading out at ∼104 d (n = 36, range = 81–134 d) on average (Figure 7). Increments disappear at an average distance of 499 ± 72 µm (s.d.) from the nucleus (n = 36, range = 373–707 µm). The distance to increment disappearance does not differ between months of capture (ANOVA, d.f. = 35, p = 0.39), nor does the number of visible increments (ANOVA, d.f. = 35, p = 0.79).
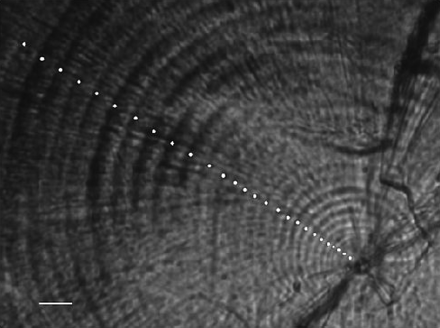
A boarfish otolith showing the nucleus, and with the first daily increments indicated by white dots. Scale bar = 10 µm.
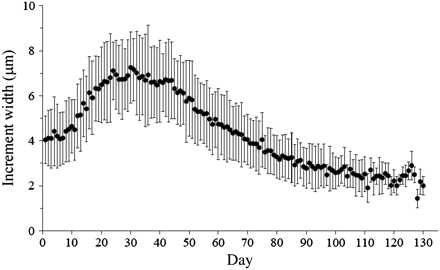
Daily increment pattern of boarfish from hatch (day 0) to the disappearance of visible daily increments (average ± s.d.)
The samples with a relatively clearly defined first annulus show that daily increments disappear later than the onset of the first translucent zone, because the latter is notably farther from the nucleus, on average 82 µm (paired t-test, d.f. = 10, p < 0.01).
General growth pattern
The growth of the entire sequence of translucent and opaque zones was analysed for a subset of selected otoliths (n = 20) in which the daily increment structure and all annuli, including the first, was clear. In this analysis, the last zone was excluded from the analysis to avoid including incomplete zones. Growth of the opaque zone is fast during the first year, then decreasing following a negative power function: opaque zone width (μm) = 218.19 × zone number−0.862 (r2 = 0.84). Translucent zones also show this pattern with decreasing widths: translucent zone width (μm) = 66.34 × zone number−0.295 (r² = 0.37). Translucent zones are initially much narrower than opaque zones, but converge until the two zones are virtually the same width of 30–40 µm (at an age of ca. 5 years; solid line in Figure 8). There is no overlap between first and second translucent zones. The growth patterns of the remaining samples with less well-defined zones (n = 212) follows the same pattern (broken line in Figure 8). In that sample, the data were adjusted so that in cases where the distance from the nucleus to the first visible annulus was >535 µm from the centre, this ring was assigned as belonging to the second winter. Based on the measurements made, a guideline table for age interpretation was established (Table 1).
Guidelines for age estimation and the distance between the centre and the beginning of the winter ring (µm): average, standard deviation (s.d.), and minimum and maximum values observed.
| Annulus | Average | s.d. | Minimum | Maximum |
|---|---|---|---|---|
| 1 | 436 | 46 | 270 | 497 |
| 2 | 671 | 71 | 568 | 807 |
| 3 | 791 | 77 | 635 | 961 |
| 4 | 916 | 76 | 725 | 1 059 |
| 5 | 1 005 | 77 | 797 | 1 184 |
| 6 | 1 068 | 73 | 853 | 1 259 |
| 7 | 1 107 | 70 | 920 | 1 222 |
| 8 | 1 161 | 90 | 983 | 1 277 |
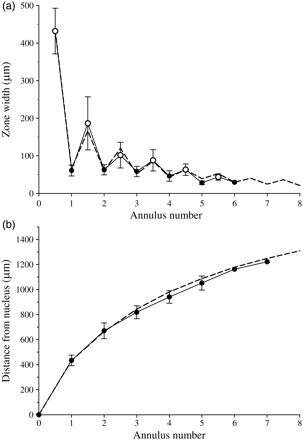
(a) The width of consecutive opaque and translucent growth zones, where the opaque zones are shown between the previous and the following translucent annuli, and (b) the corresponding distances between the nucleus and the beginning of each annulus. Solid lines represent the otoliths with clear zone patterns, and the dashed lines the average of the remaining otoliths.
Discussion
Boarfish otoliths are characterized by their opaque centre surrounded by more or less clearly defined translucent zones all around the otolith. The first annulus is not recognizable in all otoliths but could in all individuals be identified at a consistent distance from the nucleus. Translucent zones are usually relatively clearly defined from the second winter on, although the contrast between opaque and translucent zones can be low. Otolith growth is fast between April and September of the first 2 years, with opaque zones being wider than translucent zones, but then gradually decreasing to a constant growth rate at ∼5 years of age. Growth seems to be homogenous between individual fish because there was no overlap in distance to the nucleus between the first two annuli. In this study, the translucent zones were identified as annuli, and based on their distances from the nucleus, a guideline for future age reading was established. Different aspects of the underlying analyses are now discussed.
MIA is a well-established tool for validating annulus formation in the hard body parts of aquatic organisms such as the vertebrae in sharks (Conrath et al., 2002), the fin spines in bony fish (Keller Kopf et al., 2010), and particularly in otoliths (Franks et al., 1998, and reviews in Campana, 2001, and Beckman and Wilson, 1995). Many studies suffer, however, from insufficient observance of the basic requirements for thorough application of this approach and interpretation of the results. Campana (2001) therefore summarized the requirements: (i) the samples need to be analysed randomly without information on catch date, to avoid over-interpretation by the reader, (ii) samples need to cover at least 2 years, (iii) analysis should be restricted to only one age class at a time, and (iv) the results need to be evaluated objectively based on statistical tests. In the present study, images were randomized before interpretation, but it was not possible to fulfil the requirement with respect to temporal resolution because of insufficient sample availability (just 1 year). Nevertheless, the samples covered two consecutive summer/autumn periods, and the MIR of these did not differ significantly, suggesting that the growth patterns observed do recur annually. All age classes analysed show similar temporal development in MIR, which further supports the validity of the interpretation. Ideally, all age classes within a stock should be analysed, but the increasingly narrow annual growth zones and increasing translucence of the edge in the otoliths of older fish renders visual identification of a zone's exact borders, and hence a reliable MIA for these age classes, difficult.
In northern latitude temperate fish, formation of the opaque zone usually takes place between April and July, with a relatively sudden change from translucent to opaque, and a more gradual change back to translucent (Beckman and Wilson, 1995). Boarfish conform to this general growth pattern, with respect to both timing and duration of zone formation, further supporting the interpretation of translucent zones as true annuli. These annuli form from November to February and are finalized by May when all otolith edges are opaque and the MIR consequently at its lowest value. The variability in ratios in the April sample here was probably caused by individual differences in the timing at which growth was resumed. The same pattern arises in other species (Bullock et al., 1992; Williams et al., 2005; Farley et al., 2006). Also, technical difficulties in assessing the optical density of otoliths at the very edge of the otolith may add to the variability. Reflection off the three-dimensional surface of the otolith and refraction of light when passing through the surface may obscure the true optical nature of the edge zone (Campana, 2001).
Particularly in larger boarfish otoliths, the central area is often too opaque to permit the identification of the first annulus. One method sometimes used for identification of this structure, therefore, is the analysis of microincrements representing daily otolith growth from the nucleus to the first annulus. This approach is based on the observation that annuli are generally laid down in winter (Beckman and Wilson, 1995) and the assumption of temperature-dependence of daily increment width (Mosegaard and Titus, 1987; Volk et al., 1990; Otterlei et al., 2002; Hüssy and Mosegaard, 2004). A decrease in increment width over the days to weeks before annulus formation seems to be a general pattern in temperate, subtropical, and tropical fish species from both marine (Pannella, 1971; Victor and Brothers, 1982; Waldron and Kerstan, 2001; Wright et al., 2002) and freshwater environments (Brothers et al., 1976). Within an annulus, either regular but faint, narrow microincrements (Victor and Brothers, 1982; Waldron and Kerstan, 2001; Wright et al., 2002), or a zone with disrupted increments (Pannella, 1971; Brothers et al., 1976; Victor and Brothers, 1982; Wright et al., 2002) may be formed. In those studies, the decrease in increment width and their subsequent cessation was usually associated with the onset of translucent zone formation. The primary requirement for using this approach is the validity of daily increment formation. For boarfish, this assumption has not yet been validated. However, observations of monthly maturity development show that spawning takes place mainly in July (Cunningham, 1888; EDF, pers. obs.), and egg development time at the temperature observed during the spawning season is 2 d (J. Hemdal, pers. obs.). The period from hatch to onset of translucent zone formation in November is therefore ∼120 d, corresponding to the number of visible increments. Together with the high inter-individual consistency in an increment pattern, these observations suggest that the zonal increments we observed were in fact laid down daily. In boarfish, the first translucent zone seems to start forming some time before the disruption in daily increment formation. Several factors may contribute to this, e.g. the fact that the edges of the first annulus are not clearly defined, but look rather fuzzy even in otoliths where the annulus is identified easily. Another explanation may be that increment width is primarily temperature-dependent and annulus formation influenced by other factors too (Pilling et al., 2007). Hence, the two events do not necessarily have to occur at exactly the same time. What is irrefutably highlighted is the fact that the first annulus is not laid down within the innermost 300 µm from the nucleus. At the same time, it is unlikely that the discrepancy indicates that another annulus is hidden in the opaque centre; the distance between the two features is too narrow for that. Counting another annulus closer to the nucleus would disrupt the otherwise very regular general growth pattern with gradually decreasing annual growth.
The same growth pattern with fast growth during the first 2–3 years after which growth levels off and energy is allocated to other processes such as reproduction is also found in other pelagic species (Borges, 2000; Waldron and Kerstan, 2001; Griffiths et al., 2010). Snipefish (Macrorhamphosus spp.), for instance, are of particular interest; they are also pelagic species with similar life strategies and sizes and often coexist with boarfish (Marques et al., 2005). Their otoliths are remarkably similar in size and shape, and they have a growth pattern that is almost identical to that of boarfish, with a very opaque centre and a more translucent edge, with clearly defined annuli (Borges, 2000). Their age distributions are also similar. In one of the two studies relating to boarfish growth, ages up to 4 years are reported in fish from the Mediterranean (Kaya and Özydin, 1996). The maximum size of these fish being somewhat smaller than those from the present study, these age estimates are similar to those documented here. Contrary to this, however, the length-at-age estimates of White et al. (2011) corresponding to the length range of fish in the present study span from 5 to >15 years—virtually twice as old as the present estimates. Maximum ages of >25 years suggest that boarfish is a species with considerable longevity (White et al., 2011). Neither of these published studies included annulus validation, but one explanation for the disagreements may be preparation and viewing methods, in that White et al. (2011) used sectioned otoliths and Kaya and Özydin (1996) used whole otoliths. Age estimation by sectioning often results in higher estimates of age than otoliths read whole, because the method reveals more detail, particularly in older fish (Campana, 1984; Brouwer and Griffiths, 2004). This method-related discrepancy in age estimates needs careful attention, not only for boarfish but for all species where different methods are employed.
Lopes et al. (2006) suggested that there might be two different morphotypes of boarfish in Atlantic waters, potentially with different otolith structure and growth, with ensuing implications for age readings. However, those authors were apparently not aware that boarfish are sexually dimorphic and that the sizes they had analysed were around the size at sexual maturation, where it is virtually impossible to determine sex (EDF, pers. obs.). Alternatively, the two morphotypes may be different species (Capros aper and Antigonia capros). Although there is some overlap in the distribution of these species in southern European waters (from where Lopes' samples were derived), A. capros is not found in the Celtic Sea (Holgersen, 1954; Froese and Pauly, 2010). Hence, the different morphotypes of boarfish identified by Lopes et al. (2006) are most likely different sexes or different species, so should not be cited as the cause for the differences in age readings.
Based on the verification of age estimates presented here, manuals for ageing routines are being prepared. The size range studied is limited, but the application of the age-determination methods to samples covering the entire size range of the species is ongoing. Together with the studies of maturation patterns, the resulting growth curves and age–length keys will underpin the biological data used in stock assessments in future.
Acknowledgements
The work was partly funded by FF Skagen (http://www.ffskagen.dk). EDF was funded by the Killybegs Fishermen's Organization and thanks the skippers and crews of the Killybegs pelagic fleet for helping with sample collection. We are grateful too to the scientists and crews of the RVs “Celtic Explorer”, “Scotia”, “Tridens”, “Walther Herwig II”, and “Johan Hjort” for assistance with sample collection.
References
Author notes
Handling editor: Audrey Geffen
