-
PDF
- Split View
-
Views
-
Cite
Cite
Frédéric Maps, Andrew J. Pershing, Nicholas R. Record, A generalized approach for simulating growth and development in diverse marine copepod species, ICES Journal of Marine Science, Volume 69, Issue 3, May 2012, Pages 370–379, https://doi.org/10.1093/icesjms/fsr182
Close - Share Icon Share
Abstract
Predicting ecological changes under climate change requires mechanistic descriptions of the impact of environmental conditions on the physiology, life history, and population dynamics of target species. A generic framework has been developed to simulate the growth and development of copepods, a critical link in pelagic ecosystems that connects environmental variability and changes in primary production with higher trophic levels. The modelled copepods, referred to as “compupods”, are described by their body mass and developmental stage. The dynamics of the compupods are determined by three core equations: universal temperature-dependence, Holling's type II ingestion, and allometric scaling. This general framework was applied to four copepod taxa: Pseudocalanus newmani, Calanus finmarchicus, C. glacialis, and C. hyperboreus, spanning a wide range of body sizes. A genetic algorithm procedure was used to estimate the unknown parameters required to produce a good fit to observed species-specific growth and development data. The performance of the model was evaluated by comparing the influence of food and temperature on ingestion, gut clearance, and egg production rates with published relationships. Simulations of the four species suggest that small changes in the trade-off between growth and development are responsible for the interspecific diversity observed.Maps, F., Pershing, A. J., and Record, N. R. 2012. A generalized approach for simulating growth and development in diverse marine copepod species. – ICES Journal of Marine Science, 69: 370–379.
Introduction
Understanding the complex interactions between the ocean's dynamic physical environment and the distribution, abundance, and productivity of pelagic species is a precondition for using climate models to predict the impacts of climate change on marine ecosystems. From that perspective, copepods represent a critical link in pelagic ecosystems that connects environmental variability and changes in primary production to higher trophic levels (Greene et al., 2003).
One of the best documented examples of the impact of warming on marine ecosystems comes from the northeast North Atlantic and North Sea (Reid et al., 2001; Beaugrand et al., 2009). Warming there has been associated with a northward advance of zooplankton and fish and a shift in the copepod community from one dominated by the large Calanus finmarchicus to one dominated by its congener C. helgolandicus (Beaugrand et al., 2009). These two species have well-defined associations with temperature (Helaouet and Beaugrand, 2007), but the mechanisms limiting C. finmarchicus in warmer water and C. helgolandicus in cooler water are not clear. The question remains whether the transition is attributable to the direct impact of temperature (e.g. on physiological rates) or to changes in primary productivity, the timing of phytoplankton blooms (Reid et al., 1998), the size spectrum of phytoplankton (Leterme et al., 2006), or advective supply (Reid et al., 2003), all of which are associated with a warming trend.
Not all such ecosystem shifts are so directly linked with temperature. Like the northeast North Atlantic, the Gulf of Maine and Georges Bank ecosystems in the Northwest Atlantic experienced a major shift in the copepod community composition during the 1990s (Pershing et al., 2005; Greene and Pershing, 2007). Unlike the Northeast Atlantic, there was no consistent temperature change (Pershing et al., 2005). Rather, during the 1990s, surface waters became fresher (Smith et al., 2001), and salinity changes were associated with larger autumn phytoplankton blooms and earlier spring blooms (Greene and Pershing, 2007; Song et al., 2010). Meanwhile, the abundance of most copepod species increased. These changes are consistent with bottom–up forcing, with reduced surface salinity leading to enhanced stratification and reduced light limitation, increased autumn/winter phytoplankton abundance, and increased zooplankton abundance (Durbin et al., 2003). The exception to the bottom–up pattern was C. finmarchicus, which declined in the 1990s (Pershing et al., 2005). In accord with the changing abundance, the diversity of the copepod community increased during the 1990s through an expansion of the high-diversity summer community into autumn (Record et al., 2010b).
Recent observations in the North Atlantic underscore the fact that physical correlates to biogeographic patterns are not sufficient to predict species distributions under climate change. Predicting changes or even interpreting observed shifts in species distribution requires mechanistic understanding of the impacts of environmental conditions (physical and biological) on physiology, life history, and population dynamics. It also requires numerical models that can produce an integrated mechanistic response to the forcing.
Modelling copepod physiology and population dynamics is complicated by their complex life histories. Calanoid copepods pass through 12 life stages (egg, six naupliar stages, and five copepodid stages) before reaching maturity. The transition from egg to adult can take weeks or even months, depending on the physical environment, and involves behavioural and physiological changes and an increase in body mass of more than four orders of magnitude in some species. Under certain conditions, some species will enter a prolonged period of dormancy, ranging from a slowed metabolism (quiescence) to arrested development (diapause) as an egg, a larva, or a reproductive adult.
Here, we present a generic model of copepod growth and development. The innovation in the approach is a model framework that can be applied to a wide range of calanoid copepod species and that will mechanistically model their growth trajectory, reproductive output, and phenology in response to environmental forcing by temperature and food concentration. The implementation of the mechanistic formulations of key physiological processes of development, ingestion, and metabolic demand, which give this model the ability to represent critical trade-offs between development and growth for the developing stages, and metabolic demand and allocation of ingested matter into eggs for reproductive females, are presented. The model framework was tested for three Calanus congeners (C. hyperboreus, C. glacialis, and C. finmarchicus) and Pseudocalanus newmani, which together span a wide range of environmental regimes and life histories. The approach contributes to improving the mechanistic understanding of the way environmental forcing impinges on the biogeographic range of planktonic copepod species.
Methods
Concepts and implementation details
Our goal was to design a model that can mechanistically reproduce the development and growth trajectories of various planktonic copepod species. Modelled copepods, which we refer to here as “compupods”, should exhibit the realistic variability of development time and body mass in response to changes in environmental conditions (temperature and food availability). The model framework is designed to be general enough to simulate calanoid copepods, and potentially, other crustaceans, but we focus our initial model implementation on copepods from the ubiquitous and well-studied Calanus and Pseudocalanus genera. To maximize the generality of the model, all physiological processes involved were formulated in terms of basic principles of physiology and biology. Three key relationships lie at the heart of the compupod approach: the universal temperature-dependence (UTD) of chemical (enzymatic) reactions (Gillooly et al., 2001), the universal quarter-power allometric scaling of physiological processes (Savage et al., 2004), and the biomechanical and physiological constraints on food ingestion (reviewed in Kiørboe, 2008).
Body mass is a basic state variable. It is related to body geometry, which determines how an animal interacts with the environment, and also provides an index of condition. Importantly, mass determines physiological rates, and mass-dependence is well characterized by allometric relationships involving mass raised to a power. For many processes, notably the metabolic rate, which is approximated by the respiration rate, the allometric exponent is close to 3/4 (Savage et al., 2004). For copepods specifically, the rate of oxygen consumption measured on copepodid stages (including several successive stages) from species spanning a wide range of body masses followed an allometric exponent of 0.76 (Figure 4 of Mayzaud et al., 2002), and an allometric exponent of 0.672 was observed for the rates of CO2 production (Mayzaud et al., 2005). At an intraspecific level, information is scarce, but the relationship between the respiration rate and body mass follows a similar allometric exponent of 0.767 for Oithona davisae nauplii (Almeda et al., 2011), well approximated by the theoretical value of 3/4. Allometric relationships suggest rates that change as an individual grows and imply important intra- and interspecific differences in these rates.
Although important, mass is an unsatisfactory description of a copepod's state. Copepods pass through several distinct life stages before reaching the adult stage, and the rate at which an individual develops has a great influence on its fitness (Kiørboe and Hirst, 2008). Moreover, strict allometric relationships cannot produce changes in rates associated with developmental stages. For instance, the first-feeding stage in C. finmarchicus (NIII) has the longest development time of all naupliar stages (Campbell et al., 2001). To allow for changes in rates associated with stage, the model tracks the development stage through a continuous variable analogous to Miller and Tande's (1993) moult cycle fraction (MCF).
The compupods developed and grew in response to temperature and food conditions. Each was characterized by three state variables: species, development stage (MCF), and body mass in carbon. At each time-step (1 h), development and body mass were incremented synchronously for each compupod according to the temperature- and food-dependent development and growth rates defined below. The equations for growth and development contain several free parameters. The values for these parameters were obtained from a genetic algorithm fitting developmental and growth trajectories to observations from laboratory studies. In all simulations, compupods experienced constant conditions of temperature (°C or K) and food concentration (µgC l–1).
Development


Growth and egg production

Once a copepod matures into an adult female, energy is redirected to egg production. For compupods, the egg production rate (EPR) was growth [Equation (3)] applied to adult females. The mass-specific EPR (µgC µgC female–1 time–1) was converted into egg numbers using the species-specific carbon content of eggs (Table 1). We assumed that the conversion efficiency of growth into egg production was 100% and that female body mass does not change. In reality, female body mass can either increase as lipid stores are accumulated during the periods of food abundance or decrease when those lipid stores are used to fuel egg production during the periods of food shortage. Variability of female body mass can be large in species for which the latter mechanism is the mandatory mode of egg production, like C. hyperboreus (Smith, 1990). However, in most species including the three other species considered in this study, egg production during the periods of non-limiting food availability can be expressed as an energetic balance equivalent to the growth process in juveniles (Hirst and Bunker, 2003). Therefore, we can use egg production simulated under non-limiting food conditions to assess the validity of the metabolic approach upon which this model was based.
Parameters of the model, emboldening referring to soft parameters, for which the values in square parenthesiss are ranges used in the genetic algorithm tuning procedure; for activation energies, values in round parenthesis are Q10 equivalents.
| . | . | Value . | |||
|---|---|---|---|---|---|
| Parameter description . | Unit . | P. newmani . | C. finmarchicus . | C. glacialis . | C. hyperboreus . |
| Cegg, egg mass | µgC | 0.14a | 0.23b | 0.4c | 0.56d |
| A, net assimilation coefficient | – | 0.6e | 0.6e | 0.6e | 0.6e |
| k, Boltzmann constant | eV K–1 | 8.62 × 10⁻⁵ | 8.62 × 10⁻⁵ | 8.62 × 10⁻⁵ | 8.62 × 10⁻⁵ |
| EM, activation energy, metabolism | eV | 0.61 (2.59)f | 0.80 (3.50)g | 0.40 (1.86)h | 0.58 (2.48)g |
| B0, constant, metabolism | µgC¼ s–1 | 5.5 × 10⁻⁷f | 2.98 × 10⁻⁷g | 1.03 × 10⁻⁶h | 3.80 × 10⁻⁷g |
| ED, activation energy, development | eV | 0.62 (2.63)i | 0.79 (3.42)j | 0.67 (2.84)k | 0.65 (2.75)k |
| D0 egg, constant, development | d | 9.18i | 5.11i | 4.52k | 5.94k |
| D0 NI | d | 3.25 | 3.32 | 2.94 | 3.86 |
| D0 NII | d | 3.61 | 5.00 | 4.43 | 5.82 |
| D0 NIII | d | 12.72 | 11.91 | 10.53 | 13.85 |
| D0 NIV | d | 8.18 | 6.52 | 5.76 | 7.58 |
| D0 NV | d | 8.72 | 6.14 | 5.43 | 7.14 |
| D0 NVI | d | 7.85 | 7.22 | 6.38 | 8.40 |
| D0 CI | d | 8.70 | 8.29 | 7.33 | 9.64 |
| D0 CII | d | 8.35 | 9.76 | 8.63 | 11.35 |
| D0 CIII | d | 9.28 | 12.26 | 10.84 | 14.26 |
| D0 CIV | d | 8.33 | 18.59 | 16.44 | 21.63 |
| D0 CV | d | 10.52 | 35.05 | 30.99 | 40.77 |
| EI, activation energy, ingestion | eV [0.5–1] | 0.52 (2.25) | 0.66 (2.79) | 0.46 (2.05) | 0.52 (2.25) |
| H0, constant, handling time | s pgCfood–1 µgC3/4 [10−2–1] | 0.54/0.44 | 0.54/0.30 | 0.27/0.18 | 0.31/0.22 |
| V0, constant, encounter rate | µl s–1 µgC−3/4 [10−2–1] | 0.17/0.23 | 0.08/0.21 | 0.24/0.42 | 0.13/0.28 |
| f0, exponent, development | – [0.5–2] | 1.58/1.68 | 0.80/0.98 | 1.09/1.19 | 0.79/0.96 |
Where relevant, values are presented for nauplii/copepodids.
Metabolism

Ingestion


The interplay between both the encounter rate PV and the handling time H provides an explicit mechanistic formulation for the dependence of ingestion on food concentration, temperature, and body mass.
Food limitation


Observations
Respiration measurements made under various temperatures for advanced stages of all three Calanus species (Hirche, 1987; Tande, 1988) and P. newmani (Lee et al., 2001) provided the information required to parametrize the species-specific relationship between metabolism and temperature. Values for these parameters were taken from the literature, with appropriate unit conversion.
Species and stage-specific development time and body-mass data were used to fit parameters. Campbell et al. (2001) provided a comprehensive source for stage-specific development times and body masses of C. finmarchicus obtained under various temperature and food conditions. Arnkværn et al. (2005) inferred the detailed stage-specific development times of C. glacialis and C. hyperboreus by associating the observations of hatching times at various temperature to the equiproportional rule demonstrated for the genus Calanus (Corkett et al., 1986). The literature contains less detailed datasets about the stage-specific body masses of C. glacialis and C. hyperboreus. Therefore, based on available knowledge on those species (Båmstedt and Tande, 1985; Hirche, 1987; Plourde et al., 2003), we decided to apply factors of 2 and 8 to C. finmarchicus masses to obtain realistic stage-specific body masses of C. glacialis and C. hyperboreus, respectively. Lee et al. (2003) provided stage-specific development time and body mass of P. newmani at various temperatures. Vidal (1980a, b) provided stage-specific development time and body mass relationships with food concentrations for Pseudocalanus sp. (either P. newmani or P. minutus). Additional data on ingestion, gut clearance, and egg production were used to evaluate the performance of the models for each species (see Table 1 and figure legends).
Parameter tuning
We distinguished two categories of parameter: those available in reliable literature and those derived from experiments designed specifically to feed a model constituted the “hard parameters” (Table 1). Other than the activation energy for development (ED; Table 1) and reference stage durations (D0; Table 1), all hard parameter values came directly from the literature after appropriate unit conversion. We obtained ED and D0 with a linear least-squares fit procedure applied to log-transformed development times from either Belehrádek equations (Calanus congeners) or observations (P. newmani). Parameters known with less certainty constituted the “soft parameters” (Table 1). Soft parameters were considered unknown at the outset of the modelling exercise, although upper and lower bounds were assumed.
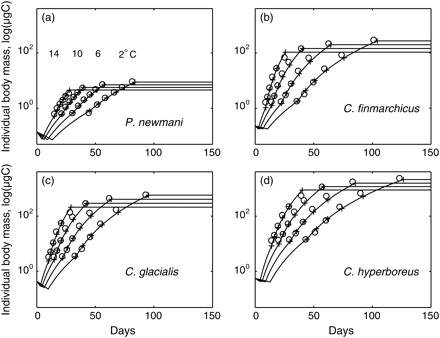
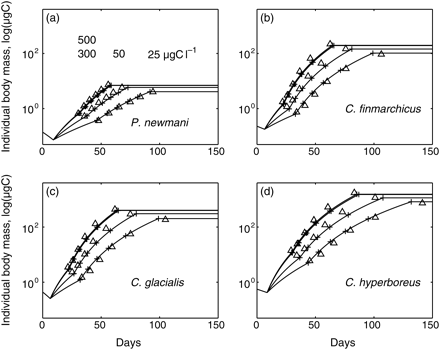
A genetic algorithm was employed to explore objectively and efficiently the soft parameter space. There are many genetic algorithm designs and effective design is problem-dependent. A genetic algorithm designed for and applied to copepod modelling (Record et al., 2010a) was adopted. Briefly, the genetic algorithm operates on a collection of randomly generated “paramosomes”—vectors of parameter values. Each paramosome is evaluated based on a score function, and paramosomes with the best scores are selected for processes that mimic crossover and mutation, and a subsequent generation of paramosomes is generated. This procedure is iterated until the score function converges. The genetic algorithm is fundamentally stochastic, and previous work (Record et al., 2010a) recommends using an ensemble of model fits, so we repeated our fitting procedure ten times. The genetic algorithm score function computed the sum of the normalized root mean square differences between (i) the observed and simulated development times and (ii) the observed and simulated body masses of the copepodid stages, first at four temperatures at non-limiting food concentrations (Figure 1), then at four food concentrations at 6°C (Figure 2).
Prescribed (circles) and simulated (plus signs and lines) mass trajectories of individuals developing at non-limiting food concentration and 2, 6, 10, and 14°C. (a) Pseudocalanus newmani, (b) C. finmarchicus, (c) C. glacialis, and (d) C. hyperboreus.
Prescribed (triangles) and simulated (plus signs and lines) mass trajectories of individuals developing at 6°C and 25, 50, 300, and 500 µgC l–1. (a) Pseudocalanus newmani, (b) C. finmarchicus, (c) C. glacialis, and (d) C. hyperboreus.
Results
The genetic algorithm tuning procedure provided a first level of exploration of model performance. By successfully reproducing development times and body masses at discrete combinations of temperature and food concentration, we ensured that the mechanistic formulations yielded adequate functional response of growth for each species considered. The ensemble of tuned parameter values had low variance, so we used the average values from the ten best simulations to compute development and growth trajectories. The systematic confrontation of the resulting physiological rates with values reported in the literature constituted the second level of exploration of model performance. This independent verification step ensured that the mechanistic formulations themselves were adequate and provided additional information on the complex physiological responses of the copepod species modelled.
Development time and body mass
Relationship with temperature
The simulated body masses of the adult stage at non-limiting food concentrations were within 4.2 and 4.6% of the observed values in P. newmani, 0.4 and 10% in C finmarchicus, 1 and 7.4% in C. glacialis, and 1 and 11.7% in C. hyperboreus. The activation energy (ED) for development was highest for C. finmarchicus (0.79 eV) and lowest for P. newmani (0.62 eV), both values well within the reported range for development time across metazoan species (Gillooly et al., 2002). Simulated species-specific development times and body masses compared well with values derived from empirical relationships (Figure 1). The species most sensitive to temperature in terms of both development (highest ED) and growth (highest EI and EM) was C. finmarchicus, and the least sensitive was C. glacialis (Table 1). Both EI and EM are involved in growth, but the metabolic cost parametrized by EM is between one-tenth and one-fifth of the ingestion parametrized by EI. Hence, EI effectively determined the rate of increase in growth with temperature. The effect of temperature was greater for development (higher ED than EI), as expected from the decreasing individual sizes with increasing temperature. The body mass of P. newmani varied by a factor of 3 between 2 and 14°C (Figure 1a), and the body masses of Calanus congeners decreased by a factor of >3 (Figure 1b–d). Finally, nauplii and copepodid stages showed distinct growth patterns, the increase in the body mass of copepodid stages being steeper than that of nauplii.
Relationship with food concentration
Simulated development times and body masses showed similar agreement with empirical relationships to that observed with temperature (Figure 2). The simulated body masses of the adult stage varied from 0.3 to 7% of the observed values in P. newmani, from 2 to 12% in C finmarchicus, from 0.5 to 17% in C. glacialis, and from 2 to 13.5% in C. hyperboreus. All species displayed similar sensitivity to food concentration in terms of both development and growth. The rates of both development and growth increased with food concentration, the rate of increase in the latter being faster, and individual sizes increased with food concentration for each species. The body mass of compupods increased by a factor of 2–3 between 25 and 300 µgC l–1, and their development time was approximately halved within the same range of food concentration (Figure 2). At a species level, there was no detectable trend related to the size of the species. Although fitted values of the soft parameters were all significantly different among species, their ranges were strikingly narrow (Table 1). At a stage level, nauplii searched for food in a smaller volume (lower V0 than copepodids), and took longer to process each food unit acquired (higher H0 than copepodids; Table 1). Distinct growth trajectories between nauplii and copepodids appeared critical to ensure a satisfying model performance.
Synergistic effects
The most widely differing parameter between species was the stage-specific scaling constant of development D0 (Table 1). Physiological processes involved in ingestion and growth followed the allometric quarter-power rule that produced a cumulative effect on growth over the development time-scale. The impact of the quarter-power rule is apparent in the non-linear increase in log-transformed mass with development for each species (Figures 1 and 2). The allometric relationship resulted in a difference of 3 orders of magnitude between the body masses of adult P. newmani and C. hyperboreus, whereas a significant increase in development time transpired only at the copepodid level (up to 4× longer development of C. hyperboreus CV).
Physiological relationships
Ingestion rate
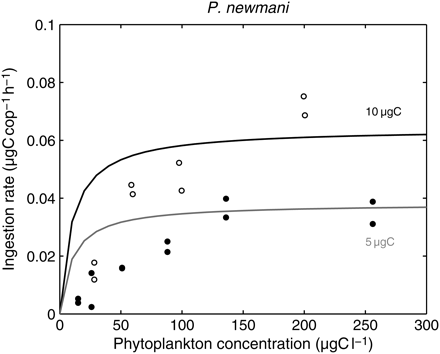
The ingestion rate determined the amount of phytoplankton biomass available to growth, after assimilation efficiency and metabolic demand (the respiration rate) were taken into account. According to Equations (4)–(7), the simulated rate of ingestion should increase with temperature, body mass, and food concentration towards an asymptote. Experimental data are noisy, but they generally agree with a non-linear increase in the ingestion rate with food concentration for P. newmani (Figure 3). The model's asymptote is the maximum ingestion rate, defined by the inverse of the handling time under the given conditions of temperature and body mass. In its current form, the model cannot reproduce the low ingestion rates observed at very low food concentrations.
Observed and simulated ingestion rates of P. newmani according to carbon concentration. Open circles, data from Tsuda and Nemoto (1987); P. newmani females fed Prorocentrum triestinum at 4°C (Tsuda and Nemoto, 1990, concluded that the Pseudocalanus species used for their 1987 paper was P. newmani). Dots, data from Tsuda and Nemoto (1990); P. newmani females fed Phaeodactylum tricornutum at 4°C. Simulations were run at 4°C for two realistic body masses of females (5 and 10 µgC).
Gut evacuation rate
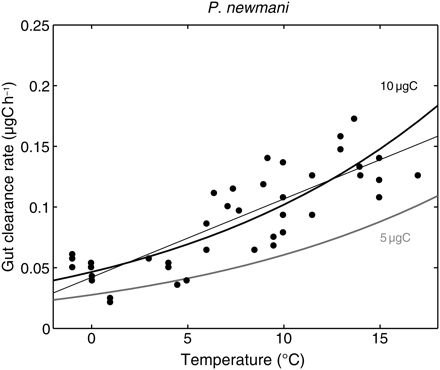
The handling time (H) was defined in the model as the time necessary to process a unit of food. According to Equation (6), H decreases with both temperature and body mass, but H is not a standard measurement in laboratory studies of copepods. However, the rate of gut evacuation has been measured for several species. It is equivalent to H–1, assuming that catching and ingestion times are negligible compared with digestion. Rates of gut evacuation of small calanoid copepod species increase with temperature (Dam and Peterson, 1988), well reproduced by the model for a reasonable range of adult P. newmani body masses (Figure 4).
Observed gut clearance rate and simulated inverse of handling time for P. newmani according to temperature. Dots and straight line, data reviewed in Dam and Peterson (1988). Simulations were run at non-limiting food conditions for two realistic body masses of females (5 and 10 µgC).
Maximum volume filtered
The dependence of the ingestion rate on food concentration was controlled by V, the maximum volume searched for food per unit of time. This metric cannot be measured directly. Through a rigorous mechanistic exploration of the feeding process in copepods, Cushing (1968) provided the estimates of V from ingestion experiments for the three Calanus congeners considered here. Despite having radically different methods for estimating V, our and Cushing's estimates were in general agreement. Cushing's estimate of 0.066 ml ind.–1 s–1 for C. hyperboreus fell within the range 0.059–0.0992 ml ind.–1 s–1 defined by the model for small (750 µgC) and large (1500 µgC) individuals developing at 5°C, the temperature of Cushing's experiments. Cushing's estimates of V for C. glacialis (0.0083 ml ind.–1 s–1) and C. finmarchicus (0.0033 ml ind.–1 s–1) were close to the lower end of the modelled range for those species: 0.0231–0.0539 ml ind.–1 s–1 for C. glacialis females of 200–400 µgC and 0.0108–0.0181 ml ind.–1 s–1 for C. finmarchicus females of 100–200 µgC. Importantly, the wide range of values for V between Calanus congeners reported by Cushing (1968) is adequately reproduced in the model through the allometric relationship.
Egg production rate
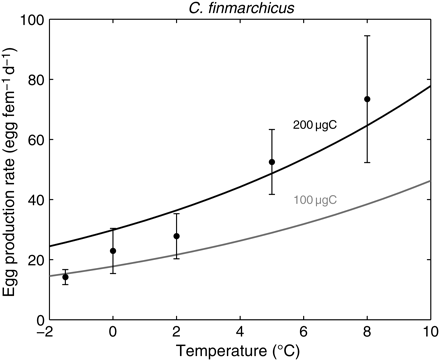
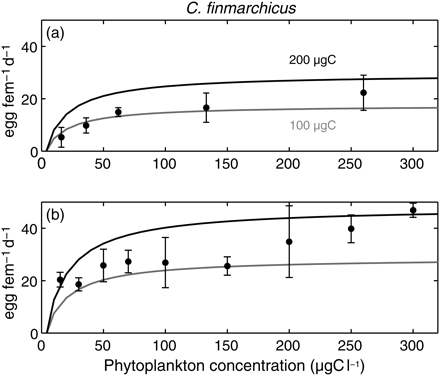
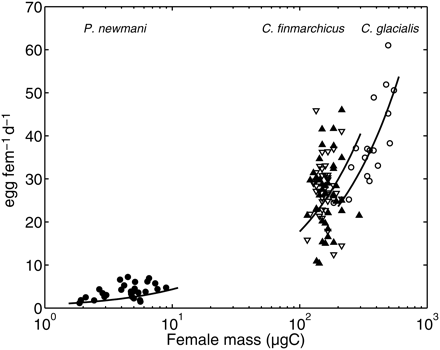
The EPR is the synergistic response of all physiological relationships with the various forcings, and a key element in future use of the model in an ecological framework. For a typical boreal range of C. finmarchicus female body masses, the model reproduced the observed exponential increase in the EPR with temperature (Hirche et al., 1997; Figure 5). The asymptotic increase in the EPR with food concentration observed by Hirche et al. (1997) was also clear in the model results (Figure 6). Finally, a common characteristic of both the observations and the model results is both the inter- and intraspecific increases in the EPR with female body mass (Figure 7).
Observed and simulated EPRs of C. finmarchicus according to temperature. Dots are data reviewed in Hirche et al. (1997), with whiskers denoting 1 s.d. Simulations were run at non-limiting food conditions for two realistic body masses of females (100 and 200 µgC).
Observed and simulated EPRs of C. finmarchicus according to carbon concentration at (a) 0°C and (b) 5°C. Dots are data from Hirche et al. (1997), with whiskers denoting 1 s.d. Simulations were run for two realistic body masses of females (100 and 200 µgC).
Observed and simulated EPRs of P. newmani, C. finmarchicus, and C. glacialis according to female body mass. Dots, Hopcroft and Kosobokova (2010) for Pseudocalanus spp. observed in the Chukchi Sea. Filled triangles, Hirche (1990) for C. finmarchicus from Arctic waters reared at 0°C and non-limiting food concentration. Open inverted triangles: Hirche (1990) for C. finmarchicus from Atlantic waters reared in the same conditions. Open circles, data from Hirche (1989) for C. glacialis reared at 0°C and non-limiting food concentration. Simulations (black lines) were run for conditions of temperature and food concentration as close as possible to those reported in the sources.
Discussion
The compupod framework represents mechanistically a few basic physiological processes of copepods: development, ingestion, and metabolic demand. The mechanistic implementation of those physiological processes relies on three basic physical, physiological, and biological relationships: the UTD (Gillooly et al., 2001), the quarter-power allometric scaling to body mass (Savage et al., 2004), and the Holling type II relationship with food concentration (Kiørboe, 2008). The modelling approach was validated here by applying it to four calanoid species, contrasting in size and life-cycle strategies.
The formulations implemented allowed the model to simulate two critical developmental responses of copepods to temperature and food concentration: a decrease in body size and development time in response to an increase in temperature (Figure 1), and an increase in body size concurrent with a decrease in development time in response to an increase in food concentration (Figure 2). The common set of model equations with species-specific parametrizations successfully reproduced the growth trajectories of copepods with adult body masses that differed by 3–4 orders of magnitude.
The use of these three basic relationships did not ensure a priori a correct representation of the physiological processes of copepods. The adequacy of the approach was first indirectly assessed through the outcome of the genetic algorithm tuning procedure, and ultimately tested against published measurements. As shown above, the physiological processes modelled were within the range of measured rates. In this, finding lies the success of the proposed modelling approach when applied to copepod species of different size, and the possibility to expand this work beyond the four species tested here.
Among the outputs of the model, the EPR is an integrative physiological response of compupods to ambient temperature and food concentration and is a key factor determining population dynamics. Beyond the commonly modelled relationships with temperature and food concentration (Figures 5 and 6), the ability of the model to express the relationship of the EPR to female body size (Figure 7) could be a key feature for addressing how environmental changes impact copepod populations dynamics. For bottom–up effects, if the food available decreases for all development stages, there could be a cumulative impact of smaller females producing fewer eggs. However, concurrent warming could compensate in part by increasing the mass-specific EPR. For top–down effects, smaller individuals are typically exposed to greater predation pressure (Eiane and Ohman, 2004). Again, warming could compensate the reduction in egg production by smaller females by increasing the mass-specific EPR, but in this case warming may also increase the predation pressure. Our framework could be used to explore the scales of variability and characterize tipping-points in the population dynamics of copepod species forced by a changing environment.
The parameter values themselves are also informative. Although body mass here spanned more than 3 orders of magnitude, the broadest range in parameter values is a factor of 4 for the parameters inferred from the literature, and only 2 for all soft parameters tuned by the genetic algorithm (Table 1). Nauplii consistently have a lower value of V0, implying a lower foraging efficiency, and a lower H0, implying a lower handling efficiency, both outcomes consistent with nauplius behaviour. Additionally, there are no clear relationships between those parameters and adult body size across species, suggesting that development remains the key life-cycle characteristic towards which effort should be concentrated.
A major design requirement of the model was that it should be suitable for population level implementation into ocean general circulation models. To achieve that goal, two processes required to complete the life cycle of most species have yet to be implemented: dormancy during a late development stage, and the decoupling of egg production from ambient food concentration. Both processes involve the mobilization of storage lipids. In the present framework, lipid storage could be approximated as a fraction of body mass. Dormancy is likely triggered by the accumulation of large quantities of lipids (Johnson et al., 2008), and its duration can be expressed by lowering the active metabolic demand on that storage. Preliminary tests showed that reducing metabolic demand in C. finmarchicus by 80% to achieve the dormant respiration rate measured by Saumweber and Durbin (2006) would lead to dormancy duration similar to that observed in dormant C. finmarchicus. Egg production from lipid storage is mandatory in the large Arctic C. hyperboreus, and it allows C. glacialis to initiate egg production in advance of the formation of ice algae and phytoplankton blooms (Smith, 1990). Based on values of the EPR in the literature, it would be straightforward to formulate egg production as a rate of mobilization of body mass in adult females.
Egg production is a key input to population dynamics, but mortality is the closing term. Interactions between mortality and the physiologically driven outputs from the model can have critical impacts on population dynamics. First, mortality is size-dependent. The model can accurately represent ontogenetic and species-specific sizes (mass). Moreover, size is a dynamic response of the model to variable temperature and food concentration. Mortality exerts itself through time, and the synergistic effect of mortality rate (size-dependent) and development time defines the survival rate of the population (Kiørboe and Hirst, 2008). Development rates are also a dynamic response of the model to variable environmental conditions. Hence, the ability of the model accurately to represent the trade-offs between development and growth will be a key feature in its ability to provide meaningful information once imbedded in a population model framework.
Copepods are a key component of pelagic ecosystems. Understanding how their population dynamics and eventually their biogeographic distribution would respond to physically (temperature, advection) and biologically (prey, predators) mediated impacts of environmental change is an important goal of modern oceanographic research. Resolving these issues is especially important in high latitude boreal/Arctic environment, where the impacts of climate changes are strongest (Walsh, 2008). Our compupod approach provides a mechanistic description of the influence of environmental conditions on copepods. This formulation, especially its inherent trade-offs around development and growth, may provide robust predictions for the response of copepods to environmental change.
Acknowledgements
The development of this paper was supported by a grant from the US National Science Foundation (OCE-0962074). We received helpful comments and support from J. Runge and S. Plourde, and many helpful comments from participants at the 5th International Zooplankton Production Symposium in Pucón, Chile. We are also grateful to R. Ji and two anonymous reviewers whose comments helped greatly in improving the manuscript.


