


Abstract
Since 1919, annual beach-seine sampling has been carried out along the Norwegian Skagerrak coast with the main objective of measuring the abundance of 0-group gadoids. Repeated incidents of abrupt and persistent recruitment collapses in gadoid populations have been observed locally. These collapses have been linked to gradual eutrophication, which has resulted in abrupt changes in the plankton community and deprivation of adequate prey for 0-group fish. Since 2002, the recruitment of 0-group gadoids has been very poor along the Skagerrak coast on a regional scale. At the same time, major changes in the plankton community have been observed. A regular and pronounced autumn bloom dominated by red-tide forming dinoflagellates such as large Ceratium spp. and the toxic Karenia mikimotoi has practically vanished, and a linear decrease in oxygen concentration at intermediate depths (30 m) that has been evident since the 1960s, was reversed around 2002. These changes would normally indicate improved environmental conditions. However, the recruitment failure in gadoids does not support this perception. Rather, the evidence points towards a potential shift in the plankton community that has resulted in gadoid recruitment failure.Johannessen, T., Dahl, E., Falkenhaug, T., and Naustvoll, L. J. 2012. Concurrent recruitment failure in gadoids and changes in the plankton community of the Norwegian Skagerrak coast after 2002. – ICES Journal of Marine Science, 69: 795–801.
Introduction
In a review of large-scale shifts in major ecosystems and the explanations thereof, Scheffer et al. (2001) provided examples that indicate that ecosystems may switch abruptly between alternative stable states. Several of the examples were related to ecosystem shifts that had resulted from abrupt environmental shifts, such as catastrophic events (e.g. storms, mass mortality attributable to pathogens). One example, however, was the gradually increasing eutrophication in shallow lakes. This caused shifts from a state of high transparency and submerged vegetation to low transparency (because of high phytoplankton concentration), and a subsequent loss of vegetation from shading. Hence, submerged vegetation held a key position in the clear-water state, which at a certain level of eutrophication shifted to a turbid state dominated by phytoplankton. In many ecosystems, including the diverse marine plankton community (Hutchinson, 1961), there are no obvious keystone species, i.e. one or few species on which the ecosystem hinges (Paine, 1969). Therefore, the question of shifts between contrasting states still remains controversial, and abrupt ecosystem shifts are counter-intuitive to many (Scheffer and Carpenter, 2003).
Along the Norwegian Skagerrak coast (Figure 1), repeated incidents of abrupt and persistent recruitment failures in 0-group gadoids have been recorded (Johannessen, 2010). Comprehensive testing in the field provided evidence to suggest that the collapses in recruitment were linked to changes in the structure of the plankton community and that the cause of these abrupt changes was gradually increasing eutrophication. In addition, abrupt drops in bottom-water oxygen, indicating structural changes in the plankton community (Johannessen and Dahl, 1996a, b), have been observed along the coast. Consequently, marine plankton communities may not behave in a simple dose–response manner, but may shift abruptly between alternative states. Here, we updated the time-series on 0-group gadoid recruitment along the Norwegian Skagerrak coast and show that recruitment from 2002 on has been at the lowest level on record. Time-series of oxygen, phytoplankton, and copepods have been analysed to explore potential changes in the pelagic community.
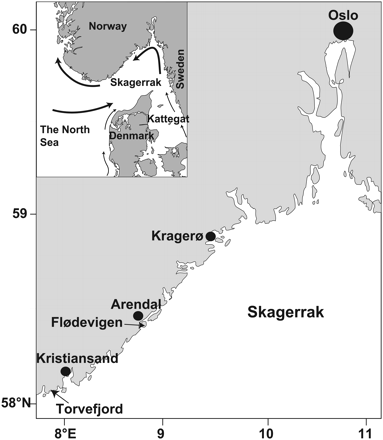
The Norwegian Skagerrak coast. Skagerrak has small tides with a marked stratified water column during most of the year. Arrows indicate the main surface circulation pattern.
Material and methods
Beach-seine sampling
Fish sampling was carried out at fixed stations during late September and early October of each year from 1919 (except during the period 1940–1944) using a beach-seine (15 mm stretched mesh). The seine was deployed from a boat rowed in a semicircle from the shore. Detailed descriptions of each station ensured that the same bottom area (up to 700 m2) was always covered (for more detail on gear and sampling, see Tveite, 1971). 0-group gadoids are the target fish of the sampling programme, but other fish are counted and measured by length. Average catch per beach-seine haul was used as an index of year class for three 0-group gadoid species: cod, pollack (Pollachius pollachius), and whiting (Merlangius merlangus). The time-series were smoothed by computing the 7-year moving average twice (i.e. smoothing the raw time-series, then smoothing the smoothed time-series). This resulted in a locally weighted 13-year moving average where the midpoint is included seven times in the estimate average, the nearest points on both sides are included six times, then five times, etc. Double-smoothing results in a smooth curve with more local detail than a 13-year moving average.
Currently, ∼130 beach-seine stations are included in the sampling programme, of which 38 have been sampled since 1919. Trends in 0-group gadoids were described based on these 38 stations, which are located between Torvefjord, west of Kristiansand, and Kragerø (Figure 1).
Bottom flora
In response to the extensive mortality of eelgrass (Zostera marina) throughout the North Atlantic in the early 1930s (Short et al., 1988), observations of bottom-flora coverage from the surface were recorded from 1934 on using an aquascope. From these observations, an index of the bottom-flora (both eelgrass and macroalgae) coverage was estimated on a relatively coarse scale based on observations at the 38 beach-seine stations sampled since 1919. As these observations are semi-quantitative and poor visibility in some years made observations difficult, individual years should not receive too much weight. Consequently, only the trend in terms of the double 7-year moving average, as described above, is presented here.
Phytoplankton
The concentration of Chl a a depth of 0–3 m was measured every Monday, Wednesday, and Friday in Flødevigen Bay, Arendal, on the south coast of Norway (Figure 1), using the fluorescent method of Strickland and Parson (1968). Analyses of trends in Chl a were based on mean values in spring, summer, and autumn and on annual averages. Spring means estimations were based on measurements obtained between Julian days 20 (20 January) and 119 (100 d later), summer means between days 120 (1 May) and 214 (105 d later), and autumn means between days 215 (15 August) and 314 (14 November, 100 d later). Selection of dates for the seasonal periods was based on measurements for the 10-year period 1990–1999 (Johannessen et al., 2006), where day 20 corresponds to the earliest observed start of the spring bloom, day 120 approximately to when the mean Chl a concentration fell below the overall average of all measurements (2.26 µg l–1), day 115 approximately to when the mean Chl a concentration exceeded the overall average value (start of the autumn bloom), and day 114 approximately to when the mean Chl a concentration fell below the overall average. The annual pattern in Chl a was estimated for two periods, 1989–2001 and 2002–2010. The choice of 2002 as the start of the second period was based on a significant change in the autumn bloom conditions that year. For each period, the data were pooled according to Julian days (1–360), then smoothed by estimating the 15-day moving average twice [i.e. first smoothing the raw data, then smoothing the smoothed series, from day −30 (1 December) to day 390 (30 January)].
Copepods
Zooplankton sampling was carried out fortnightly between January 1994 and December 2010. The zooplankton sampling site (Arendal Station 2) is located at 58°23′N 08°49′E, northern Skagerrak, ∼1 nautical mile offshore (Figure 1). The water depth at the site is 105 m. Vertical hauls were made from 50 m to the surface with a WP2 plankton net (0.25 m2, 180 μm mesh size; UNESCO, 1968). Each sample was split with a Motoda splitter device (Motoda, 1959). One half of the sample was preserved in 4% borax-buffered formaldehyde-seawater solution for species identification and enumeration, and the other half used for biomass measurement. Data on zooplankton biomass are not presented here.
Copepods were identified into three main taxonomic categories (Calanus spp., other calanoid copepods, and cyclopoid copepods). From 2000 on, copepods were identified to lower taxonomic levels (genus/species). Species of Pseudocalanus spp. and Paracalanus spp. were treated as one taxonomic group (Paracalanus/Pseudocalanus), and Calanus finmarchicus and C. helgolandicus were grouped as Calanus spp.
Oxygen
Johannessen and Dahl (1996a, b) analysed oxygen measurements obtained annually between 1927 and 1993 at 31 fixed stations along the Skagerrak coast between Kristiansand and Oslo (Figure 1). The measurements were carried out during the beach-seine survey in the latter half of September each year when oxygen is at a minimum at intermediate depths (for detail, see Johannessen and Dahl, 1996a). At all depths ≥10 m analysed, oxygen concentrations decreased throughout the entire study area. Here, the time-series have been updated for intermediate depths (30 m) and bottom waters (variable depths affected by sedimentation). The trends in oxygen are presented as annual means of all stations (except stations with permanent anoxia). Before estimating annual means, measurements for each station and depth were standardized to unit variance and zero mean. Hence, all stations will have the same impact on the estimated trend. Changes in oxygen are expressed in terms of standard deviations (for actual oxygen levels, see Johannessen and Dahl, 1996a). The time-series were smoothed by computing the double 7-year moving average.
Temperature
Temperature 1 m deep has been measured daily since 1924 in Flødevigen Bay. Sea surface temperature in these waters is generally lowest in February and March and warmest in July and August. Based on these daily measurements, trends in winter and summer temperature have been estimated.
Results
0-group gadoids and bottom flora
In the Norwegian Skagerrak, the year-class strength of 0-group cod, pollack, and whiting has varied substantially (Figure 2). In addition, there have been significant long-term trends. During the 1930s and the 1940s, cod abundance was generally low (Figure 2a), then from the early 1950s, the catches increased gradually to a relatively high level in the 1960s, before decreasing again in the 1970s. Since 2000, the abundance of 0-group cod has been at the lowest level on record.
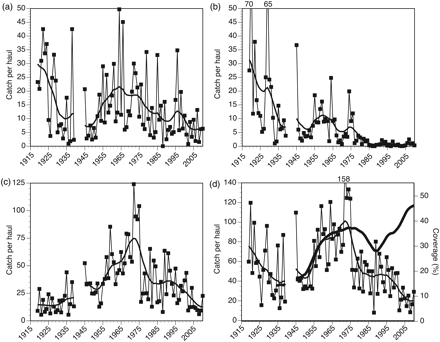
Average catch of 0-group (a) cod, (b) pollack, (c) whiting, and (d) sum of cod, pollack, and whiting plus bottom-flora coverage (thick line) at 38 beach-seine stations along the Skagerrak coast, 1919–2010. Smoothed curves correspond to 7-year moving averages estimated twice (see text for detail).
The abundance of 0-group pollack (Figure 2b) decreased substantially from the late 1920s. The average catches of pollack after 1985 were just 2.5% of the average before 1930. The last year with reasonably high catches of 0-group pollack was 1976. Except for the recruitment collapse in pollack, the fluctuations of pollack and cod follow much the same pattern, with marked troughs in the 1930s and the 1940s.
The abundance of 0-group whiting (Figure 2c) followed an opposite trend to that of pollack until the mid-1970s, with increasing abundance from around 15 whiting per haul in the 1920s to around 100 in the 1970s. However, concomitant with the drop in cod and pollack in the mid-1970s, there was an abrupt drop in whiting to an average of ∼33 fish per haul. There was another drop in 2002, to an average level of 14 whiting per beach-seine haul.
In Figure 2d, the summarized abundance of 0-group cod, pollack, and whiting is plotted against the trend in bottom-flora coverage (since 1934). Bottom flora and particularly eelgrass meadows have long been recognized as important habitat for juvenile gadoids and other fish (Blegvad, 1917). Based on logbook notes by cruise leader Ragnvald Løversen, there was mass mortality of eelgrass in 1933 along the coast. The level before 1933 is unknown, but according to Løversen's descriptions, the reduction in eelgrass cover must have been substantial. The bottom-flora coverage increased slowly from the 1930s to the late 1940s, followed by a relatively rapid increase in 1950s. Except for a temporary decrease in the mid-1980s, the bottom flora continued to increase to the highest level on record in recent years. Concurrent with the decimation of eelgrass, there was a conspicuous decrease in the abundance of 0-group gadoids. From the 1930s on, the pattern of regrowth of bottom flora was closely followed by an overall abundance increase in gadoids. However, the abrupt reductions in gadoids in the mid-1970s and after 2002 are decoupled from bottom-flora coverage. The overall abundance of 0-group gadoids after 2002 was only about half that after the decimation of eelgrass in the 1930s.
Phytoplankton
There is an indication of a falling trend in annual mean algal biomass (Chl a) during the period 1989–2010 (a = −0.027, linear regression coefficient), but it is too early to conclude that this is a significant change (p = 0.075, two-sided Student's t-test). In spring, there was a weak increase in algal biomass (a = 0.028, p = 0.313), and in summer a slight decrease (a = 0.035, p = 0.093), but neither trend is statistically significant. However, in autumn, there was a significant decrease in algal biomass (a = −0.085, p = 0.011; p = 0.011 log-transformed data; p < 0.05 using Bonferroni correction for multiple samples). Figure 3a shows that the algal biomass in autumn was highly variable until 2001, but that from 2002 on, the algal biomass and its interannual variability was substantially lower.
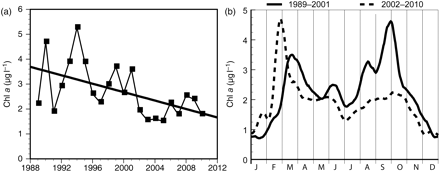
Chl a (a) mean for autumn 1989–2010, and (b) seasonal pattern for the periods 1989–2001 and 2002–2010 (see text for more detail).
The seasonal pattern in algal biomass during the period 1989–2001 was characterized by a spring bloom in March, relatively low algal biomass in summer, and a substantial autumn bloom (for seasonal patterns in nutrients and primary productivity, see Johannessen et al., 2006). From 2002 to 2010, the spring bloom appeared slightly earlier and the algal biomass was higher (though not statistically significant). During summer, the algal biomass was slightly lower during the most recent period (2002–2010), whereas the pronounced autumn bloom practically vanished. The autumn bloom was dominated by red-tide species, large Ceratium spp. and the toxic Karenia mikimotoi (Dahl and Johannessen, 1998).
Copepods
The copepod time-series is short, which renders the results uncertain. For most species/groups, there were no marked trends in abundance (Figure 4a), including Calanus spp. However, both Paracalanus/Pseudocalanus spp. and Oithona spp. decreased substantially after 2002. Paracalanus/Pseudocalanus were typically most abundant around July (Figure 4b). This period has been identified as critical for survival and recruitment of 0-group cod in these waters (Johannessen, 2010), and years with abundant Paracalanus/Pseudocalanus (or Calanus) have coincided with relatively strong year classes of cod in the North Sea (Rothschild, 1998).
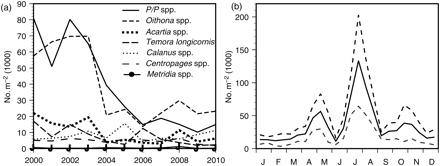
Copepod (a) annual means 2000–2010 (P/P, Paracalanus/Pseudocalanus), and (b) seasonal mean abundance ±1 s.d. for Paracalanus/Pseudocalanus spp., 2000–2010.
Oxygen
There was no marked trend in oxygen concentration along the south coast of Norway at intermediate depths (30 m) until the mid-1960s (Figure 5a), but then there was an almost linear decrease until the turn of the century. The lowest oxygen concentration was in 2002, after which the trend reversed. The data indicate an abrupt increase to a higher possibly stable level, rather than a continuously increasing trend. Johannessen and Dahl (1996a) argued that the decreasing oxygen trend at intermediate depths was a result of the increasing importance of heterotrophic relative to autotrophic processes in the pelagic community.
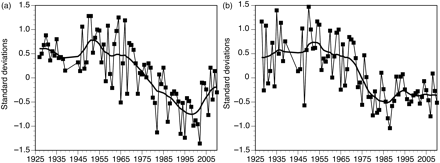
Historical trends in oxygen (a) 30 m deep, and (b) at the seabed (variable depth) at ∼30 fixed stations along the Norwegian Skagerrak coast, 1927–2010. Smoothed curves correspond to 7-year moving averages estimated twice after standardization by station and depth.
In bottom waters (variable depths affected by sedimentation), there was no trend in oxygen concentration until the mid-1970s, when there was an abrupt drop (Figure 5b), after which there was no trend. Most of the sampling stations are situated in fjords with sills, in which the frequency of renewal of bottom water may vary from several times per year to once every few years. As this may potentially obscure the rate of change in bottom-water oxygen, Johannessen and Dahl (1996b) analysed exposed stations without a sill and found that the rate of exchange appeared as a flip-flop mechanism.
Temperature
There was no trend in surface temperature in winter from the 1920s to the late 1980s, when there was an abrupt increase of ∼2°C (Figure 6a). Summer temperature showed no marked trend until around 1990, followed by a gradual increase to the present level, which is ∼1.5°C above the level before the increase.
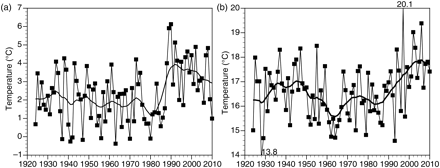
Mean sea surface temperature in (a) winter, and (b) summer, 1924–2010. Smoothed curves correspond to 7-year moving averages estimated twice.
Discussion
Johannessen (2010) reported several incidents of abrupt and persistent recruitment collapse in 0-group gadoids locally along the Norwegian Skagerrak coast. The collapses were simultaneous for cod, pollack, and whiting, but just cod was used to test the underlying mechanism behind the collapse. The studies revealed that recruitment in 0-group cod in these waters is determined mainly between late June and mid-August, after the cod have settled. High rates of survival were observed in relation to a diet of large herbivorous copepods (Calanus), whereas a diet of hyperbenthic prey such as 0-group gobies, shrimps and mysids, and small copepods resulted in low rates of survival and poor recruitment. Copepods derive lipids from phytoplankton (Lee et al., 1971), and evidence suggests that the propensity to accumulate wax esters decreases from herbivores through omnivores to carnivores (Sargent and Falk-Petersen, 1988). Therefore, the recruitment collapses observed were most likely linked to abrupt changes in the plankton community that deprived the 0-group gadoids of high-quality foods.
Johannessen and Dahl (1996a, b) reported abrupt decreases in bottom-water oxygen in the mid-1970s (Figure 5b) and suggested that this was a result of structural changes in the plankton community. Concurrently, there was an abrupt drop in the abundance of 0-group gadoids in these waters (Johannessen, 2010; Figure 2). Hence, independent observations points towards abrupt changes in the plankton community along the Norwegian Skagerrak coast in the mid-1970s.
Estimated bottom-flora coverage, which is dominated by eelgrass on the beach stations, has never been higher than since 2000. The increased coverage in recent years may be related to reduced algal biomass in summer and autumn, resulting in lower turbidity, improved light conditions, and hence growth at greater depths. High bottom-flora coverage should normally have resulted in increased abundance of 0-group gadoids. However, the abundance after 2000 is the lowest on record, with just 50% of the former minimum, which followed the decimation of eelgrass in the 1930s. Johannessen (2010) rejected overfishing as a possible cause of the recruitment collapses because whiting is a non-commercial species in these waters and it is not taken in large numbers as bycatch. The abundance of whiting was particularly affected after 2000.
The recent decrease in 0-group gadoids appears abrupt (Figure 2). However, in contrast to the event in the mid-1970s, there was no concurrent decrease in bottom-water oxygen. On the other hand, the bottom water remained with the same low concentration of oxygen, suggesting that the mechanism underlying increased sedimentation in the mid-1970s still operates. Aure et al. (1996) estimated that the consumption of oxygen increased by ∼50% in one of the fjord basins of the Skagerrak coast at the time of the abrupt drop in bottom-water oxygen, which suggests a substantial increase in sedimentation of organic matter. Andersson and Rydberg (1988) reported a similar increase in oxygen consumption in the deep water of Kattegat (Figure 1) between 1971 and 1982. Lindahl and Hernroth (1983) reported that the autumn bloom of Ceratium spp. and K. mikimotoi started to appear around the mid-1970s. Hence, one potential mechanism for the decrease in bottom-water oxygen could have been sedimentation of the relative intensive autumn bloom. However, the substantial reduction in the autumn bloom after 2002 without changes in bottom-water oxygen concentration does not support this hypothesis.
Despite there having been no change in bottom-water oxygen concentration after 2000, the reversed trend in oxygen concentration at intermediate depths and close to the disappearance of the autumn bloom does suggest that there have been changes in the plankton community concurrent with the extraordinary poor recruitment of 0-group gadoids. Although the copepod time-series is short, substantial reductions in Oithona spp. and Paracalanus/Pseudocalanus support the proposition of a changed plankton community. Oithona spp., which are small and carnivorous on microprotozooplankton (Nielsen and Sabatini, 1996), are probably not important prey for 0-group gadoids. However, Rothschild (1998) concluded that large year classes of cod in the North Sea appeared to require large year classes of either Paracalanus/Pseudocalanus or Calanus, but not both. Calanus finmarchicus abundance reduced greatly in the North Sea/Skagerrak area (Beaugrand, 2003) well before our copepod sampling started. Interestingly, the seasonal maximum abundance in Paracalanus/Pseudocalanus (Figure 4b) was around July, which concurs with the critical period for recruitment of cod in these waters (Johannessen, 2010). Consequently, the poor recruitment of 0-group gadoids in recent years may be related to the reduced abundance of Paracalanus/Pseudocalanus.
The results presented here suggest that there were concurrent recruitment failure in gadoids and changes in the plankton community along the Norwegian Skagerrak coast after 2002. During the same period, there was poor recruitment in many fish stocks in the North Sea (ICES, 2010), notably cod, herring (Clupea harengus), whiting, haddock (Melanogrammus aeglefinus), Norway pout (Trisopterus esmarkii), and lesser sandeel (Ammodytes marinus). Hence, the recruitment problem is possibly a broader-scale phenomenon.
The local recruitment collapses along the Norwegian Skagerrak coast were linked to structural changes in the plankton community following gradually increasing nutrient loads (Johannessen, 2010). Likewise, the decrease in bottom-water oxygen concentration in the mid-1970s suggested abrupt changes in the plankton community as a result of increased nutrient loads (Johannessen and Dahl, 1996a, b). Nutrient concentration itself is not problematic for marine organisms, except when its high level leads to increased phytoplankton biomasses and organic load causes anoxia. However, the changes in oxygen concentration were not the cause of the recruitment collapses (Johannessen, 2010), merely symptoms of changes in the plankton community. This suggests that marine plankton communities may shift abruptly from one state to another. A possible mechanism for such changes is that increased nutrient loads may have affected completion in phytoplankton and thereby reduced the resilience (Holling, 1973) of the system. This may render the system vulnerable to shifts through environmental perturbations. There is evidence to suggest that the nutrient loads of these waters have dropped in recent years (Lindahl et al., 2009). On the other hand, both summer and winter temperatures have increased. Temperature may affect competition in the plankton community and reduce the resilience of the system. Hence, the summarized environmental changes over time (e.g. temperature, eutrophication) may have rendered the system vulnerable to shifts. We believe that it is too early to conclude that the changes observed along the Norwegian Skagerrak coast after 2002 are the result of persistent changes in the plankton community. However, in light of the historical persistent recruitment collapses, the results presented here are worrying.
Acknowledgements
Zooplankton sampling was supported by the Norwegian Pollution Control Authority, through the Coastal Water Monitoring Programme.
References
Author notes
Handling editor: Bill Turrell
