-
PDF
- Split View
-
Views
-
Cite
Cite
Frode B. Vikebø, Anton Korosov, Erling Kåre Stenevik, Åse Husebø, Aril Slotte, Spatio-temporal overlap of hatching in Norwegian spring-spawning herring and the spring phytoplankton bloom at available spawning substrata, ICES Journal of Marine Science, Volume 69, Issue 7, September 2012, Pages 1298–1302, https://doi.org/10.1093/icesjms/fss083
Close - Share Icon Share
Abstract
Analyses of bottom substrata demonstrated that a potential spawning area of 13 490 nautical miles2 is available for Norwegian spring-spawning (NSS) herring on the Norwegian shelf between 59 and 71°N. However, the availability of suitable substrata differed significantly on a latitudinal scale; 60% of the available spawning area was north of 67°N. However, the spatial distribution of larvae indicated that the bulk of the adult population wintering off northern Norway in the period 1998–2007 migrated farther south and upstream to spawn. This suggests benefits attributable to extra costs accompanying the spawning migration. To test whether southern spawning is beneficial with regard to overlap between herring larvae and their prey, remotely sensed chlorophyll a data from SeaWiFS were used as a proxy for the onset of phytoplankton bloom (OSB) in discrete bins along the Norwegian coast and linked to interannual variation in the observed average timing of larval hatching during the years 1998–2007. There was a delay in OSB with increasing latitude of 37 d within the spawning habitat of NSS herring. Overlap between larval hatching and OSB was clearly highest in the south, suggesting that match with prey availability may be an important factor in the selection of spawning grounds by NSS herring.Vikebø, F. B., Korosov, A., Stenevik, E. K., Husebø, Å., and Slotte, A. 2012. Spatio-temporal overlap of hatching in Norwegian spring-spawning herring and the spring phytoplankton bloom at available spawning substrata. – ICES Journal of Marine Science, 69: .
Introduction
Energy demand in Norwegian spring-spawning (NSS) herring (Clupea harengus) undertaking spawning migration and offspring production is taken from reserves obtained during summer feeding, because the stock does not feed during winter (Slotte, 1999). Slotte and Fiksen (2000) showed that, although there is spawning all along the coast, the southward spawning migration distance typically increases with the length and condition of the parent fish, indicating that southern spawning is favoured over spawning farther north. The spawning strategies of the adult depend on the individual internal state, the cost of migration, and the probability of progeny survival. In turn, the selection of spawning ground and timing by the parent fish strongly affect the environmental exposure of the offspring.
Survival by the early stages of fish is believed to be the dominant factor regulating recruitment (Sætre et al., 2002), and there are many hypotheses on which processes are most important for survival and how they are linked to variability in climate. Both growth and predation are believed to be important and are often linked (Bailey and Houde, 1989). Hjort (1914) hypothesized that the survival of first-feeding larvae depends on the availability of sufficient and appropriate prey, as well as the successful transport of spawning products from the spawning grounds to favourable nursery grounds. This hypothesis has been developed further and has been followed by hypotheses such as “bigger is better” (Miller et al., 1988), “member–vagrant” (Iles and Sinclair, 1982), “stable ocean” (Lasker, 1975), “turbulence affecting encounter rates” (Rothschild and Osborn, 1988), “loophole” (Bakun and Broad, 2003), and “match–mismatch” (Cushing, 1972, 1990). Spatio-temporal overlap between larval NSS herring and suitable prey, most noticeably Calanus finmarchicus eggs and nauplii, is central to the match–mismatch hypothesis as a necessary but not sufficient criterion for the enhanced survival of the offspring. In other words, despite good feeding opportunities for larvae, there may still be elevated levels of mortality before recruitment into the stock, caused by, for instance, density-dependence or high concentrations of predators.
The onset of C. finmarchicus spawning is commonly assumed to follow immediately the onset of the spring phytoplankton bloom (OSB; Melle and Skjoldal, 1998; Kaartvedt, 2000). However, owing to the lack of continuous spatio-temporal data coverage of phytoplankton and zooplankton, it has been difficult to address this plausible hypothesis systematically (Platt et al., 2003). Recent advances in remote sensing of the ocean in the visible range allow us to assess several water-quality parameters including chlorophyll a (hereafter, Chl a), suspended mineral matter, and coloured dissolved organic matter (O'Reilly et al., 1998; Lee et al., 2002; Doerffer and Schiller, 2007). The US agency NASA provides satellite data with global coverage at high spatial (up to 4 km) and temporal (up to 1 d) resolution (oceancolor.gsfc.nasa.gov, www.globcolour.info). They support the studies of Chl a and, therefore, phytoplankton dynamics (Robinson, 2010), which can be used to estimate the parameters of spring phytoplankton blooms such as onset, duration, and intensity (Henson et al., 2009). Remote sensing data suffer from undersampling to a lesser degree than in situ data, but lacunas emerge from cloud screening or inaccuracies in the applied data-processing algorithms (Siegel et al., 2000). Spatial averaging or interpolation is applied as a gap-filling method to build continuous time-series of Chl a and other parameters (Korosov et al., 2009).
Runnstrøm (1941) used grabbing equipment to describe in detail the substrata that NSS herring prefer to use during spawning. He found that such substrata as sand, coarse sand, shell sand, gravel, stones, and rocks were preferred at depths down to 250 m on the Norwegian shelf. However, no study has tried to quantify the availability of spawning substrata on a latitudinal scale. If the availability of spawning substrata is a limiting factor in the selection of spawning grounds by NSS herring, it may also explain the spawning distribution along the coast.
Following the above rationale, the objective of the present study was to explore the larval distributions of NSS herring on a latitudinal range in relation to the available spawning substrata, and also the overlap between the larvae and their prey along the Norwegian coast. The work supplements earlier studies addressing the importance of spatio-temporal variability in offspring temperature exposure (Slotte and Fiksen, 2000), dispersal (Vikebø et al., 2010), and predation (Husebø et al., 2009) in scoping spawning strategies. By utilizing the Sea-viewing Wide Field-of-view Sensor (SeaWiFS) Chl a data collected by remote sensing, along with the observational records from larval surveys and mapping surveys for bottom substrata, the questions addressed are the timing of the OSB at suitable spawning substrata of NSS herring and how it varies between years. Also, how does the timing of first-feeding NSS herring larvae match with the OSB throughout these sites?
Material and methods
We focus on the spatio-temporal overlap between larvae and the OSB, where “match” is here defined to be when OSB is before the larvae hatch.
SeaWiFS 1998–2007
SeaWiFS was launched on board the SeaStar spacecraft on 1 August 1997 (O'Reilly et al., 1998). Until 31 December 2010, NASA collected SeaWiFS data, processed them with scientific algorithms, and disseminated the information worldwide (NASA OBPG: oceancolor.gsfc.nasa.gov). Raw L1 data collected from the sensor consist of the measurements of top-of-atmosphere radiances in eight bands (six in the visible and two in the near-infrared). The procedure of atmospheric correction is applied for calculating water-leaving reflectance, and the ocean colour algorithm (OC4) is applied to retrieve concentrations of Chl a. Data from individual swaths are binned onto global maps of Chl a spatial distribution, temporally averaged, and provided at the NASA website in different formats.
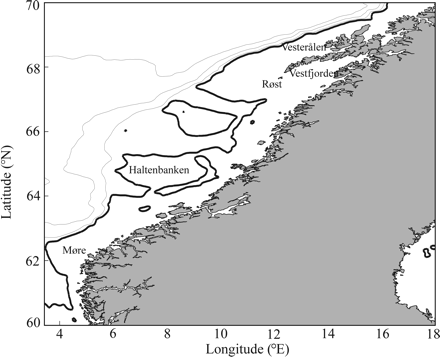
In this study, we used maps of Chl a values averaged over 8 d for compromising between good temporal resolution and high-enough spatial coverage. Timing of OSB is determined by a threshold value estimated from the median Chl a values in the area (Figure 1) over the entire period, estimated to be ∼0.93 mg Chl a m−3. Quantification of OSB was carried out in bins of 2° latitude from 60 to 70°N. Whenever the mean bin Chl a values rose above the median within the bins, this was reported as the onset of the bloom. In comparison, Henson et al. (2009) used a threshold defined as 5% above the annual median and a duration of at least 3 d, and Stenevik et al. (2007) used a threshold of 1 mg Chl a m−3 for Ocean Weather Station Mike (66°N 02°E). As OBC varies significantly with distance from shore, we limited the bins to account only for waters with bottom depths <300 m. Because of topographic steering of the waters as it flows northeast along the coast from the spawning grounds, this largely covers the drift route of herring larvae as eggs are spawned at depths shallower than ∼250 m. In comparison, Henson et al. (2009) defined bins according to an objective cluster analysis of temporal bloom characteristics to define areas of similar behaviour of Chl a.
The area with depths less then 300 m off the Norwegian coast from which SeaWiFS data were processed. Contour lines indicate depths of 300 (bold), 500, 1000, and 2000 m.
Detailed data and analyses of the potential spawning grounds
Data were compiled from the Norwegian Mapping Authority (www.statkart.no), which maps bottom substrata by grabbing along most of the Norwegian coast using the same descriptions as Runnstrøm (1941) in terms of substrata. Such data on bottom substrata were not available digitally, so the method used to analyse potential spawning grounds along the Norwegian coast used depths limited to areas shallower than 250 m. On a latitudinal range, the area was limited to 59–71°N, which historically is the main area of reported spawning of NSS herring. Based on the detailed maps of the Norwegian coast showing substratum types recorded by the Norwegian Mapping Authority, the percentage of the available spawning substratum within rectangles of 5 × 5 nautical mile2 were quantified. The available area for spawning (nautical mile2) was summed within 1° latitudinal bins to seek latitudinal trends in the data.
Herring larvae
The abundances of herring larvae are here taken to be the normalized distributions (adding up to 1 for each year) based on the annual average number of individuals per m2 observed within the different subareas of 2° latitudinal bins from 60 to 70°N. The method of estimating mean hatching date (averaged over all spawning areas, weighted by larval abundance) is described in Husebø et al. (2009), and it is based on the abundance of larvae recorded during surveys on the Norwegian shelf in March/April. Larvae were staged according to Doyle (1977), and the number per substage (1a–2c) for the first two stages was estimated. The numbers of larvae that should have hatched, according to the numbers found in the substages during each cruise, were back-calculated with 10% daily mortality (Christensen, 1985), using the midpoint of the larval cruise as the starting point for the back-calculation. The estimated day on which 50% of the sampled larval population should have hatched was used as a measure of the mean hatching date in the analyses.
Results
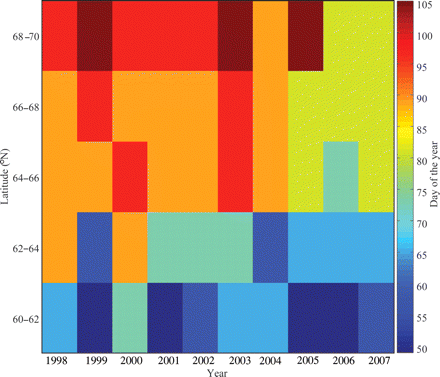
By summarizing the days when SeaWiFS Chl a values exceed the threshold of 0.93 mg Chl a m−3 year−1 and bin, there was a clear trend towards delayed OSB from south to north (Figure 2). Also, OSBs were earlier in the three most recent years relative to the previous years for the three northernmost bins and partly for the bin covering 62–64°N. No temporal trend was indicated for the southernmost bin.
Mean day of OSB, indicated by the colour scale, in five bins of 2° each in a latitudinal direction over the Norwegian shelf shallower than 300 m, as deduced from SeaWiFS data.
Averaged over the 10-year period, the SeaWiFS data revealed a delay in spring bloom of 37 d with increasing latitude within the spawning habitat of herring (Table 1). However, the three northernmost bins, covering a stretch from about Haltenbanken to Vesterålen, only displayed a difference of 8 d. There was significant interannual variability in the OSBs, more so at Møre than at Røst (Table 1). The main spawning ground of NSS herring at Møre displays an s.d. in OSB of 10.8 d compared with the spawning grounds at Røst, which has a standard deviation of just 5.6 d.
Mean day of OSB and the corresponding s.d. on the Norwegian continental shelf shallower than 300 m, based on SeaWiFS data.
| Parameter . | Value . | Møre . | Haltenbanken . | Røst . | Vesterålen . |
|---|---|---|---|---|---|
| Latitudinal bin (°N) | 60–62 | 62–64 | 64–66 | 66–68 | 68–70 |
| Mean day of spring bloom | 58 | 71 | 87 | 88 | 95 |
| s.d. | 8.4 | 10.8 | 7.0 | 5.6 | 8.6 |
| Parameter . | Value . | Møre . | Haltenbanken . | Røst . | Vesterålen . |
|---|---|---|---|---|---|
| Latitudinal bin (°N) | 60–62 | 62–64 | 64–66 | 66–68 | 68–70 |
| Mean day of spring bloom | 58 | 71 | 87 | 88 | 95 |
| s.d. | 8.4 | 10.8 | 7.0 | 5.6 | 8.6 |
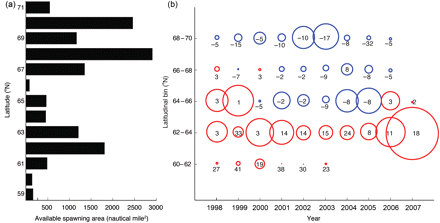
The analyses of substratum availability demonstrated that a total area of 13 490 nautical miles2 is potentially available for spawning at depths down to 250 m along the Norwegian shelf between 58 and 70°N, but availability differs significantly on a latitudinal scale (Figure 3a). Of the available spawning area, >60% is north of 67°N, whereas the southernmost spawning grounds (south of 60°N) made up <7% of the available spawning substrata. Particularly off Møre, near Røst, and north of Vesterålen, there are notable areas with suitable substrata.
(a) Available spawning areas with suitable spawning substrata for NSS herring within 1° intervals on a latitudinal scale. (b) Observed distribution of larvae along the Norwegian coast divided into bins of 2° latitude, indicated by red (blue) circles if there is a match (mismatch) with the OSB. The diameters of the circles reflect normalized distributions within each year based on the average number of larvae per m2 for each bin and year. The numbers associated with each circle indicate the number of days by which the OSB precedes (follows) the observations of larvae at sea.
High concentrations of larvae were found only in the latitudinal bins from 60 to 66°N for most years, except for 2002 and 2003, when there were relatively large concentrations of larvae also farther north between 68 and 70°N (Figure 3b). The diameters of the circles in Figure 3 show the normalized distribution within each year based on the average number of larvae per m2 for each bin and year. Hatching in the two southernmost bins results in a match with prey availability every year, but hatching in the bin ranging from 64 to 66°N results in a match in 1998, 1999, 2006, and 2007 and a mismatch in the years 2000–2005. Hatching in the two northernmost bins results in a mismatch with prey availability in most years by ∼1–2 weeks. Hatching in the northernmost bin in 2005 results in a mismatch with prey by >4 weeks. In years of relatively more spawning in the north, hatching tends to be early relative to the spring bloom.
Discussion
Despite the availability of suitable spawning substrata being higher in the north, the bulk of the NSS herring stock wintering off northern Norway choose to migrate south and upstream to spawn. Clearly, there are additional costs concomitant with this lengthy southward spawning migration. Better feeding conditions for the adults migrating into the Norwegian Sea after spawning and higher temperatures experienced by the larvae may explain partly why most adult herring still migrate to the main spawning ground at Møre, but here we show that a match with prey availability for the larvae can be an additional important contributory factor. In fact, the results show that contrary to the northern spawning grounds at Røst and northwards, spawning at Møre results in a match with the OSB and therefore with prey availability during every year in the period 1998–2007. Spawning even farther south may result in an OSB much earlier than hatching, and consequently, prey sizes inappropriate for the larvae.
Husebø et al. (2009) showed that early hatching in the period 1987–2005 favoured enhanced recruitment. Adult NSS herring targeting spawning grounds favourable for early spawning with respect to a match with prey availability need to aim for the main spawning ground at Møre. According to our findings here, early hatching would not lead to a match with prey availability on the northern spawning grounds. Hence, with hatching recently being displaced partly towards northern spawning grounds such as Røst, the link between early hatching and strong recruitment may weaken. Also, as shown by Husebø et al. (2009), hatching date depends on overwintering conditions; high temperatures in the overwintering areas result in early hatching. However, it is challenging to predict how climate variability and change may affect the balance between OSB and the time of hatching. An obvious benefit of early hatching is a prolonged feeding season for the adults. In contrast, if adult NSS herring target spawning grounds with little variation in OSB, the northern spawning grounds would be more favourable. A more predictable time of the OSB would ensure a greater chance of success in matching the OSB, but concomitantly, hatching would need to be delayed relative to more-southern spawning. Also, the light availability needed for feeding, and the temperatures, are less than at the spawning grounds farther south, although this is partly compensated for by delayed hatching. Although the bulk of the spawning stock utilizes the southern spawning ground at Møre, a smaller portion of the stock spawns farther north. However, the fish that spawn in the northern area are often smaller first-time spawners and fish in poor condition (Slotte and Fiksen, 2000), i.e. individuals that have less potential to migrate and that may therefore be restricted to using less beneficial areas for spawning.
By determining the OSB in terms of Chl a values above a threshold, we might be predicting “blooming” too early, because pre-blooms do arise occasionally (Townsend et al., 1994). Such a pre-bloom may be disrupted by abrupt changes in the density structure of the water column attributable to, for instance, strong winds, and the continuous onset of the bloom may be delayed. However, although not shown here, all years and stations were checked for persistence. Only the two southernmost bins (60–62 and 62–64°N) showed signs of pre-blooms of variable duration (1–4 weeks) in both bins in 1999 and 2007, in just the bin covering 62–64°N in 2001 and 2006, and in just the bin covering 62–64°N in 2003 and 2004. The criterion for determining the OSB in Henson et al. (2009) was that the median level needed to be sustained for at least 3 d. This extra criterion was omitted here because we evaluated 8-d averages. However, as reported in Stenevik et al. (2007), C. finmarchicus egg production seems to start immediately after a bloom is initiated and, although egg production may transiently level out until the continuous bloom begins to take effect, these eggs may prove to provide sufficient food for first-feeding larvae.
Clouds are more frequent early in the season and reduce the remote sensing data coverage. Gaps in the SeaWiFS data attributable to clouds may lead to erroneous estimates of OSB. This is an issue more obvious at high than at low latitudes, and it is also the reason why we chose to work with 8-d composites. In fact, at the time where the mean bin Chl a values exceeded the threshold, the mean percentages of SeaWiFS cells not cloud-covered were 6.8, 19.8, 47.1, 53.8, and 38.9, respectively, for bins from south to north.
The timing of larval surveys varies between years (Stenevik et al., in press), as does the hatching time of NSS herring larvae (Husebø et al., 2009). If the survey is conducted too early relative to hatching, the estimated mean hatching date will be too early. If the time between hatching and the survey is too long, however, larvae hatched early might have reduced catchability in the survey because of their large size, resulting in the estimated mean hatching date being too late. This would contribute to uncertainty in estimating the date of 50% hatching.
Acknowledgements
This study was supported by the Norwegian Research Council projects Eggval (204031/E40) and Pribase (191698/S40). SeaWiFS data were provided by GSFC/NASA in accordance with the SeaWiFS Research Data Use Terms and Conditions Agreement. The authors would like to thank the editors and reviewers for comments that helped to improve the paper.
References
Author notes
Handling editor: Audrey Geffen


