-
PDF
- Split View
-
Views
-
Cite
Cite
J. M. González-Irusta, A. Punzón, A. Serrano, Environmental and fisheries effects on Gracilechinus acutus (Echinodermata: Echinoidea) distribution: is it a suitable bioindicator of trawling disturbance?, ICES Journal of Marine Science, Volume 69, Issue 8, September 2012, Pages 1457–1465, https://doi.org/10.1093/icesjms/fss102
Close - Share Icon Share
Abstract
Habitat preferences of Gracilechinus acutus in the southern Bay of Biscay were studied using data from autumn bottom-trawl surveys. Wet weight and number of specimens of G. acutus were obtained and related to environmental variables (depth, sediment type, and organic matter percentage) at each haul and to trawl fishing effort. With this information and the otter trawl effort data, the environmental requirements and the impact of the trawl fishery on G. acutus populations were analysed. Although the species was present in all depth strata and all sediment types studied, it had clear habitat preferences, as greater abundances and mean weight values were found at depths ranging from 71 to 200 m and in bottom sediments dominated by coarse and medium sands. The effect of disturbance by trawling on this echinoid was significant and clearly negative. Seabeds exposed to higher trawling disturbance showed lower values of urchin abundance and smaller urchins than areas with lower disturbance. Results of the present study confirm the initial hypothesis of the suitability of using this urchin as a bioindicator of trawling impact but only in areas with appropriate environmental conditions, highlighting the importance of attaining a wider knowledge on the essential habitat of the species.González-Irusta, J. M., Punzón, A., and Serrano, A. 2012. Environmental and fisheries effects on Gracilechinus acutus (Echinodermata: Echinoidea) distribution: is it a suitable bioindicator of trawling disturbance? – ICES Journal of Marine Science, 69: .
Introduction
Trawling is one of the main sources of anthropogenic disturbance in benthic habitats (Jennings and Kaiser, 1998; Bergman and Van Santbrik, 2000; Kaiser et al., 2002). Trawling gear affects not only the targeted species, but also the whole ecosystem (Kaiser and Spencer, 1994; Collie et al., 2000; Jennings et al., 2001), being one of the most damaging fishing activities (Kaiser et al., 2002). The development of indicator species can be a useful tool for assessing ecosystem impact for fisheries management (Rice, 2003). Long-lived and/or fragile species have been identified as useful indicators of fishing disturbance (ICES, 2005) and the sea urchin G. acutus (Lamarck, 1816) fulfils both requirements. This species presents a slow growth and can take 20 years to reach its maximum size (Gage et al., 1986). Furthermore, urchins are very sensitive to trawling effects, suffering mortalities of 10–50% in the area swept by trawls (Lindeboom and de Groot, 1998) and density reductions of up to 68% in trawled areas (Collie et al., 2000).
Recent studies carried out on anti-trawling artificial reefs in the southern Bay of Biscay showed the great sensitivity of G. acutus to trawling disturbance (Serrano et al., 2010). Furthermore, Hughes et al. (2010) observed a density decrease in this urchin after drilling disturbance. However, to evaluate the suitability of this species as an ecological indicator, a wide understanding of the interactions between environmental and anthropogenic factors is necessary, allowing the identification and separation of possible sources of variation. Gracilechinus acutus is the most frequent echinoid species found on the trawling grounds of the Cantabrian Sea (Serrano et al., 2006). Despite this, there are no previous studies on the biology and distribution of the species in the southern Bay of Biscay, and studies focused on G. acutus in other areas are scarce (Bonsdorff and Vahl, 1982; Gage et al., 1986; Tyler and Young, 1998; Hughes et al., 2010).
The north coast of the Iberian peninsula constitutes an adequate area to test ecological indicators, since this area is subject to strong fishing pressure (Sánchez and Olaso, 2004) and has been subject to different management measures (Punzón, 2009) which allow the identification of a gradient of fishing intensity, environmental gradients being also very sharp in the area (Serrano et al., 2006; Punzón et al., 2010). The main objective of this work was to test the suitability of G. acutus size and abundance as ecological indicators of trawling disturbance. In this way, it was necessary to disentangle environmental and anthropogenic sources of variability. First, habitat preferences in the Cantabrian Sea of this poorly known echinoid species were determined. Then, spatial distribution patterns were related to trawl fishing effort. In the light of the results, the applicability of these indicators along environmental gradients is discussed and their differential suitability between types of habitats is established.
Material and methods
Survey data
The Instituto Español de Oceanografía (IEO) has been carrying out bottom-trawl surveys every autumn (September–October) since 1983. However, to include fisheries-related information, in this study, only data from the last 8 years (2002–2009) have been used. These surveys are based on random stratified sampling (by depth and geographic strata) and consist of 30 min hauls which are towed at a speed of 3.0 knots, using the otter trawl Baca 44/60 gear (Sánchez et al., 1995). In these surveys, five depth strata (<70, 70–120, 120–200, 200–500 and >500 m) were defined. The number of hauls per stratum was proportional to the surface area that was available for trawling. The mean number of hauls per year was 130. In each haul, all species caught were identified, counted, and weighed.
Sediment was characterized using a sediment collector consisting of a stainless steel cylinder (30 × 14 cm) with one end closed that was attached to the gear's groundrope. Particle size analysis of sediments was performed by a combination of dry sieving and sedimentation techniques (Buchanan, 1984). Sediment characteristics included median particle diameter (Q50), sorting coefficient (S0), weight percentage of coarse sands (CS > 500 μm), of medium sands (250 µm < MS ≤ 500 µm), fine sands (125 µm < FS ≤ 250 µm), very fine sands (62 µm < VFS ≤ 125 μm), and silt (Si < 62 μm), and weight percentage of organic matter. Organic matter content (OM %) in the sediment was estimated as weight loss of dried (100°C, 24 h) samples after combustion (500°C, 24 h).
Fishing effort
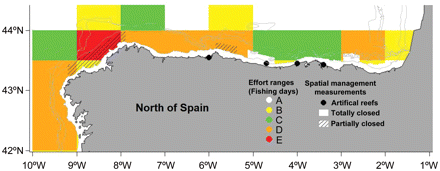
The fishing effort was measured considering two variables: fishing effort data and spatial management measures (Figure 1). Spanish fisheries policy establishes measures for the conservation and management of fishery resources in the Cantabrian Sea. Some of these measures involve the establishment of spatial and temporal closures to trawling, mainly to improve hake recruitment in nursery areas. Moreover, bottom-trawl gear operation is also not allowed on grounds shallower than 100 m depth. To prevent illegal trawling operations, four anti-trawling artificial reefs (concrete blocks) have been placed by fisheries authorities in grounds <100 m in depth: Cudillero (<70 m, FS), Llanes (71–120 m, CS), Calderón (71–120 m, FS), and Santoña (<70 m, VFS).
Fishery effort in the study area. Fishery effort data were calculated using two variables: spatial management measures (artificial reefs and closed areas) and fishery effort data (derived from official logbooks). The effort ranges are detailed in the text.
Each haul used in this study was related to fishing effort data (otter trawl and pair trawl). Hauls carried out on permanently closed areas or on areas with artificial reefs were considered as hauls with no trawling disturbance and were included in the analysis as effort level A (0 fishing days). For the remaining hauls (including hauls on temporarily banned areas), the effort level was obtained for the ICES statistics rectangle (1° longitude × 0.5° latitude) in which they were included. Effort data were derived from official logbooks, provided by the Spanish Fishery Department (SGMAR). The fishing pressure was divided into five effort levels (Figure 1): no trawling effort (level A, 0 fishing days, only applied on hauls conducted in areas with spatial management measures); low trawling effort (level B, >0 to ≤3590 fishing days); medium trawling effort (level C, >3590 to ≤9851 fishing days); high trawling effort (level D, >9851 to ≤21 584 fishing days); and very high trawling effort (level E, >21 584 fishing days). To define these five effort levels, the “kmean” algorithm from the “classInt” R package was used (Bivand et al., 2009).
Data analysis
Data analysis was divided into two different stages. First, we focused on determining the habitat requirements of the sea urchin G. acutus. To identify the environmental variables governing the spatial distribution patterns of this urchin (abundance and mean weight), a generalized linear model (GLM) was established (McCullagh and Nelder, 1989). A Poisson distribution of the residuals was assumed, and the most suitable link function for this distribution was the “log” function (McCullagh and Nelder, 1989). A stepwise regression procedure was used to determine the set of systematic factors and interactions that significantly explained the observed variability in each model, together with a chi-squared test to evaluate the statistical significance of an additional factor. The initial models were fitted in both cases (abundance and mean weight) using the variables: year, sediment type, and depth strata (discrete variables) and organic matter content (continuous variable). The final formula was: Since we did not include the possible effects of trawling on the G. acutus distribution during this first stage of data analysis, the analytical approximation (introducing in the GLM only environmental variables) was partly limited. However, the absence of fishery variables simplified the analysis and provided a more clarifying view of the G. acutus habitat requirements. The use of GLM allowed an interpretation of the coefficients of each variable's level in the final model as if they were relative values, using the first variable level as a reference value (Venables and Ripley, 1999). Moreover, the variance effect produced by other variables was eliminated.
Abundance: year + depth strata + sediment type + organic matter content, family = Poisson (link = “log”).
Mean weight: year + depth strata, family = Poisson (link = “log”).
In the second stage of data analysis, the fisheries variables were included. When all variables were analysed together, the resulting data matrix was extremely complex, unbalanced, and contained missing values. Commonly used statistical modelling techniques, such as GLMs, often fail to find meaningful ecological patterns from such data. For this reason, this second analysis was performed using classification and regression tree (CART) analysis (Breiman et al., 1984) which is ideally suited for complex data matrices (Breiman et al., 1984; Ripley, 1996; De'Ath and Fabricius, 2000).
CART generates decision trees to display class memberships by recursively partitioning a heterogeneous dataset into subsets (also called classes, groups, and nodes) by a series of binary splits (Pesch et al., 2008). The variable “year” was not included in the CART analysis because a partitioning of data in different years was not desirable. This statistical technique was adapted to account for no additive behaviour and therefore the interactions between variables were automatically included (Breiman et al., 1984; Pesch et al., 2008). Therefore, the aim was to create subsets that improve in terms of homogeneity according to the features of the target variable. How each node was split into two subnodes was determined using the predictor variables.
From all possible predictor variables, the CART selected the one that maximized the homogeneity of the two resulting groups and the optimal model was chosen based on the tree yielding the minimum cross-validated error rate. Before the CART analyses, differences in G. acutus abundance and mean weight between areas under different trawling pressure were identified using the Mann–Whitney U-test. The main aim of these analyses was to offer graphical evidence of the importance that each fishery variable could have in G. acutus abundance and mean weight. Subsequently, this evidence was quantitatively assessed for all the variables together (fisheries and environmental variables) using the results of the CART multivariate analyses. All statistical analyses were performed using the R statistical language (R Development Core Team, 2007): the effort class intervals definition using the R package “classInt” (Bivand et al., 2009); the GLM were performed using the R package “car” (Fox and Weisberg, 2010); and the multivariate regression trees were fitted using the R packages “mvpart” (De'Ath, 2007) and “rpart” (Therneau and Atkinson, 2010).
Results
Habitat preferences
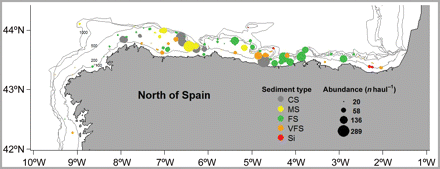
The relationship between abundance and mean weight and the various environmental variables was tested using GLMs. The results of the final model for abundance and mean weight are shown in Table 1. The models explain 33.5% (abundance) and 26% (mean weight) of the total variation. Although this species appeared at all depth strata and bottom types, our results indicated that G. acutus showed habitat preferences (Figure 2).
Summary of results from the GLM to assess significant differences in G. acutus abundance and mean individual weight obtained from 2002 to 2009 between the different depth strata, sediment types, and organic matter concentrations.
| . | d.f. . | Deviance . | Resid. d.f. . | Resid. Dev. . | p(>Chi) . |
|---|---|---|---|---|---|
| Abundance | |||||
| NULL | 981 | 29 591.92 | |||
| Year | 7 | 907.93 | 974 | 28 683.99 | <0.01 |
| Depth strata | 4 | 4 100.92 | 970 | 24 583.07 | <0.01 |
| Substratum type | 4 | 9 388.79 | 966 | 15 194.28 | <0.01 |
| O.M. percentage | 1 | 89.67 | 965 | 15 104.62 | <0.01 |
| Mean weight | |||||
| NULL | 262 | 183.73 | |||
| Year | 7 | 4.327 | 255 | 179.41 | 0.16 |
| Depth strata | 4 | 33.876 | 251 | 145.53 | <0.01 |
Mean abundance by haul of G. acutus in the study area. Each point represents a haul. Point size is proportional to the mean abundance in the haul during the study period, and colour represents the type of sediment present at each hauling site. Depth is also indicated. The sediment type codes are: CS, coarse sands; MS, medium sands; FS, fine sands; VFS, very fine sands; and Si, silt.
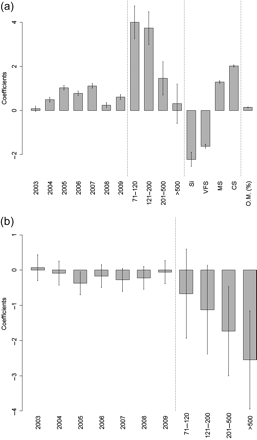
Sediment type was the main factor controlling the abundance of the urchin, explained the highest amount of the variability (Table 1). Gracilechinus acutus showed significantly higher relative abundances in CS and MS; in contrast its relative abundance was lower in Si and VFS (Figure 3a).
(a) Comparison of the positive value coefficients for the GLM model of abundance with a reference value (horizontal axis). The level used as reference was: 2002 for year, <70 m for depth stratum, FS for sediment and the slope for organic matter percentage. R2 = 0.335. Bars represent the s.d. values. (b) Comparison of the positive value coefficients for the GLM of the mean weight with a reference value (horizontal axis). The level used as reference was: 2002 for year and <70 m for depth stratum. R2 = 0.26. Bars represent the s.d. values.
A significant effect of depth in the abundance (p < 0.01, Table 1) of this urchin was also observed. Gracilechinus acutus showed the highest relative abundances at depths ranging from 71 to 200 m (Figure 3a). Outside these ranges, its abundance decreased, lower relative values being found shallower than 70 m. Finally, although the importance of organic matter in the model was low, there was a significant and positive relationship between G. acutus abundance and percentage of OM (p < 0.01, Table 1). Gracilechinus acutus abundance also showed significant fluctuations throughout the period studied. However, these variations did not show a clear trend, rather they showed an increase in abundance during the first years (2002–2007), followed by a period of decline in 2008 and 2009.
On the other hand, the mean weight of G. acutus only showed a significant relationship with depth strata (p < 0.01, Table 1). The relative mean weight of urchins captured at deeper levels was lower than that of urchins captured at shallower strata, with an inversely proportional relationship between size and depth (Figure 3b). The remaining variables (organic material content, sediment type, and year) did not show a significant effect in the urchins’ mean weight. Despite this, “year” was kept in the model to eliminate the influence of any possible temporal variation.
Effect of fishing effort and spatial management measures
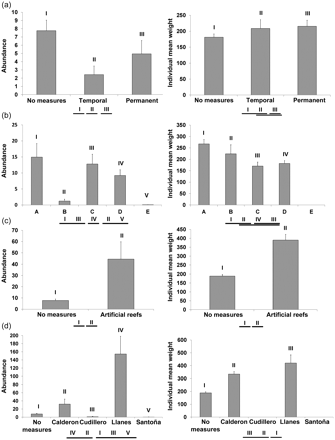
The abundance and mean weight of G. acutus showed a decrease in areas with higher fishing effort levels, with the lowest values in areas exposed to maximum trawling pressure. However, the relationship was not clear always and areas with effort level B showed lesser abundances than areas exposed to higher fishery pressures (Figure 4b). The small number of urchins collected in areas exposed to effort level E (only 8 urchins in 134 hauls) did not allow representation of the mean individual weight for these areas. Conversely, the positive effect of spatial management measures on the urchin G. acutus was clear in the artificial reef areas (Figure 4c) but not in areas subject to temporary or spatial banning/closure (Figure 4a). Closed areas showed significantly lower mean abundance values than areas without management measures. In contrast, urchins inhabiting these protected areas showed larger sizes than urchins from non-protected ones, which were significant for permanently closed areas. The presence of artificial reefs showed a significant and positive effect in G. acutus abundance and mean individual weight when all reefs were analysed together (Figure 4c). However, when the effect of the reefs was analysed individually (i.e. for each separate reef independently), results differed between reefs (Figure 4d). The Llanes reef showed the highest values of abundance and mean weight, which differed significantly from those obtained in areas without reefs. The Calderon reef also showed significant differences with non-reef areas although with lower values in both variables. The Santoña and Cudillero reefs, on the other hand, did not show significant differences with non-protected areas.
Mean abundance (number of urchins per haul, left figures) and individual mean weight (in grammes, right figures) of G. acutus at: different spatial measures (a), different trawling effort levels (b), presence–absence of artificial reefs (c), and different artificial reefs (d). Error Bars represent the s.d. values. Roman numerals refer to the mean values. Groups of underlined Roman numerals indicate non-significant differences between pairs of means according to a Mann–Whitney U-test, after applying Bonferroni' correction.
Decision trees
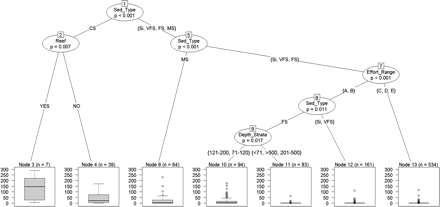
The relationship between variables and G. acutus abundance is shown in Figure 5. Sediment type, artificial reef, effort, and depth showed to significantly affect G. acutus abundance, whereas banned areas and organic matter percentage did not. The model explains 33% of the total variation (temporal variation was not included in the model).
Regression tree analysis of G. acutus abundance. Box plots are shown for each of the seven leaves (terminal nodes). p-value and inclusion order are labeled in each node. n, number of hauls.
The first predictor variable (the variable explaining the highest amount of variance) was sediment type, which explained a 23% of the initial total variance (Figure 5). This variable was included in the tree three times (nodes 1, 5, and 8). CS (nodes 3 and 4) and MS (node 6) showed the greatest abundance of G. acutus and they were separated from the other sediment types. The next predictor variable was “artificial reefs” (node 2). Hauls conducted on CS bottoms were separated by the presence/absence of artificial reefs. Effort range (node 7) was the third predictor variable. The abundance of G. acutus in Si, VFS, and FS was affected by the highest effort levels (C, D, and E), which were separated from the remaining effort levels (A and B). Finally, depth was included in the model (node 9), separating the 71–120 and 121–200 strata (depth with the greatest abundances) from the other depths.
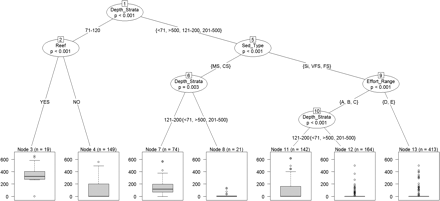
The relationship between G. acutus mean weight and the fisheries and environmental variables was also tested (Figure 6). The model explains 23% of the total variation. Following the same pattern, sediment type, artificial reefs, effort level, and depth showed a significant effect in urchin mean weight. However, these variables were inserted in the tree in a different order, showing differences in their relative importance as to mean weight variation. In this case, depth, instead of sediment type, was the first predictor variable and it explained an 11% of the initial total variance (node 1). The 71–120-m stratum was inhabited by larger urchins than the remaining strata (nodes 3 and 4), and hence separated from the rest. In the next steps, artificial reef (node 2) and sediment type (node 5) were included in the model as predictor variables. In the 71–120-m stratum, data were divided into two subgroups (nodes 3 and 4) based on the presence of reefs. In the “other-depths” group, sediment type was the second variable to be included. As with abundance, medium and CS were separated from the other sediment types. In hauls operated on CS and MS, depth was the next predictor variable included (node 6). In these types of sediments, urchins showed greater sizes in the 121–200 stratum (node 7) than in the other strata (<70, 201–500, >500, node 8). Finally, hauls carried out on Si, VFS, and FS were classified using the effort level as a predictor variable (node 9). Effort levels A, B, and C were separated of the higher effort levels (D and E, node 13).
Regression tree analysis of G. acutus mean individual weight. Box plots are shown for each of the seven leaves (terminal nodes). p-value and inclusion order is labeled in each node. n, number of hauls.
Discussion
The sea urchin G. acutus showed a wide distribution in the southern Bay of Biscay. Although this species appeared at all depths and sediment types, it showed clear habitat preferences, with special affinities for depths ranging between 70 and 200 m and CS and MS, and being absent from the shallowest stratum (<70 m) and from silt grounds (Figures 3a and 5). There are very few studies on the spatial distribution patterns of this echinoid and its habitat preferences are poorly known. However, in one of the few studies concerning this species (Cranmer, 1985), lesser abundances of G. acutus in silt grounds and in shallow depths of the North Sea were also observed. The combination of depth and sediment type is a key factor structuring epibenthic communities of the north coast of Spain (Serrano et al., 2006, 2008) and G. acutus does not seem to be an exception.
For epibenthic urchins, food availability is the most important factor linking spatial distribution patterns with sediment type (Cranmer, 1985; Jacob et al., 2003). Although there are no specific studies on the diet of G. acutus, Mortensen (1927) described the food of this urchin as “various kinds of bottom organisms”. Hartnoll (1983) stated that epibenthic organisms were more abundant in gravel sand bottoms, and Serrano et al. (2006) also found higher epibenthic biomass in this type of bottoms in the Cantabrian Sea. Therefore, it seems that this type of sediment provides a higher availability of food resources, explaining the greater abundance of the urchin in these substrata. Furthermore, the weak significant effect of the amount of organic matter in G. acutus abundance can also be explained by its predatory behaviour and for its affinity for CS bottoms, which are typically poor in OM (%). Although deposit-feeders are extremely influenced by organic matter content, its importance for benthic feeders is much lower (Wieking and Kröncke, 2003).
Depth was a key factor in the spatial distribution of G. acutus. In trawlable grounds of the Cantabrian Sea, urchins showed a clear bathymetric segregation (author’s unpublished data), which has also been observed in echinoids inhabiting depths between 2000 and 4000 m in the Bay of Biscay (David and Sibuet, 1985). In the study area, G. acutus was the most abundant between 70 and 500 m, but outside this bathymetrical range the biomass of G. acutus was scarce and other urchin species dominated in abundances. The occurrence in the Cantabrian Sea grounds of other shallower (Sphaerechinus granularis and Echinus esculentus) and deeper (Phormosoma placenta, Cidaris cidaris, and Araesoma fenestratum) regular urchins in the bathymetrical distribution limits of G. acutus suggests that the distribution of this species could be limited by competition with other echinoids. The role of depth in niche separation has been observed by other authors, mainly in shallow water species (Santos and Flammang, 2007; Tuya et al., 2007) but also in the continental shelf (Jacob et al., 2003).
The larval stage plays an important role in the establishment and maintenance of these bathymetric ranges (Young et al., 1997). However, the scarcity of G. acutus in shallower (<71 m) and deeper (>500 m) strata was not related to larval limitations since dispersal stages of the urchin showed a temperature and pressure tolerance much wider than that of adults (Tyler and Young, 1998). Predation did not seem to be a key factor in the spatial distribution patterns of this urchin either, given its limited relevance in Cantabrian trophic webs due to its low ecotrophic efficiency (Serrano et al., 2003; Sánchez and Olaso, 2004). Hence, it seems that competitive interactions could be one of the main causes explaining the bathymetrical distribution of G. acutus, but more detailed studies (with an experimental approach) are necessary to ascertain this. Depth was also an important factor controlling the mean individual weight of G. acutus, lower weights being found in deeper strata (Figures 3b and 6). Differences in the size of G. acutus between populations of different depths have also been observed by other authors who even suggested that G. acutus populations of different depths may be experiencing a speciation process (Tyler and Young, 1998).
In the Cantabrian Sea, trawling disturbance causes a significant and negative effect in the populations of G. acutus (Figures 5 and 6). Trawling disturbance as measured by closed areas (Figure 4a), effort levels (Figure 4b), and artificial reefs (Figure 4c and d) showed a significant impact in urchin mean individual weight. Moreover, reefs and effort level also had a significant effect on the abundance of this urchin. However, three important exceptions were observed: (i) the abundance of G. acutus in areas exposed to effort level B was lower than in areas exposed to higher effort levels; (ii) some of the artificial reefs showed a very less abundance of urchins; and (iii) the effect of closed areas on G. acutus abundance was negative, mean abundance values inside these areas being significantly lower than outside, even when considering permanently closed areas.
The contradictory lower values of abundance and mean individual weight found in areas exposed to effort level B when compared with other more heavily exploited ones were related to environmental differences between areas. In fact, when environmental and fisheries-related variables were analysed with the decision trees (Figures 5 and 6), effort levels A and B showed significant greater abundances and mean individual weight than other levels but only in areas dominated by Si, VFS, and FS. The same interaction between environmental and fisheries-related variables was observed in the artificial reefs and also they were apparent in the decision trees.
Abundance was significantly higher only in reefs placed in coarse sediment grounds, whereas the mean individual weight was significantly higher only at those reefs placed between 71 and 120 m. The presence of artificial reefs protected epibenthic communities from the trawling disturbance (Serrano et al., 2010). In addition to this direct effect, the inclusion of artificial reefs in the ecosystem had several others beneficial effects on epibenthic communities (Bombace, 1989; Serrano et al., 2010). However, all these beneficial effects are irrelevant if the reef is located in a site which does not fulfil the urchin's habitat requirements. In the study area, artificial reefs were placed on bottoms dominated by three of the five sediments types under study: CS (Llanes), FS (Calderón and Cudillero) and VFS (Santoña). The effect of artificial reefs on G. acutus was significant in Llanes as regards abundance and mean individual weight, but no significant influence was found at the VFS site (Santoña), while contradictory results were obtained in Calderon and Cudillero (Figure 4d). It should be highlighted that the two reefs which did not show a significant effect on abundance (Santoña and Cudillero) were placed at depths shallower than 71 m, which correspond to depths with the lowest abundance of G. acutus. In contrast, Calderon and Llanes showed mean depths of 85 and 95 m, respectively, which represent its preferred depth range (Figure 3). Therefore, the beneficial effect of the artificial reefs was only significant for G. acutus when the reef was placed within it's preferred sediment and depth.
Finally, the absence of a significant and positive effect of the temporarily closed areas on the mean individual weight of G. acutus was an expected result. Temporarily closed areas in the north coast of Spain are closed to trawlers between 4 and 6 months per year (Punzón, 2009), whereas G. acutus needs 20 years to reach its maximum size (Gage et al., 1986). Furthermore, during the remainder of the year, the trawling fleet focuses its effort on these areas, reducing the effect of the banning measure on the epibenthic communities (Demestre et al., 2008). However, permanently closed areas did not show a positive effect on the abundance of this urchin either. The main objective of the temporarily and permanently closed areas established in the northern Spanish coast was to improve the hake recruitment in nursery areas (Rodríguez-Cabello et al., 2008; Punzón, 2009). These nursery areas are associated with specific hydrographic mesoscales in areas characterized predominantly by muddy bottoms (Sanchez and Gil, 2000) and this is precisely the type of substrata avoided by G. acutus. Therefore, the lesser abundance values observed in permanently closed areas are probably related to unsuitable environmental factors rather than trawling disturbance. In fact, although the number of urchins inhabiting these areas was low (as with all other muddy bottoms), its mean individual weight was significantly higher than outside of those areas, indicating a positive effect of permanently closed areas on local urchin populations.
In conclusion, G. acutus mean size and abundance in the southern Bay of Biscay were determined by a combination of environmental and fisheries-related variables. The abundance and the mean individual weight of this urchin were the highest in areas that were not exposed to trawling disturbance, at depths ranging from 71 to 120 m, and on bottoms dominated by MS and CS (e.g. reef areas of Calderon and Llanes). In contrast, both variables (abundance and mean individual weight) had the lowest values in areas exposed to high trawling disturbance (D and E) on bottoms dominated by Si, VFS, and FS. The results of this work prove the great sensitivity of G. acutus to trawling disturbance and confirm previous data on this urchins' vulnerability and the suitability of using long-lived and fragile species as ecological indicators. On the other hand, this study also highlights the importance of acquiring a wider understanding of the interactions between anthropogenic and environmental factors when developing ecological indicators. Only a wide knowledge about the habitat requirements of relevant species will allow the identification of the effects of both these sources of influence. In this sense, we have shown the suitability of regression trees as a statistical tool, since they allow separating the effects of the different variables under analysis and the identification of their relative importance. The sea urchin G. acutus is a suitable bioindicator of trawling disturbance, although only in areas where environmental factors are adequate for the species.
Acknowledgements
This study was made possible thanks to the invaluable work of all the participants in the Cantabrian bottom-trawl surveys and the crew of the RV “Cornide de Saavedra”. We are grateful to doctors Izaskun Preciado and Luis López Abellan for their critical revision and useful suggestions which greatly improved this manuscript, to the benthos team of A Coruña Oceanographic centre for their help with the sediment samples, and to the “Ministerio de Medio Ambiente y Medio Rural y Marino” (MARM) for providing the logbook datasets. The work reported was developed in the context of the national research project ERDEM, funded by the Instituto Español de Oceanografia.
References
Author notes
Handling editor: Bill Turrell


