


Abstract
Although substantial progress has been made in the acquisition and analysis of fishery data, the small-scale fishery (SSF) sector is frequently data deficient, with relevant primary data often being fragmented and incomplete. Also, in contrast to the case of the larger scale sector, a coherent methodological framework for the assessment of the SSF has, in most cases, not been formulated. In the present study, the methodology of developing a database for the German Baltic SSF sector is presented. The aim of the database is to combine fishery primary data effectively and enable the sound determination and characterization of the German Baltic SSF sector. Data used include, among others, fleet data derived from the European Community Fleet Register (CFR) database and logbook data from the German Federal Office for Agriculture and Food (BLE). The database includes information on the technical specifications of SSF vessels (length, engine power, etc.); the sector's operational range; main target species; fishing grounds; landing ports; and weight and price of landings. Results of employing the database for profiling the state of the SSF sector (in 2008) are presented. The results demonstrate the benefits of such an approach within the framework of managing coastal fish resources and fishing activities.Papaioannou, E. A., Vafeidis, A. T., Quaas, M. F., and Schmidt, J. O. 2012. The development and use of a spatial database for the determination and characterization of the state of the German Baltic small-scale fishery sector. – ICES Journal of Marine Science, 69: .
Introduction
Small-scale fisheries (SSFs) are associated with practices that favour the use of less energy-intensive, primarily static, fishing gear and are considered potentially more sustainable than large-scale fisheries (Jacquet and Pauly, 2008). SSFs are also of great social significance, employing the largest number of fishing workers (FAO, 2009) and accounting for most of the world's fishing operations. In the future, the SSF sector is expected to play a central role in resolving the global fishery crisis; Hall et al. (2010) consider the support of its continued operation and development, and the increase in its adaptive capacity, as cornerstones in the process of sustainable fisheries. However, SSFs have been systematically ignored and marginalized through government policies in both developing and developed countries (Berkes, 2003; Ünal and Franquesa, 2010). Although there now exists a rising consensus on the need to promote the interests of the sector, as manifested by the increased attention of international and regional institutions (for instance, within the framework of the ongoing reform of the EU Common Fisheries Policy), the sector has yet to overcome decades of a non-favourable management regime. The absence of a clear definition; its high degree of heterogeneity (Freire and García-Allut, 2000; Tzanatos et al., 2008; Forcada et al., 2010); and its exclusion from national policy and the benefits that the larger scale sector may have (Madau et al., 2009) all account for the SSF sector being frequently neglected and not adequately assessed and analysed.
An important limitation in the definition, assessment, and analysis of the state of the SSF sector is that primary data are frequently absent, fragmented, and/or incomplete. Besides the general limitations inherent in fishery primary data that pose difficulties in the sound assessment of the state of fisheries (e.g. source fragmentation/variability, various levels of stratification, etc.), the SSF sector's fundamental characteristics (i.e. a large number of vessels, heterogeneity, and lack of clear definition) further hinder the acquisition of reliable and meaningful data. Moreover, while in the medium and large-scale sectors substantial progress is being made in data collection [e.g. the use of vessel monitoring systems (VMS) in the EU] and in the development of elaborate programmes for fishery data analysis (for reviews, see Plagányi, 2007; FAO, 2012), the same does not hold true for the SSF sector, which remains data deficient and lacks a coherent methodological approach for data analysis.
Past attempts to assess the SSF sector include the work of Zeller et al. (2007) for certain US flag-associated island areas in the western Pacific, and Dunn et al. (2010) for coastal fisheries in the wider Caribbean; SSFs were of central consideration in the assessment of Colombian marine fisheries by Wielgus et al. (2010) and within the work of Zeller et al. (2011a) concerning the reconstruction of Arctic Sea fishery catches. These studies formulated methodological frameworks for the analysis of a diversity of data sources (e.g. landings/catch time-series data, literature review, and expert consultation) that eventually enabled the evaluation of the state of the SSF sector. A recent study by the European Parliament (2011) analysed and assessed the structure and economic performance of SSFs in Europe, by primarily assessing data contained within the EU Community Fleet Register (CFR) and EUROSTAT. However, most past studies of the sector primarily involve local applications that focus on a particular segment; for instance, many of these studies review the impact of the designation of marine protected areas on the area's SSF (e.g. Madau et al., 2009; Forcada et al., 2010). In the absence of complete primary data sources, past research has made use of different methods to acquire data for a certain part of the SSF, such as conducting questionnaire/interview surveys (Otero et al., 2005; Forcada et al., 2010; Strehlow, 2010), visual observations (Gonzalvo et al., 2011), and on-board sampling (Forcada et al., 2010). Larger analyses (Katsanevakis et al., 2010) include the assessment of logbook data, coupled with survey data. These examples demonstrate the variety of methodological approaches that exist for assessing the SSF sector, especially in the absence of primary data. Each of these approaches discloses valuable information on different aspects of the SSF, and the adoption of a particular method relies, among others, on the defined objectives of research, the nature and extent of available data, and the spatial extent of the study area. It should be noted, however, that such approaches are helpful when assessing local segments of the SSF, but may be difficult to implement, from a logistical perspective, when the entire fleet is considered.
German Baltic small-scale fishery
In the Baltic Sea, coastal fish communities have long been recognized as important components of the natural ecosystem (HELCOM, 2006a, b), while SSFs that target the resource account for the majority of fishing vessels in the area (IFREMER, 2007). [According to EU legislation, small-scale coastal fishing is defined as fishing carried on by vessels of an overall length of <12 m, not using towed gear; Council Regulation (EC) No 2792/1999 and table 2 of Annex I in EU Commission Regulation (EC) 2090/1998; Council Regulation (EC) 1198/2006.]
The Baltic region is one of the few areas with a coherent legislation for the technical measures of fishing practices [Council Regulation (EC) No. 2187/2005; EUROPARL, 2007] and the limits of total catch and fishing effort for certain species of commercial importance [e.g. Council Regulation (EC) No. 1124/2010, for the year 2011], also governing the activity of the SSF sector.
The coastal fishery in the German Baltic region has long been considered an integral element of the broader area, having historically shaped regional economies (the Baltic herring fishery was a cornerstone of the Hanseatic League trade alliance), providing employment opportunities and being a tourist attraction (Döring, 2003). Also, the fishery exploits the coastal fish resource in a moderate way, while relevant fishing practices usually include the use of static, comparatively selective gear, resulting in small amounts of non-target fish species bycatch (Döring, 2003). Furthermore, as opposed to the case of the offshore fishing sector, non-target caught fish species are frequently returned by fishers to the sea alive (Döring, 2003).
There has been marked progress in the Baltic area in the acquisition, collation, analysis, and dissemination of fishery data. Catch statistics for the Baltic area are contained within the EUROSTAT/ICES database (2011), while other elaborate databases of fishery statistics have also been developed and are publically available, such as the HELCOM Map Service and GIS Data (2010); web-based data applications such as FISHFRAME (ver 5.0, 2008); or the German ‘Fish Stocks’ Online web-portal (Institute of Baltic Sea Fisheries, 2010). Furthermore, past studies (Rossing et al., 2010; Zeller et al., 2011b) have also accounted for unreported removals and discards, and the contribution of the recreational fishery to the area's total fishery removal, thus also addressing fundamental gaps in official fishery data. Outcomes of these studies present an improved dataset of catch time-series, and results are freely available to the public (see Sea Around Us Project, 1999).
However, the state of the German Baltic SSF has not been extensively evaluated. The 2010 Annual Economic Report of the European Union fishing fleet (European Commission, JRC, 2010) provides an overview of the German fleet. Within this overview, information relating specifically to the Baltic Sea is presented, including insights and quantitative information on the SSF (European Commission, 2010). The ICES Baltic Fisheries Assessment Working Group has partly assessed the state of the German Baltic SSF (ICES, 2009), providing data on the total number and average technical specifications of vessels per gear-type category (length, tonnage capacity, and engine power). Other projects have reviewed the catch weights from the recreational fishery (see Institute of Baltic Sea Fisheries, 2012). Overall, however, there have been relatively few case studies conducted to assess the Baltic SSF in general and the German Baltic SSF sector in particular (e.g. Lappalainen et al., 2002; Delaney, 2007; IFREMER, 2007), and relevant data are restricted to the extent of each specific application (e.g. a certain geographic region, segment of the fleet, or particular métier).
Moreover, available datasets lack information that is important for the assessment of the SSF sector. For example, HELCOM's database, which contains the most thorough and complete information on fisheries for the area, does not currently include information on the number of landing operations and the weight of landings per harbour, which could enable the extrapolation of additional indicators of fishing activity (e.g. distance from fishing grounds to landing harbours). Also, the harbours that are present in the relevant database include major ports and commercial harbours but are lacking information on secondary fishing harbours, which appear in the EU CFR (European Commission, 2004, 2006) and are important for the SSF sector. Furthermore, HELCOM data are stratified per ICES Rectangle and are in aggregate form for all Baltic countries; however, the catch composition among different countries and different segments/length classes of the fleet remains unknown.
The primary aim of our research was the development of a database for the German Baltic SSF sector that would enable the detailed identification and analysis of the state of the sector. The database aims at making primary data consistent, thus enabling the assessment of various attributes relevant to the German Baltic SSF sector and the assessment of data reliability. [Data reliability has been a central consideration for past projects in the Baltic that is also of relevance to fishing (e.g. the EMPAS project, ICES, 2008; Pedersen et al., 2009), and demonstrates the need to know the ‘confidence limits’ of fishery data (i.e. the degree of trusting the data).] The database is integrated within a geographic information system (GIS) where data are related to features such as fishing harbours and fishing areas. The database includes information on several of the sector's attributes (e.g. fishing harbours, number of vessels, landings, fishing grounds, and target species), thus enabling its detailed evaluation. Our study provides an overview of the state of the sector during 2008, which is the year that has the most up-to-date, complete available data.
Description of the study area
The German Baltic has a coastline of ∼2350 km and includes the coastline of the states of Mecklenburg-Western Pomerania (MV) and Schleswig-Holstein (SH). Within the area, there exists a multitude of commercial ports, secondary fishing harbours, and shelters that extend along the whole length of the coastline. This situation results in the establishment of local markets for fish of commercial importance, especially in rural areas. Our study area encompasses the geographic area that corresponds to the operational range of the German Baltic SSF. This extends along the German Exclusive Economic Zone and is within Baltic Area Subdivisions 22 (‘Belt Sea’) and 24 (‘Arkona Sea’) of the Baltic Proper (Figure 1).
Map of the German Baltic coastal region, Grey circles depict fishing harbours (database developed by our research); ICES Area 22: Belt Sea and 24: Arkona Sea (shapefiles after ICES, 2010; DIFRES, 2006); (EEZ poly-line after HELCOM Map and Data service, 2010).
The German Baltic marine coastal area is home to numerous coastal fish species and includes spawning areas of major commercial fish species (cod and herring). The important ecological features of the area's marine coastal environment have resulted in the establishment of an extensive network of areas of special conservation status, such as NATURA 2000 network areas, Ramsar sites, and the designation of fishery closures, all within the extent of the coastal band. Major bays in the area include, from west to east, the bays of Kiel, Mecklenburg, and Pomerania.
Data description
We acquired, assessed, edited, and analysed available primary fishery data, which included information on ports and harbours of the study area, fleet register data for Germany (European Community Fleet Register, 2010), and German logbook data (BLE, 2010).
German Baltic fishing harbour data
The dataset for the area's fishing harbours was compiled by combining existing datasets for ports and harbours and updating these according to additional information present within the other datasets (logbooks and fleet register; see Methods). Primary sources were the HELCOM map and data service (2010) and data from the Pennsylvania State University libraries (2009). Relevant data include information on the name of each port, its position (x, y coordinates), and its administrative area (see Supplementary material, Table S1).
Fleet register data
Information regarding the SSF fleet was derived from the European Community Fleet Register (2010). The CFR (see Supplementary material, Table S2) is the official record of technical details, characteristics, and activities of all Community fishing vessels based on the national registers of the EC Member States since 1991 and includes information on boat length, engine power, tonnage, homeport, and permitted fishing gear (Gonzalvo et al., 2011).
Logbook data
Logbook data used in this study (BLE, 2010; see Supplementary material, Table S3) were in the form of annual datasets of relevant quantitative and qualitative fishery data that included, among others, information on the date and time of the landing operation, the target species (e.g. cod), the weight of landings (kg), the price of landings (€), the fishing area from where landings originated (ICES Rectangle), and the landing harbour. [According to European Council Regulation (EC) No. 1224/2009 and Commission implementing Regulation (EU) No. 404/2011 vessels smaller than 12 m LoA are not required to possess a VMS so as to present the exact coordinates of the fishing grounds, and can report fishing areas in terms of ICES Rectangle(s).]
Logbook data were in the form of spreadsheets that corresponded to two length classes of vessels, namely vessels smaller and vessels larger than 10 m (LoA) respectively. It should be noted that according to the current legislative framework, the length class category <10 m LoA is not obliged to provide logbook-related information, but German logbooks, unlike the case with other European counties, do include valuable information for this segment.
Methods
Database development
The development of the database for the German Baltic SSF sector consisted of a series of analytical steps, which resulted in the integration of all data described above and in the determination of the state of the sector. First, an extensive dataset of primary and secondary German Baltic fishing harbours was compiled. Second, the CFR was assessed, to develop the dataset of the German Baltic SSF fleet. The third step involved the use of the logbook datasets to acquire information on the relevant indices included therein. The subsequent integration of the database within GIS (Environmental Systems Research Institute, 2008) enabled the visualization and analysis of the relevant attributes. The relationships between the modules making up the database are presented in Figure 2.
![Entity-relationship (ER) diagram of the German Baltic SSF database. Diagram developed within Toad Data Modeller Ver.4.1 software [2011 Quest (c), Freeware version]. The common attributes of the various comprising datasets (e.g. port name, ICES Rectangle, etc.) were used to join together all relevant datasets.](https://oup.silverchair-cdn.com/oup/backfile/Content_public/Journal/icesjms/69/8/10.1093_icesjms_fss096/1/m_fss09602.gif?Expires=1716396934&Signature=Je~40dirS-Am31uZPMDqiNSX-S-cGemWftpJMQmB9Wyw3KpXr5EHWcMHOYlbzOR0blEC1GfES60t39TRM4a4QZDOufDCc4QQAvWXCZ6-OeWg2Ihu72b43-oiGDV~sWXS1jzrdD-gw4jOqmsCnvKzJ37Z1Ndiznf5feiSf8S~DcKZCgCBU9Ch6qbbuzn-KcYj4f92KsT2wb4tXitAXwldXincChRoEHwHxW4ivIcuEcxwNrzcGBIj6Zp-7Cmak8ixGwK2oUbSgWOaXd83vjPRqjWMlcWp2aE0M2A-PX7i187f96BQVvMH3GrPUHxD0QPpyGOjrDSlVYNFwlfmZM38ZA__&Key-Pair-Id=APKAIE5G5CRDK6RD3PGA)
Entity-relationship (ER) diagram of the German Baltic SSF database. Diagram developed within Toad Data Modeller Ver.4.1 software [2011 Quest (c), Freeware version]. The common attributes of the various comprising datasets (e.g. port name, ICES Rectangle, etc.) were used to join together all relevant datasets.
Total number of registered SSF vessels in German Baltic harbours. Primary data source: European Community Fleet Register (2010); (‘Active at date: 31 December 2008’); vessel specifications are as presented in the Methods section.
German Baltic fishing harbours
We assessed existing datasets of coastal populated areas (e.g. Pennsylvania State University Libraries, 2009; HELCOM Map Services, 2010) that typically coincide with major ports and commercial harbours. A total of 130 additional harbours—from information contained within the fleet register and logbook datasets—were added to the initial dataset. We also considered ports/harbours situated within inland waters (e.g. bays, river estuaries, etc.) and at a distance <12 nm from the sea, which is typically considered as the maximum range of operation of SSFs. The German Baltic fishing harbours are shown in Figure 1.
Landing harbours located outside the study area (e.g. German North Sea and Denmark) and their corresponding information were excluded from the analysis. From the comparison of the logbook data with the respective initial harbour data, it was found that there are harbours in the latter that derived from the fleet register dataset and are not included as landing harbours in the logbooks, which implies that some of the ports of registration of SSF vessels are not used as landing harbours.
The resulting fishing harbours dataset has been compared and validated against alternative data sources (e.g. Pennsylvania State University Libraries, 2009; HELCOM, 2010; World Port Source, 2010), and comprises an improved dataset of operational fishing harbours along the German Baltic coastline.
Fleet register data—determination of SSF
To determine the German SSF fleet, data for the year 2008 were retrieved from the European Community Fleet Register (2010) and analysed. Data were specified as ‘active at date’ for 31 December 2008, so as to cover the entire year.
Although SSF vessels are officially defined as vessels <12 m not using towed gear, the SSF sector is heterogeneous. It includes vessels with various technical specifications that practise different fishing strategies. Thus, we initially categorized vessels according to the combination of their primary and secondary gear and established the various different gear-type combination categories present in the dataset. In order to account for seasonal shifts between primary and secondary gear, both gear types were considered and all possible combinations of the two gears were determined. This was done in order to estimate the exact number of static-geared vessels that can be operational at any given time and their technical characteristics. Three major gear combination categories were identified, namely the ‘static’ category (both primary and secondary gears static), the ‘mixed’ category (one gear static and one gear active), and the ‘active’ category (both primary and secondary gears ‘active’).
The second step was to determine the SSF sector based on the length (LoA), engine power (kW), and carrying capacity (GT) for each of the different gear-type categories. Four criteria were set as threshold limits for the definition of the SSF. All these criteria had to be met for a vessel to qualify as ‘small-scale’. It must be noted that the values of the above threshold limits were intentionally selected to be high, in order for SSF vessels of the ‘mixed’ category not to be excluded from the analysis while ensuring that they truly qualify as SSFs.
The length of the vessel (LoA) should be <12 m (according to the legislative and institutional framework).
The carrying capacity of the vessel should be <20 GT (to correspond to the average GT of the EU SSF fleet for the particular length class; after López Benítez, 2010).
The engine power should be <100 kW [to correspond to the average kW of the EU SSF fleet; after ICES (2009); according to which the engine power of the German coastal cod fleet ≤100 HP is ∼74 kW] (López Benítez, 2010).
It should possess at least one static gear.
We then focused on the ‘static gear’ category and assessed all respective segments where both gears are static, to determine the small-scale fleet (see Supplementary material Table S4 for relevant gear combinations). This assessment also provides a first-order estimate of the degree of heterogeneity of fishing practices of the German Baltic SSF sector. All vessels with relevant gear combinations were then integrated into the dataset. Vessels with secondary gear ‘unknown’ were assessed individually and allocated into an active/static category based on the combination of other technical attributes.
Logbook data
Logbook data were fundamental in the development of the present database, as the type of information they include (landings, target species, fishing area, etc.) could not be retrieved from alternative data sources (such as VMS data or the HELCOM database). Logbook information was not available at the level of individual vessels (in the manner of the fleet register data), but only in aggregate form (‘fishing operation vs. time vs. day vs. landing harbour vs. species vs. fishing area caught’). Also, data do not include information on the duration of each fishing operation, and information on the type and amount of gear deployed (e.g. m2 of nets, number of hooks and lines, etc.).
In this study, logbook data on weight of landings (kg) have been aggregated per annum to enable linking of relevant information to the respective fleet register dataset that also has an annual level of aggregation. This level of analysis takes into account potential shifts between primary and secondary gears in the area, including gears used on a part-time basis. We assessed each segment of the SSF sector, as these appear in the logbook datasets (<10 m and 10–12 m). Active gear vessels were omitted. All data that corresponded to the <10 m LoA category (generic gear type ‘static nets’) were found to belong to the SSF sector (carrying capacity <20 GT, static gear, length <12 m) and were included in the dataset.
The assessment of the logbook data of the category 10–12 m LoA initially involved the analysis of non-gillnet fishing strategies. The SSF fleet from those records was defined based on the gear type and fishing strategies (non-gillnets, >10 m LoA) practised in the area during the year 2008 (see Supplementary material, Table S5). For the SSF segment of 10–12 m LoA it should be noted that since data are aggregated annually, the representation of all small-scale fishing strategies is possible, as the use of secondary static gears does not overlap with that of primary active gears. Therefore, in the final results, the (part-time) activity of SSF vessels with secondary gear ‘static’ is also included, provided those vessels follow the specifications set during the analysis of the fleet register data.
The exact weight of landings and the extent of the operation of the ‘gillnets 10–12 m length’ segment of the SSF could not be determined precisely. The length of the vessels is not explicitly stated in the logbook data, while it was demonstrated from the assessment of the CFR that several gillnet vessels have specifications that do not qualify them as small scale (namely LoA > 12 m, GT > 20, engine power > 100 kW). To account for these limitations, we excluded the landings deriving from fishing areas (ICES Rectangle) located at a distance from the respective landing harbour, much greater than the range that corresponds to SSFs. [This distance was set at 100 km, and is a general estimate of the range of operation of the German SSF sector, in line with the specifications of the institutional framework for the area's SSF (ICES, 2009), and also includes the instances of SSF operating within inland/sheltered waters.] Thus, landings that pertain to fishing harbours located at a distance > 100 km from the ICES Rectangle of origin were omitted from the database. This also included landings originating from the Danish and Swedish coastal bands, at a distance >100 km from their respective German landing harbours, and landings taking place in the ports of other countries located at a distance >100 km from the respective fishing area of origin. This procedure partly corrects the data, with the weight of landings excluded most probably accounting for the larger scale (>12 m LoA) segment of the gillnets’ fishing strategy. As such, the present analysis significantly refines the primary data, and provides a good estimate of the ‘gillnets 10–12 m length’ segment. However, in contrast to the rest of the analysis, the weight of landings that corresponds to the gillnets 10–12 m length segment should only be considered as an approximation.
Data limitations
The inherent limitations in primary fishery data may limit our definition of the SSF sector, as also demonstrated by previous research (e.g. ICES, 2008; Madau et al., 2009; Pedersen et al., 2009; Forcada et al., 2010; Gonzalvo et al., 2011; Wielgus et al., 2010). Although the CFR could provide a good overview of the SSF sector, insight is restricted by the fact that vessels of the CFR may not operate during the entire year and/or may not use the same gear type throughout. This restriction does not enable the estimation of the exact number of SSF fishers active in the area. This is further complicated by the fact that in the German Baltic area, many of the registered vessels that qualify as small scale do not actually operate as such, but are in reality ‘helping-hand’ vessels for the offshore fishery sector (Institute of Baltic Sea Fisheries, pers. comm.). This discrepancy between the number of vessels of the CFR and the actual number of active operational vessels has been reported to occur in other countries, and has also been observed during surveys in Germany.
Another drawback in the use of CFR data is that a given vessel's corresponding fishing harbour of registration is not necessarily the harbour from where the vessel began its fishing operation. This aspect may have implications for the assessment of the spatial distribution of the sector, its range of operation, and therefore estimates of fishing intensity. Furthermore, after assessing the logbook data, it was discovered that the CFR was not exhaustive in terms of the fishing gears active in the area. For instance, some fishing gears associated with SSF (e.g. poundnets) were absent from the CFR dataset but present in the logbook dataset; this is most probably due to strategies that do not involve the use of vessels for gear deployment, an example that clearly demonstrates the aforementioned fragmentation of fishery data. Importantly, as has also been suggested in the past, it was found that determining the SSF sector using the gear type as the sole criterion was not always sufficient, as it did not account for other factors (GT, engine power, and travel distance to fishing grounds).
The quality of the logbook data is limited as fishers in the area may misreport catches/landings (Institute of Baltic Sea Fisheries, pers. com.) or fishing grounds (ICES Rectangles). This misreporting may be either accidental, i.e. unfamiliarity with the Rectangle codification scheme, or deliberate, i.e. to reduce taxation and avoid strict regulations (e.g. an area's quota system, designated areas, seasonal closures), as has been shown to be the case in other areas (Bearzi et al., 2008; Gonzalvo et al., 2011). This can hinder the estimation of the exact number of records that pertain to the SSF. Although the exact degree of misreporting cannot be estimated, the present analysis partly corrects for this, by excluding North Sea harbours and unrealistic records. Another drawback associated with the use of logbook data is that they include information on landings and, in the absence of data on ‘Illegal, Unregulated and Unreported’ (IUU) catches and discard data (Rossing et al., 2010; Wielgus et al., 2010; Zeller et al., 2011a, b), they cannot be used to reconstruct catch estimates. However, the German Baltic SSF is relatively selective and is usually associated with small amounts of fish discards (Döring, 2003).
Results
Results of the analysis enable the characterization of the state of the German Baltic SSF for the year 2008 and provide a detailed overview on: (i) the size of the fleet; (ii) the technical characteristics of vessels; (iii) the distribution of fishing ports; (iv) major target species; (v) the range of operation of the sector; (vi) the distribution of landings per fishing area (ICES Rectangle); and (vii) the weight and price of landings per harbour.
Structure of the German Baltic SSF fleet
The entire German Baltic fleet consists of a total of 1825 registered fishing vessels of diverse technical characteristics and gear combinations. The number of SSF vessels is 1349, thus the SSF accounts for the overwhelming majority of the fleet (74%). Most of the SSF vessels (1335 vessels, 99% of total SSF vessels) employ static primary and secondary gear [gear types present in the logbook dataset that were not included in fleet register were driftnets (GND), barriers, fences and weirs (FWR), and poundnets (FPN)] and a relatively small number of vessels (14 vessels, 1% of total SSF vessels) falls within the ‘mixed’ category having an ‘active’ secondary gear (see Supplementary material, Table S6). Thirteen distinct fishing strategies were determined which corresponded to the SSF sector (see Supplementary material, Table S7). The distribution of registered SSF vessels in the various different harbours along the German Baltic coastline is shown in Figure 3.
Spatial extent of the German Baltic SSF
The completed database includes a total of 133 fishing harbours. This number is significantly higher than the respective number of ports contained in other databases (e.g. World Port Source database, 2010; ∼20 ports). It should be noted that a particularly high density of landing harbours is located in the easternmost part of the study area, along the coastline of the state of MV. Furthermore, the assessment of the fishing grounds from which landings originated (ICES Rectangles) shows the operational range of the SSF sector for the year 2008 (Figure 4).
SSFs across German Baltic fishing grounds (ICES Rectangles) (year 2008): (a) Geographic extent of German SSF. (b) Weight of total SSF landings (t)/ICES Rectangle of origin. Values represent total landings per ICES Rectangle of segment ‘ < 10 m LoA’ (aggregated annually, for the total number of fishing operations and for the total number of target species). (c) Number of caught species (landings)/ICES Rectangle of segment ‘ < 10 m LoA’.
Target species
We assessed the species present in the area, the weight of landings per species, and their distribution in each ICES Rectangle. Fish species present in the area were expressed as target species comprising the landings, and a list of species was compiled. The distribution of the number of caught species per ICES Rectangle is shown in Figure 4.
A total of 39 different species of diverse origin, both marine and freshwater (fw), are present in the landings of the SSF <10 LoA for the year 2008. The seven species with total landings >100 t per annum, accounting for the vast majority of landings, are, in descending order, herring (Clupea harengus), cod (Gadus morhua), roach (fw; Rutilus rutilus), European flounder (Platichthys flesus), common bream (fw; Abramis brama), pike-perch (fw; Stizostedion lucioperca), and European perch (fw; Perca fluviatilis)—see Supplementary material, Figure S1.
Landings across German Baltic fishing grounds (ICES Rectangles)
For the year 2008, the total weight of landings from the SSF segment <10 m LoA amounted to ∼7380 t, the majority of which (4633 t, 63%) was accounted for by herring. The highest weight of landings per fishing area (ICES Rectangle) from the segment is situated in the vicinity of Greifswalder Bodden (ICES Rectangle 37G3, 4712 t, 64% of total landings for the segment) and is mostly accounted for by herring (4150 t, 88% of the area's landings; Figure 4). Landings here are significantly higher than elsewhere. The second highest weight also occurs in the immediate vicinity of Greifswald Bodden (ICES Rectangle 38G3, 731 t). High landings also occur in Lübecker Bay (ICES Rectangle 37G1, 515 t, 7% of total landings for the segment), and primarily consists of cod (277 t) and flounder (125 t). The total weight of landings from the SSF segment 10–12 m LoA, using gillnets, was estimated at ∼5920 t, of which the vast majority (4420 t, 75%) was accounted for by herring. Again, the highest weight of landings was from the fishing grounds of Greifswalder Bodden (ICES Rectangle 37G3, 4585 t, 77% of total landings for the segment). The total weight of landings from the SSF segment LoA = 10–12 m, using static gear other than gillnets, was estimated at ∼785 t (of which 593 t, or 75% of total weight for the segment, originated from ICES Rectangle 37G3).
Landings in German Baltic fishing harbours
The highest weights of landings per fishing harbour from the SSF segment <10 m LoA occur in the eastern part of the study area (MV: 69 landing harbours, 6551 t landings, 89% of total weight of landings; SH: 45 landing harbours, 813 t landings, 11% of total weight of landings; Figure 5). [As mentioned above, part of the landings originating from the area are also landed at ports located outside the study area; therefore, the total weight of landings per harbour does not add up to the respective total weight of landings per ICES Rectangle. Also, not all of the recorded fishing harbours of the database are used in the particular year for the landing of catch for the particular segment.] The same holds true for the segment ‘Non-gillnets, 10–12m LoA’, with landings per harbour again primarily located in the eastern part of the study area (MV: 25 landing harbours, 780 t, 99.4% total weight of landings; SH: 6 landing harbours, 4.7 t, 0.6% total weight of landings; Figure 5). The analysis was inconclusive about the exact weight of landings per harbour from the 10–12 m LoA ‘gillnet’ segment, for the reasons discussed above.
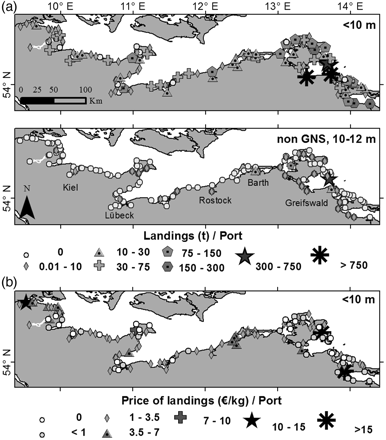
SSFs along German Baltic landing harbours (year 2008): (a) Distribution of total SSF landings (t)/landing harbour (segments ‘<10 m LoA’ and ‘static, non-gillnet, 10–12 m LoA’). (b) Price of landings (€/kg)/landing harbour (segment ‘ < 10 m LoA’).
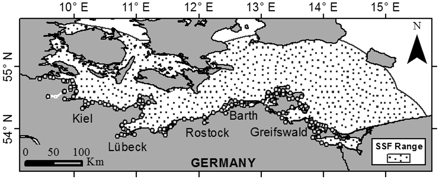
Mean range of operation of German Baltic SSFs, assuming a mean travel distance of 100 km from the fishing grounds to landing harbours.
Figure 5b depicts the average price of landings per landing harbour (€/kg) for the <10 m LoA segment. The average price of landings for different harbours is estimated at 2.23 €/kg for the eastern (MV) and 2.04 €/kg for the western (SH) part of the study area. High prices of landings also occur for individual landed species: for cod, the average price of landings is estimated at 1.94 €/kg for the eastern (MV) and 1.74 €/kg for the western (SH) part of the study area. The respective values for herring are 0.70 €/kg (MV) and 0.98 €/kg (SH). These figures indicate that the prices obtained by the SSF fleet are much higher than average fish prices obtained on aggregate by Baltic fisheries, which are ∼2.1 €/kg for the relatively valuable cod, but only ∼0.25 €/kg for herring (European Commission, 2010). In the major ports along the German coastline (Kiel, Rostock, and Lübeck), prices of landings are smaller (1.8, 1.83, and 1.7 €/kg, respectively) than the average per port for the broader areas, with secondary landing harbours having a higher price. The highest recorded prices of landings (i.e. >10 €/kg) occur at harbours located at the eastern [Usedom and Binz, with prices of landings of 18.5 and 48.3 €/kg, respectively (non-refined by the constituent species; by season; or by fishing area/ICES Rectangle of origin. The high prices obtained in Binz mostly account for landings of flounder P. flesus and correspond to few landing operation incidents] and western ends (Glücksburg, prices of landings 12.7 €/kg) of the study area.
Discussion
Structure of the German Baltic SSF
The results show that the German Baltic SSF (reference year 2008) accounts for the majority of the total number of German Baltic fishing vessels. The sector is heterogeneous, made up of vessels that target numerous (39) different species (freshwater and marine), exhibit diverse technical specifications, and involve the use of different fishing gears. The fishing gears of the sector are primarily gillnets, and to a lesser extent static longlines, and pots and traps. Other fishing strategies involve the use of poundnets and barriers, fences, and weirs. The results show that the use of such strategies does not span the whole range of the sector, but is confined within particular fishing areas with appropriate habitat characteristics (depth, presence and abundance of target species, etc.), as also demonstrated by local-scale assessments (Döring, 2003; Strehlow, 2007). It should also be mentioned that although the use of driftnets is banned in the region [Article 9, Council Regulation (EC) No. 2187/2005], the gear was present in the logbook database for the year.
The analysis showed that defining SSF vessels solely by the type of gear (static) is not adequate, as several vessels with both gears ‘static’ had GT and kW specifications and operational ranges that do not qualify them as SSFs. This finding was also supported by the results of the logbook data: cases of single landing incidents from vessels with static gear, derived from ICES Rectangles at a large distance from the landing port, were also found to have too large a weight of landings to qualify as small scale (carrying capacity > 20 GT).
We argue that the results of the fleet register analysis can be used as a proxy of fishing capacity; namely the thresholds in the technical characteristics and in particular the GT and kW could constitute a qualitative method for assessing the SSF sector's fishing capacity (as also defined in EEC 2930/86 and EC 2371/2002).
Spatial extent of the German Baltic SSF
The sector is based in a multitude of ports and shelters, along the whole extent of the German Baltic coast, as has also been shown to be the case with other countries (Forcada et al., 2010) with a more extensive coastline than Germany. From Figure 3 it appears that there is an increase in the number of small-scale vessels along the fishing harbours from west to east, but there does not seem to be any agglomeration of vessels in particular localities, which suggests that the sector is important for the entire German Baltic coastline. It should also be mentioned that for several ports with a large number of registered SSF vessels, no landing operations occur according to the logbook data. This may indicate the localities' historical significance for the SSF sector, namely that it continues being used as a port of registration of SSF vessels, although it may not possess favourable landing facilities.
From the present analysis it appears that the sector's range of operation is restricted to the German Baltic marine coastal strip. According to EU law, German fishing vessels have access to and can fish for certain species within the territorial waters of Sweden and Denmark. It was found, however, that landings that originate from fishing grounds (ICES Rectangles) within the territorial waters of Denmark and Sweden correspond to minor target species.
Landings across German Baltic fishing grounds (ICES Rectangles)
The high weight of landings from the SSF segment <10 m LoA originating from the fishing area situated in the vicinity of Greifswalder Bodden (ICES Rectangle 37G3), and mostly accounted for by herring, is due to the fact that the particular area is a spawning ground for the western herring Baltic stock (Döring, 2003; Strehlow, 2007). High weights of landings also originate from Lübecker Bay (ICES Rectangle 37G1), and are primarily made up of cod and flounder, partly due to the proximity to the cod's spawning grounds in the Belt Sea Area, and partly due to the absence of herring spawning grounds in the proximity. Also, the area is closer to major commercial hubs that enable the shipment of high-valued cod landings to the next steps of the distribution network.
Landings in German Baltic fishing harbours
For the <10 m LoA segment of the fleet, the highest concentrations of landings per harbour are found in the eastern part of the area. This is primarily due to the fact that most of the weight of landings is made up of herring and the majority of the species' catch originates from fishing grounds located in the area. Furthermore, the particular segment has a confined range of operation; the area hosts major fish-processing facilities and therefore high weights of landings are to be expected. It should be noted that the processing capacity of facilities is smaller than the total weight of landings of herring in the area's ports.
The landings per harbour of the segment ‘non-gillnets, 10–12 m LoA’ are confined to the eastern part of the study area, which is also related to the fact that the respective strategies target primarily species that are present in this part of the German Baltic coastal environment.
Many of the SSF vessels are active within inland waters and it is envisaged from the results of the logbook data (landings originating from ICES Rectangles) that the catches are subsequently landed in neighbouring ports in the fishing areas‘ immediate vicinity (i.e. overlapping of high landings/ICES Rectangle with landings/harbours in the immediate vicinity of the Rectangle). This observation indicates that the SSF stays within these waters and does not leave the immediate vicinity.
The relatively high prices of landings towards the edges of the study area, and in particular on the eastern side, dictate the sector's significance for those coastal communities, as an important income-generating activity, particularly in rural areas that are distant from the main industrial centres, including cities with major ports.
Target species
The analysis enabled the deduction of the target species' distribution of the SSC fishery within the area where the sector is operational. The target species' information and the area(s) from where the species' landings originate indicate that the extent of a species catch area (in terms of ICES Rectangle) is part of its broader distribution range. Many of the species will have a broader distribution range; however, the small weight caught by numerous SSF vessels suggests that even species with a very low abundance are caught by the particular sector in certain localities of the coastal band of Germany. The database also enabled the estimation of the total number of species present (species' richness) per fishing area (ICES Rectangle) which could constitute an index of the area's diversity.
Outlook
The merging and subsequent analysis of the data included within the database enabled us to overcome some of their inherent limitations and also allowed the calculation of new indices (e.g. fishing capacity of various segments/fishing strategies of the SSF). We are exploring the possibilities of further combining and integrating these data, to enable additional insights into the state of the German SSF fleet, such as: the estimation of the total landings contribution of each length class of the gillnets, based on their respective carrying capacity; the determination of the fishing effort of the fleet and its component segments, provided that additional information is acquired on the duration of fishing operation and the amount of deployed gear; and the estimation of the German Baltic SSF catch per unit of effort, i.e. landings per amount of gear for a particular gear type), in a similar manner to how catch per unit of effort is traditionally estimated in the area.
Although the results presented in this study are not exhaustive of all aspects that pertain to the SSF, the proposed methodology, if extended, could present a complete profile of the state of the sector: we have determined the sector's range of operation; the major fishing areas where the sector is active; the major fishing strategies performed and their fishing areas; and the fishing harbours of importance in terms of registered vessels and weight of landings. Further analysis would allow the investigation of spatial and temporal trends in the various indices that have been incorporated in the developed spatial database, which could have practical implications for the management of fish resources. Such an analysis would identify the spatial entities that exhibit significant changes and which should be given priority in the future, in the event of management regime changes (e.g. quota allocation, fishing closures, establishment of protected areas, or gear restrictions).
Our methodology can provide a quantitative estimate of the quota that corresponds to the SSF [the German framework for fish quota allocation follows the division of allocated quota per vessel (for fish species of relevance).] For example, initial results indicate that for the case of herring, the quota that pertains to the SSF for the year 2008 is < 10 000 t, when the total German total allowable catch for the species for the study area (ICES Areas 22 and 24) amounted to 24 579 t. Yet, the small-scale vessels made up the vast majority of the fleet, which could imply that the quota is not equitably allocated between the small-scale and large-scale sectors. This is contrary to the aspirations of the area for the equitable distribution of fishery resources between the open and coastal fishery (‘Baltic Agenda 21’, International Baltic Sea Fishery Commission, 1998).
Conclusions
The present analysis constitutes (to our knowledge) the first quantitative definition and characterization of the German SSF, and simultaneously the first known attempt to assess logbook data for the German Baltic SSF and construct a database tailored to the specifications of the sector. The absence of such data analysis has been highlighted by past studies and projects in the area (ICES, 2008; Pedersen et al., 2009; Žydelis et al., 2009), therefore our work addresses a major limitation in the evaluation of the interaction among the fishing industry and other users of the coastal zone. It also builds on the information available from other data sources and in particular the HELCOM database, where the data provided should be seen as supplementary, namely the distinction between the various segments of the fleet.
It is envisaged that further analysis of the available data, specifically the linkage of particular fishing grounds with their respective landing harbours, can refine these estimates, for example by determining the maximum travel distance of SSF vessels (e.g. Figure 6, range of operation of SSF assuming a 100 km mean travel distance).
In summary, we have made use of and effectively combined an extensive amount of fishery primary data and demonstrated the need to address spatial considerations (i.e. range of operation) when assessing the state of the sector. We believe that the findings of the present study will aid the assessment and evaluation of the German Baltic SSF in particular, but can also serve as an aid when assessing the state of SSFs in other regions. Although the analysis of the SSF sector was restricted to the German Baltic coast, the present methodology can be adapted and transferred to other regions and potentially be extended to cover the entire Baltic region.
Supplementary material
Supplementary material is available at the ICESJMS online version of the manuscript and consists of the following. Figure S1: total weight of landings (t) of SSF <10 m LoA of major species (2008). Table S1: fishing harbours dataset (extract). Table S2: fleet register dataset example (extract). Table S3: logbook dataset example (extract). Table S4: fishing strategies and technical specifications of segments of the German Baltic SSF sector. Table S5: fishing strategies (logbook data) of the German Baltic SSF sector. Table S6: composition of the German Baltic fishing fleet. Table S7: fishing strategies/segments of the SSF sector.
Acknowledgements
Logbook data used in the analysis are courtesy of the German Federal Office for Agriculture and Food (BLE). This work was funded by the Cluster of Excellence 80 ‘The Future Ocean’. The 'Future Ocean' is funded within the framework of the Excellence Initiative by the Deutsche Forschungsgemeinschaft (DFG) on behalf of the German federal and state governments. We thank Ms Emma Khadun for comments on an earlier draft of the manuscript.
References
Author notes
Handling editor: Howard Browman
