-
PDF
- Split View
-
Views
-
Cite
Cite
Eneko Bachiller, Unai Cotano, Guillermo Boyra, Xabier Irigoien, Spatial distribution of the stomach weights of juvenile anchovy (Engraulis encrasicolus L.) in the Bay of Biscay, ICES Journal of Marine Science, Volume 70, Issue 2, March 2013, Pages 362–378, https://doi.org/10.1093/icesjms/fss176
Close - Share Icon Share
Abstract
Previous studies have shown that the survival of larval and juvenile anchovy off the continental shelf in the Bay of Biscay is not significantly different from that observed on the shelf, even though the food concentration is significantly higher on the shelf. In this paper we investigate the causes for the lack of relationship between food and survival for anchovy juvenile through analyses of feeding activity versus zooplankton distribution (in the transition from summer to fall from 2003 to 2010). The spatial distribution of the stomach weights of juvenile anchovy in relation to body size on and off the shelf revealed higher stomach fullness in areas off the shelf, where less zooplankton biomass was available. This result indicates that the food concentration is not always the main factor determining ingestion in fish. A situation of comparatively lesser prey abundance may provide better feeding conditions when combined with lower predation risk and lower light attenuation. In addition, the relatively heavier stomachs found in anchovies caught in years of higher recruitment indices suggest a large stomach content may be a symptom of good biological condition that may favour the winter survival of a larger fraction of the juvenile stock.Bachiller, E., Cotano, U., Boyra, G., and Irigoien, X. 2013. Spatial distribution of the stomach weights of juvenile anchovy (Engraulis encrasicolus L.) in the Bay of Biscay. – ICES Journal of Marine Science, 70: 362–378.
Introduction
There are various combinations of food availability and predatory risk that allow relatively good fish recruitment, depending on the nature of the feeding-to-risk relationship (Bakun and Broad, 2003; Irigoien et al., 2007). Recruitment of European anchovy (Engraulis encrasicolus) appears to be at least partially related to the wind regime and upwelling intensity (Borja et al., 1998), and although it is usually associated with high food concentration areas, such as upwellings and river plumes (Borja et al., 1996, 1998), the mechanisms involved remain unknown and the reasons for the low recruitments unclear (Irigoien et al., 2007). In the Bay of Biscay high productivity areas such as the shelfbreak and river plumes are the main anchovy spawning grounds (Motos, 1996; Motos et al., 1996; Allain et al., 2007). However, most larvae are advected off the shelf (Cotano et al., 2008) where they grow to the juvenile stage before actively swimming back to the shelf spawning areas (Irigoien et al., 2008; Aldanondo et al., 2010). The juveniles found off the shelf show normal growth patterns (Aldanondo et al., 2010). This seems to be in contradiction with the potential food limitation off the shelf, since the zooplankton concentration is about half that found on the shelf (Albaina and Irigoien, 2004, 2007; Irigoien et al., 2007, 2009).
It has been observed that adult anchovy individuals off the shelf ingest about twice as much than those found near the Gironde River plume where the plankton concentration is twice as high (Plounevez and Champalbert, 1999; 2000). Therefore, adults can apparently compensate for the lower food concentration off the shelf.
Several studies have contributed to our knowledge of the trophic ecology of anchovy adults (Bulgakova, 1993a, b, 1996; Tudela and Palomera, 1995, 1997; Plounevez and Champalbert, 1999, 2000; Van der Lingen et al., 2006; Bacha and Amara, 2009), but there are not many studies investigating this issue in anchovy juveniles, and none in the Bay of Biscay, despite the potential interest in understanding recruitment processes. This is understandable because detailed studies on stomach contents are extremely laborious, and therefore spatially and temporally limited.
The objective of this work was to analyse stomach fullness in relation to food availability and various environmental factors. We used a combined approach in this study in order to determine the stomach fullness distribution of juvenile anchovies in the Bay of Biscay on a large spatial scale. The stomach weight was used as a simple measure for studying spatio-temporal variability. In this sense, total zooplankton abundance and biomass spatial distribution analysis carried out in the whole fish sampling area was considered to be an approach to partially determining food availability. Finally, detailed stomach analyses were carried out on a reduced number of individuals to describe the juvenile diet on and off the shelf.
Material and methods
Data range definition
For the “area” definition in statistical analysis we considered 250 m depth to be the boundary defining the continental shelf (<250 m) and oceanic (>250 m) areas.
Four time ranges were defined according to the sampling time: 05:00–10:00 GMT (t1), 10:00–15:00 GMT (t2), 15:00–20:00 GMT (t3), and 20:00–05:00 GMT (t4).
Zooplankton was characterized by size, considering the minor diameter, i.e. the smallest axis of the ellipsis containing the individual (Fernandes et al., 2009). Three size ranges were defined: “small-sized” (S.PL: minor diameter < 1mm), “medium-sized” (M.PL: 1mm < minor diameter < 2mm), and “large-sized” (L.PL: minor diameter > 2mm).
Juvenile surveys
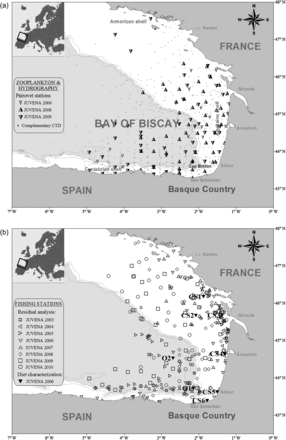
The JUVENA acoustic survey was designed to estimate the abundance of the anchovy juvenile population and their growth condition at the end of the summer in the Bay of Biscay (ICES, 2010a). For this study, anchovy juveniles were caught along the predefined transects (ICES, 2010a) during eight JUVENA cruises from 2003 to 2010 (Figure 1, Table 1). According to the fishing gear, purse seine and pelagic trawls, depending on the survey and the year, were used to catch fish (Table 1). However, preliminary data indicated that anchovies caught by pelagic trawlers had significantly lower stomach contents (i.e. stomach weight) than those caught by purse seiners at any time range (two way ANOVA; fishing gear: F = 446.92, d.f. = 1, p < 0.0001; time range: F = 83.74, d.f. = 3, p < 0.0001; fishing gear*time range interaction: F = 3.92, d.f. = 3, p < 0.01). This could be due to the longer and more stressful sampling methodology, which results in higher evacuation rates. Therefore, only purse seiner fishing data were considered in this study.
Study area. (a) Zooplankton sampling, with Pairovet stations of different JUVENA surveys (2006, 2008 and 2009). A CTD device was attached to the Pairovet net in all the sampling stations; complementary CTD profiles obtained in those years with no zooplankton data have been also indicated in the map. (b) Fishing stations used for the stomach weight-eviscerated weight residual analysis in different JUVENA surveys (2003–2010), as well as those from JUVENA 2006 in which the complete diet characterization was analysed: six stations on the continental shelf (CS1–CS6) and two off the shelf (O1–O2).
Description of JUVENA surveys from which data were obtained for the study.
| Year . | Period . | Vessel . | Fishing Gear . | Fishing stations (t1 / t2 / t3 / t4) . | nYoY.E.encrasicolus (t1 / t2 / t3 / t4) . | CTD profiles (t1 / t2 / t3 / t4) . | Pairovet stations (t1 / t2 / t3 / t4) . |
|---|---|---|---|---|---|---|---|
| 2003 | Sept. 17–Oct. 15 | F/V Divino Jesús de Praga (Donostia) | Purse Seiner | 0 / 8 / 8 / 3 | 0 / 751 / 618 / 312 | 0 / 8 / 7 / 3 | – |
| 2004 | Sept. 17–Oct. 20 | F/V Nuevo Erreñezubi (Bermeo) | Purse Seiner | 1 / 5 / 1 / 0 | 4 / 208 / 11 / 0 | – | – |
| 2005 | Sept. 12–Oct. 7 | F/V Gure Aita Joxe (Donostia) | Purse Seiner | 5 / 8 / 4 / 0 | 279 / 277 / 214 / 0 | 5 / 8 / 4 / 0 | – |
| Mater Bi (Getaria) | Purse Seiner | 7 / 7 / 7 / 0 | 254 / 187 / 338 / 0 | 4 / 4 / 5 / 0 | – | ||
| 2006 | Sept. 13–Oct. 15 | F/V Itsas Lagunak (Hondarribi) | Purse Seiner | 7 / 8 / 5 / 3 | 314 / 340 / 269 / 135 | 5 / 5 / 2 / 3 | 5 / 5 / 2 / 3 |
| F/V Emma Bardán (Vigo) | Pelagic Trawl | 7 / 11 / 7 / 4 | 306 / 527 / 468 / 227 | – | – | ||
| 2007 | Sept. 4–Sept. 30 | F/V Gure Aita Joxe (Donostia) | Purse Seiner | 4 / 3 / 5 / 1 | 99 / 74 / 92 / 51 | – | – |
| F/V Emma Bardán (Vigo) | Pelagic Trawl | 2 / 5 / 4 / 8 | 113 / 239 / 156 / 314 | 17 / 23 / 24 / 0 | – | ||
| 2008 | Aug. 26–Sept. 22 | F/V Itsas Lagunak (Hondarribi) | Purse Seiner | 2 / 1 / 2 / 1 | 7 / 69 / 127 / 1 | – | – |
| F/V Emma Bardán (Vigo) | Pelagic Trawl | 3 / 10 / 10 / 11 | 137 / 394 / 580 / 595 | 12 / 9 / 16 / 11 | 12 / 9 / 16 / 11 | ||
| 2009 | Aug. 26–Sept. 25 | F/V Itsas Lagunak (Hondarribi) | Purse Seiner | 3 / 4 / 1 / 4 | 168 / 206 / 68 / 126 | – | – |
| F/V Emma Bardán (Vigo) | Pelagic Trawl | – | – | 13 / 20 / 8 / 7 | 13 / 20 / 8 / 7 | ||
| 2010 | Sept. 1–Sept. 30 | F/V Itsas Lagunak (Hondarribi) | Purse Seiner | 8 / 7 / 4 / 3 | 204 / 434 / 481 / 55 | – | – |
| F/V Emma Bardán (Vigo) | Pelagic Trawl | – | – | 6 / 14 / 11 / 6 | – |
Number of fishing stations, young of the year anchovies caught in each survey, number of CTD profiles and the number of zooplankton samples caught with Pairovet nets are indicated. Number of stations and samples are indicated according to the time of sampling: t1 = 05:00–10:00 GMT, t2 = 10:00–15:00 GMT, t3 = 15:00–20:00 GMT, t4 = 20:00–05:00 GMT.
The recruitment is the biomass of anchovy at age 1 in January of the following year, estimated according to the ICES assessment using a Bayesian model with inputs from catches and biomass estimates of two spring surveys, an acoustic one (PELGAS), conducted by Ifremer, and a survey based on DEPM (BIOMAN), conducted by AZTI (ICES, 2011).
Environmental variables
Hydrographical features
Temperature and salinity vertical profiles were collected during the JUVENA sampling period from 2003 to 2010 with a CTD profiler (Figure 1, Table 1); 5 m depth was defined as the reference for sea surface salinity (SSS) and sea surface temperature (SST) records. Unfortunately the CTD vertical profiles were not obtained in all fishing stations (Table 1). On the other hand, in order to check if the light attenuation would affect the detection of prey by fish [e.g. Aksnes and Utne (1997) suggested that a lower light attenuation would indicate an easier prey detection] that could be reflected in the weight of stomachs, MODIS satellite imagery (oceancolor.gsfc.nasa.gov) was used to extract K490 light attenuation data (Aqua MODIS diffuse attenuation coefficient at 490 nm, level 3, 4 km).
Zooplankton
Zooplankton samples were collected in some of the fishing stations during three surveys: JUVENA 2006 (spatially limited sampling), JUVENA 2008 and JUVENA 2009 (Figure 1, Table 1). Vertical hauls of a 150 µm PAIROVET net (Smith et al., 1985) were carried out and net samples were preserved immediately after collection with 4% buffered formaldehyde until analysis in the laboratory (Harris et al., 2000).
The samples were stained (24 hours with 1 ml Eosin 5 g l−1) and then image analysis was used to obtain the mesozooplankton abundance and biomass (Bachiller et al., 2012). After the classifier had been optimized manually, a data-balancing procedure was used to establish training sets (Witten and Frank, 2005; Fernandes et al., 2009), which obtained 93% accuracy. Size was transformed into biomass with the equation proposed by Alcaraz et al. (2003). In 2006, three aliquots were processed for each of the JUVENA 2006 stations. “Abundance” was defined as the total number of zooplankton individuals per square metre, and “biomass” as µg of zooplankton per square metre.
Fish biological processing
The anchovy samples were sized to the nearest 1 mm and weighed to the nearest 0.1 g and then preserved frozen. Stomach extraction in the laboratory was only carried out for juvenile individuals, i.e. age 0 according to the standard age readings for European anchovy (ICES, 2010b).
Stomach content analysis
Fish stomachs were extracted in the laboratory, weighed to the nearest 0.01 g and then preserved in ph7 buffered formaldehyde (4%) for later examination.
Generalized linear models (GLMs) (McCullagh and Nelder, 1989) fitted to anchovy stomach wet weights (SW) were used in order to determine predictors significantly affecting the model (Nikolioudakis et al., 2011). The predictor variables of GLMs were initially the eviscerated weight of fish (EW), fishing gear, sampling time, area (see Data range definition for variable definition) and year. A log–log function was found to be adequate. Modelling was carried out using the R software (R Development Core Team, 2009). All predictors and their first and second order interactions were initially included in the model. The stepAIC function (R package “MASS”, v7.3-5; Venables and Ripley, 2002) was used to select the significant predictors and to estimate the coefficients of the models. Predictors were removed by backward elimination based on Akaike's information criterion (AIC). AIC balanced the degree of fit of a model with the number of variables, in order to find the most parsimonious model. Only those predictors which contributed significantly to the model were kept. Once the model with the lowest AIC value was selected, the deviance for each of the predictors was analysed. Since few hydrographical data were obtained at the same time as anchovy fishing, environmental factors were not considered predictors, but factors supporting the results obtained (see Discussion).
Accordingly, stomach fullness was analysed as the residuals of the fitted GLM. These residuals were tested against different hydrographical and biological variables, also plotting the running average (with a span of 35 m for depth) as a smoothing procedure to show the tendencies behind the intrinsic variability of the residuals. When comparing the residuals with the available zooplankton for fish, the zooplankton abundance variable was considered (individuals m−2). Residuals were analysed with box-and whisker plots for different time ranges, according to the area. In the same way, the interannual variability of residuals was analysed with box-and-whisker plots, and mean values were compared with the recruitment index, i.e. estimated biomass of age 1 anchovy for the next year.
On the other hand, 176 anchovies from eight additional stations of the JUVENA 2006 survey (CS1-6 on the shelf and O1-2 off the shelf, Figure 1) were examined for complete diet characterization (Hyslop, 1980). Twenty stomachs were analysed for each station. A stereomicroscope (model: NIKON SMZ 645) was used to extract stomach contents manually with tweezers and a scalpel. All identifiable prey were counted, and identified to the lowest possible taxonomic group when possible. We did not include the more highly digested and thus unidentifiable or uncountable prey.
Results
General environmental conditions
Temperature and salinity
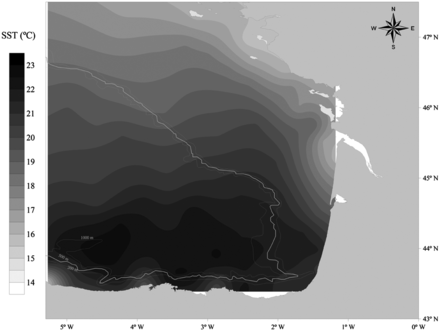
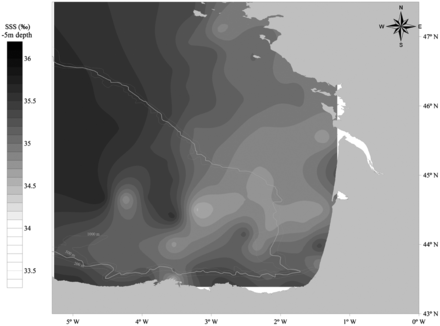
The average SST and SSS maps for the JUVENA 2009 cruise show the main hydrographic features of the Bay of Biscay in late summer: the temperature is higher in oceanic areas than on the continental shelf, and salinity is lower on the continental shelf, especially in areas under the influence of the main estuaries, than in the oceanic areas (Figures 2 and 3).
Average sea surface temperature (°C) for the JUVENA 2009 survey period (N = 84 CTD measurements).
Average salinity of seawater (psu) at 5 m depth (SSS) for the JUVENA 2009 survey period (n = 84 CTD measurements).
Light attenuation
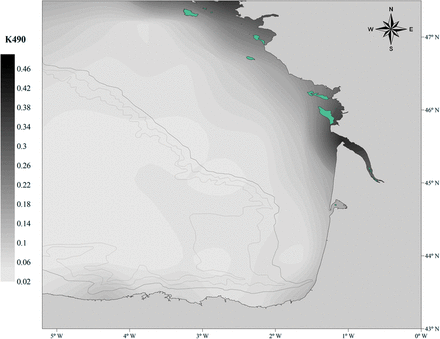
A high value for K490 indicates turbid waters (i.e. low light penetration), whereas low values would correspond to clear waters where the sunlight can penetrate to deeper areas (Sagarminaga, pers. comm.). There was a coast-ocean gradient in the light attenuation during the JUVENA sampling period, from 2003 to 2010 (Figure 4). The attenuation was significantly higher (two way ANOVA; year: F = 19.78, d.f. = 7, p < 0.0001; area: F = 409.57, d.f. = 1, p < 0.0001; year*area interaction: F = 3.25, d.f. = 1, p = 0.002) on the shelf. In addition, the influence of the main river plumes, such as that of the Gironde River, is also reflected in the light attenuation levels.
Average K490 attenuation (Aqua MODIS diffuse attenuation coefficient at 490 nm, level 3, 4 Km, MODIS-NASA) for the JUVENA survey period (2003–2010).
Zooplankton distribution
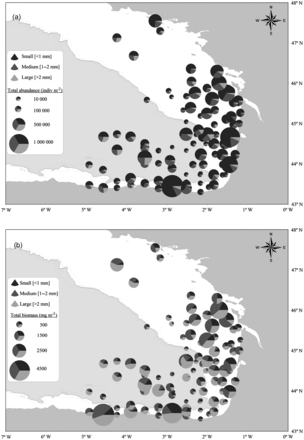
For the 2008 and 2009 JUVENA sampling periods, the total abundance (two way ANOVA; year: F = 36.68, d.f. = 1, p < 0.0001; area: F = 5.39, d.f. = 1, p = 0.02; year*area interaction: F = 1.71, d.f. = 1, p = 0.19) and biomass (two way ANOVA; year: F = 29.59, d.f. = 1, p < 0.0001; area: F = 3.92, d.f. = 1, p = 0.05; year*area interaction: F = 0.02, d.f. = 1, p = 0.88) of the zooplankton were significantly higher on the continental shelf than off the shelf. Although small zooplankton (<1 mm) was more abundant (Figure 5a), large (>2 mm) zooplankton made a larger contribution to the biomass (Figure 5b). The mean biomass of zooplankton observed on the continental shelf was about twice that off the shelf at all sampled size ranges.
Zooplankton average abundance (a) and biomass (b) distribution by size range (small-medium-large) for the JUVENA 2008 (NJUV'08= 53 stations) and 2009 (NJUV'09=54 stations) sampling periods.
Complete diet characterization of juvenile anchovy
The diet characterization of selected juveniles caught in JUVENA 2006 (Table 2) showed that copepods are the main prey for juveniles: Calanoids in general and the Cyclopoid Oncaea sp. were the most abundant prey groups for juveniles, followed by Cirripedia and Harpacticoids. Gastropoda veligers at station CS5 (see Diet Characterization stations in Figure 1b), and undefined fish eggs at station O2, were also notable. In these samples (i.e. additional stations caught in 2006 for the diet composition analysis, see Stomach content analysis), no significant differences were observed between the two areas for total zooplankton abundance and biomass (t test for abundance: statistic = 0.22, d.f. = 1, p = 0.63; t test for biomass: statistic = 0.37, d.f. = 1, p = 0.54). However, in terms of prey richness, on average about twice as many species were found in the stomachs of juveniles caught on the continental shelf (i.e. Figure 1b, CS1-6) than in those caught off the shelf (i.e. Figure 1b, O1 and O2), and therefore the stomach content species composition was significantly different (Chi squared test for prey abundance: Chi statistic = 6812, d.f. = 7, p < 0.0001; Chi squared test for prey biomass: Chi statistic = 23413, d.f. = 5, p < 0.0001).
Average number of prey items (individuals per stomach) and prey mass (µg per stomach) in juvenile anchovies caught in the JUVENA 2006 survey.
| . | CS1 . | CS2 . | CS3 . | CS4 . | ||||
|---|---|---|---|---|---|---|---|---|
| . | Indiv./stom. (±SD) . | µg/stom. (±SD) . | Indiv./stom. (±SD) . | µg/stom. (±SD) . | Indiv./stom. (±SD) . | µg/stom. (±SD) . | Indiv./stom. (±SD) . | µg/stom. (±SD) . |
| Gastropod veliger | 0.06 (±0.1) | 0.07 (±0.12) | – | – | – | – | – | – |
| Cladocera | 0.93 (±0.54) | 4.43 (±2.58) | 0.03 (±0.04) | 0.12 (±0.2) | 0.01 (±0.05) | 0.06 (±0.22) | 0.07 (±0.19) | 0.35 (±0.93) |
| Large Calanoids | 7.77 (±6.91) | 39.24 (±34.9) | 0.42 (±0.47) | 2.1 (±2.36) | 0.46 (±1.21) | 2.35 (±6.09) | 8.73 (±4.55) | 44.1 (±22.99) |
| Small Calanoids | 15.4 (±9.24) | 86.43 (±51.85) | 0.58 (±1) | 3.26 (±5.6) | 1.85 (±1.99) | 10.37 (±11.18) | 4.44 (±1.96) | 24.9 (±11.02) |
| Cyclopoid Oithona | 0.01 (±0.03) | 0.02 (±0.07) | – | – | – | – | – | – |
| Cyclopoid Oncaea | 2.25 (±1.8) | 2.28 (±1.83) | 0.01 (±0.02) | 0.01 (±0.02) | 0.38 (±0.48) | 0.39 (±0.49) | 0.85 (±0.63) | 0.86 (±0.64) |
| Cyclopoid Corycaeus | 0.39 (±0.35) | 1.77 (±1.6) | 0.01 (±0.03) | 0.05 (±0.12) | 0.01 (±0.06) | 0.06 (±0.29) | 0.42 (±0.44) | 1.93 (±2.02) |
| Harpaticoida Euterpina | 1.22 (±0.67) | 2.36 (±1.28) | 0.07 (±0.08) | 0.13 (±0.16) | 0.38 (±0.59) | 0.73 (±1.13) | 1.09 (±0.96) | 2.1 (±1.86) |
| Harpaticoida Microsetella | 0.74 (±0.57) | 1.95 (±1.5) | 0.36 (±0.29) | 0.94 (±0.77) | 0.08 (±0.14) | 0.21 (±0.37) | – | – |
| Cirripedia | 0.72 (±0.56) | 2.33 (±1.8) | 0.02 (±0.08) | 0.07 (±0.26) | 0.09 (±0.2) | 0.3 (±0.63) | 0.75 (±0.5) | 2.42 (±1.6) |
| Decapod larvae | 0.05 (±0.13) | 1.34 (±3.15) | – | – | 0.01 (±0.02) | 0.12 (±0.58) | 0.04 (±0.12) | 1.16 (±3.89) |
| Echinoidea larvae | – | – | – | – | 0.01 (±0.02) | – | – | – |
| Polychaete | 0.01 (±0.04) | 0.08 (±0.4) | – | – | – | – | – | – |
| Undefined fish egg | 0.41 (±0.45) | 0.42 (±0.46) | 0.1 (±0.13) | 0.1 (±0.13) | 0.07 (±0.14) | 0.07 (±0.14) | 0.24 (±0.37) | 0.24 (±0.38) |
| CS5 | CS6 | O1 | O2 | |||||
| Indiv./stom. (±SD) | µg/stom. (±SD) | Indiv./stom. (± SD) | µg/stom. (±SD) | Indiv./stom. (±SD) | µg/stom. (±SD) | Indiv./stom. (±SD) | µg/stom. (±SD) | |
| Gastropod veliger | 0.41 (±0.29) | 0.5 (±0.36) | 4.4 (±5.27) | 5.4 (±6.46) | – | – | – | – |
| Cladocera | 0.63 (±1.04) | 3 (±4.98) | 4.45 (±5.46) | 21.29 (±26.11) | – | – | – | – |
| Large Calanoids | 126.8 (±32.19) | 640.65 (±162.62) | 28.91 (±31.03) | 146.05 (±156.76) | 0.34 (±0.88) | 1.72 (±4.45) | 0.12 (±0.39) | 0.58 (±1.96) |
| Small Calanoids | 65.19 (±52.77) | 365.82 (±296.09) | 23.45 (±18.2) | 131.57 (±102.13) | 1.4 (±3.93) | 7.87 (±22.07) | 0.12 (±0.28) | 0.7 (±1.6) |
| Cyclopoid Oithona | 2.13 (±2.93) | 4.81 (±6.31) | 6.05 (±8.67) | 10.67 (±16.27) | – | – | – | – |
| Cyclopoid Oncaea | 99.16 (±56.13) | 100.67 (±56.98) | 118.57 (±77.34) | 120.37 (±78.52) | 0.95 (±3.4) | 0.97 (±3.45) | – | – |
| Cyclopoid Corycaeus | 3.83 (±2.95) | 17.53 (±13.51) | 2.79 (±1.81) | 12.77 (±8.3) | – | – | – | – |
| Harpaticoida Euterpina | 4.56 (±3.08) | 8.78 (±5.94) | 4.55 (±2.44) | 8.78 (±4.7) | 0.24 (±1.12) | 0.46 (±2.16) | 0.14 (±0.3) | 0.26 (±0.58) |
| Harpaticoida Microsetella | 5.55 (±4.55) | 14.55 (±11.92) | 1.98 (±1.2) | 5.18 (±3.14) | 0.19 (±0.63) | 0.51 (±1.65) | – | – |
| Cirripedia | 68.19 (±53.24) | 219.86 (±171.65) | 93 (±79.7) | 299.86 (±256.97) | – | – | – | – |
| Decapod larvae | 0.08 (±0.21) | 2.45 (±6.89) | 0.28 (±0.59) | 9.13 (±19.1) | – | – | 0.11 (±0.53) | – |
| Echinoidea larvae | – | – | 0.03 (±0.16) | – | 0.29 (±1.34) | – | – | – |
| Polychaete | 0.02 (±0.11) | 0.25 (±1.18) | – | – | – | – | – | – |
| Undefined fish egg | 1.1 (±1.11) | 1.13 (±1.14) | 0.48 (±0.74) | 0.5 (±0.76) | 4.14 (±6.24) | 4.26 (±6.41) | 5.23 (±11.3) | 5.37 (±11.61) |
Standard deviations are in brackets.
Stomach fullness distribution
Modelling stomach weight–eviscerated weight relationship
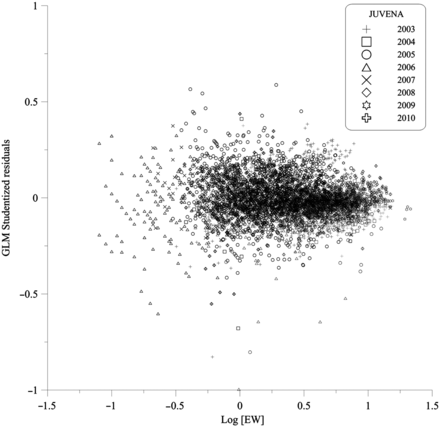
The most parsimonious GLMs for juvenile stomach wet weight explained 91.37% of the deviance (Table 3). The eviscerated weight was the predictor that explained the largest proportion of deviance (83%), but the area, as well as the sampling time and year, also showed significant effects, as suggested in previous results, although our results indicate that the deviance explained by those factors was relatively low (<8% of the total deviance). Significant interactions of area, time and year with EW were interpretable in terms of changing slopes of the SW–EW relationship between areas, surveys and time intervals. The residual plot is presented in Figure 6.
Plot of the residuals of the GLM (Table 3) fitted to the stomach weight (SW) of anchovy juveniles (JUVENA 2003–2010) against the eviscerated weight of fish (EW). Black and grey symbols correspond to the oceanic and continental shelf areas, respectively.
Analysis of deviance table for the log-log based generalized linear model fitted to juvenile anchovy stomach wet weight (SW).
| Source of variation . | d.f. . | Deviance . | Explained deviance (%) . | Residual d.f. . | Residual variance . | p-value . |
|---|---|---|---|---|---|---|
| Null | 6772 | 5272.50 | ||||
| Log EW | 1 | 4379.70 | 83.07 | 6771 | 892.70 | *** |
| Time | 3 | 23.00 | 0.44 | 6768 | 869.80 | *** |
| Area | 1 | 43.20 | 0.82 | 6767 | 826.60 | *** |
| Year | 7 | 310.50 | 5.89 | 6760 | 516.10 | *** |
| Log EW × Time | 3 | 5.40 | 0.10 | 6757 | 510.70 | *** |
| Log EW × Area | 1 | 0.30 | 0.01 | 6756 | 510.60 | *** |
| Log EW × Year | 7 | 13.40 | 0.25 | 6749 | 497.20 | *** |
| Time × Area | 3 | 2.10 | 0.04 | 6746 | 4951.00 | *** |
| Time × Year | 18 | 36.60 | 0.69 | 6728 | 458.40 | *** |
| Area × Year | 7 | 3.30 | 0.06 | 6721 | 455.10 | *** |
| Total | 91.37 |
d.f. = degrees of freedom, EW = eviscerated weight of fish, Time = sampling time, Area = predefined sampling area, Year = year of the survey, ***p < 0.0001.
Spatial distribution of residuals in relation to juvenile size
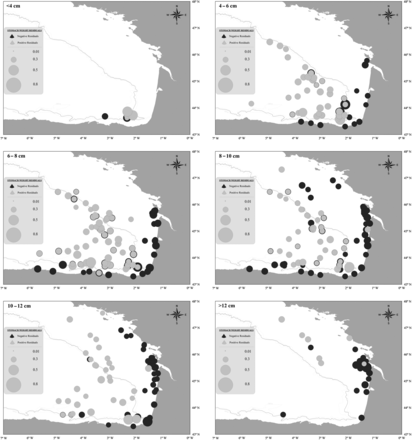
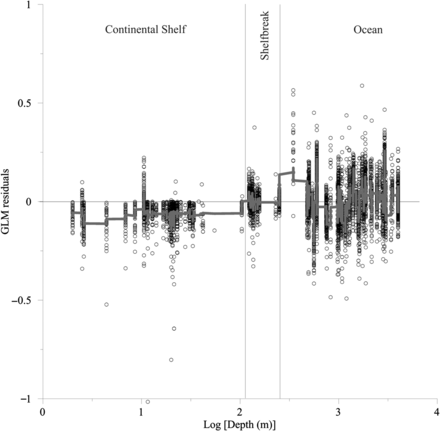
Residuals obtained from previously described GLMs were significantly higher (F test, F = 217.93, d.f. = 1, p < 0.0001) off the shelf than on the shelf (Figures 7 and 8). Positive residuals were found in the oceanic area and continental shelf areas close to the shelfbreak, whereas negative residuals were found mostly in coastal areas. Small juveniles, 4–8 cm, showed positive residual values in the oceanic and slope areas. Conversely, residuals were negative near highly productive areas on the continental shelf (e.g. Gironde River plume), although some negative residuals were also obtained for the shelfbreak, especially in the area of Cap Breton. These results were even clearer for juveniles >8 cm. High positive residuals were associated with oceanic and shelfbreak areas, such as the continental slope and especially Cap Breton, and negative values were associated with highly productive coastal regions, such as the Adour and Gironde River plume areas (Figure 7). As a general overall pattern the highest residuals were found in the oceanic area, followed by the slope and then coastal areas (Figure 8).
Spatial distribution of the residuals of the GLM in relation to anchovy juvenile size ranges (data range: JUVENA 2003–2010; N<4cm = 7; N4–6cm = 92; N6–8cm = 142; N8–10cm = 150; N10–12cm = 97; N>12cm = 45).
Distribution of the GLM residuals as a function of the bottom depth (Log Depth). Note the different regions (continental shelf, shelfbreak and oceanic areas) and the y = 0 reference-line. The continuous line represents the running average (window width: 35).
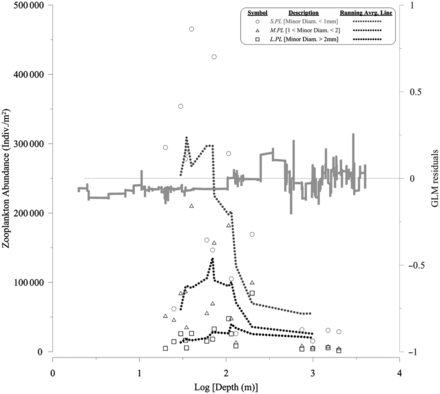
No significant relation was observed between residuals and the total zooplankton abundance (all size ranged individuals m−2) available at the same fishing point (n = 472, r2= –0.1, p = 0.48). However, available zooplankton abundance of different size categories changed with depth, as did the residuals (Figure 9). The decrease of zooplankton availability in deeper areas (i.e. off the shelf) contrasted with the increase in residual values with depth.
Total zooplankton abundance (individuals m−2) as a function of the depth (Log Depth). Each discontinuous line represents the running average of the corresponding size range, i.e. S.PL, M.PL, L.PL. The running average extracted from the GLM residuals (Figure 8) has been added as a continuous line (note the additional y axis). The y = 0 reference has also been marked.
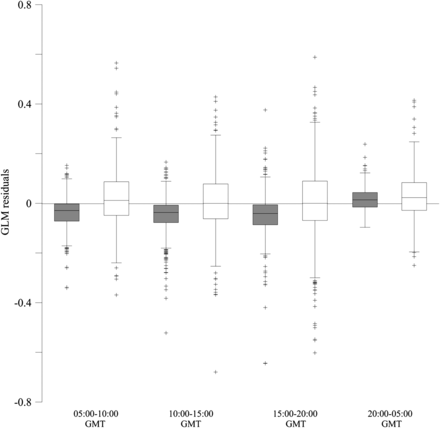
According to the time range, residuals seemed to be relatively higher off the continental shelf in most of the time ranges (Figure 10), although the low number of samples at night-time should be considered. Within the continental shelf, from 20:00 GMT– 05:00 GMT residuals were significantly higher in relation to the other ranges (F test, F = 4.74, d.f. = 3, p = 0.003). However, no significant difference was observed between the time ranges in residual means obtained off the shelf (F test, F = 1.68, d.f. = 3, p = 0.17).
GLM residuals (box plots) according to the time range. Filled box plots corresponded to the stomach of anchovies caught on the continental shelf and white box plots to those caught off the shelf. The y = 0 reference has also been marked.
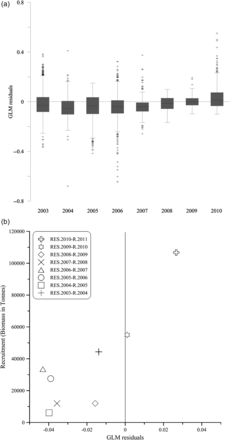
For the interannual variability, residual values in 2009 and 2010 were positive and significantly higher than in previous years (F test, F = 45.72, d.f. = 7, p < 0.0001; Figure 11a). Moreover, the mean residual value for each year showed a significant relationship (p = 0.006; r2 = 0.73) with the recruitment estimated for the following year (Figure 11b).
(a) Interannual variability of GLM residuals (box plots); and (b) the comparison between the mean residual value each year (RES) and the anchovy recruitment index estimated one year later (R).
Discussion
The specific diet of juvenile anchovy was similar to that observed in adults, with copepods being the main food resource and Calanoids the most abundant prey (Bulgakova, 1993a,b; Tudela and Palomera, 1995, 1997; Plounevez and Champalbert, 1999, 2000; Bacha and Amara, 2009; Borme et al., 2009; Van der Lingen, 2009; Bacha et al., 2010; Catalán et al., 2010). Nevertheless, the large prey groups observed in adults by other authors in the North Sea (Raab et al., 2011) and the Bay of Biscay (Plounevez and Champalbert, 1999), were generally absent in juveniles (e.g. few decapods, no euphausiids … ), suggesting that the maximum prey size is limited by the size of the juveniles (Pepin and Penney, 1997; Plounevez and Champalbert, 2000; Scharf et al., 2000), although Borme et al. (2009) suggested that size is non-limiting. Although the prey species composition was significantly different, the absence of differences for total abundance and mass of prey between anchovies located on the continental shelf and off the shelf could be explained by the difference in size of the juveniles, since juveniles found off the shelf were younger and smaller than those found on the shelf (Irigoien et al., 2007; Aldanondo et al., 2010). In addition, the low number of samples obtained off the shelf, as well as the number of prey identified in their stomachs, would suggest that more sampling is needed in order to observe differences in prey size between the shelf and offshore areas.
However, a remarkable result obtained by this work is the evidence that off-shelf anchovy juveniles have heavier stomachs than those juveniles living on the continental shelf, despite the higher amounts of available food in shelf areas. Due to the effect of the main river inputs (e.g. the Gironde River plume) as well as to the main hydro-geographical features (Irigoien et al., 2011), the zooplankton biomass on the shelf is higher than in oceanic areas in spring (Plounevez and Champalbert, 1999; Albaina and Irigoien, 2004, 2007; Zarauz et al., 2007; Irigoien et al., 2009;) and fall (this study) for all zooplankton size ranges. However, higher food density does not seem to be related to the feeding success of fish, since higher GLM residual values, indicating fuller stomachs, are mostly obtained off the shelf (i.e. in the oceanic area).
This result is in accordance with the previous results obtained for adult anchovies in the Bay of Biscay (Plounevez and Champalbert, 1999). Moreover, such a difference between the two areas was observed for almost all time ranges, and especially during daytime; at night (20:00–05:00 GMT), where previous literature describes a diel peak in feeding intensity (Tudela and Palomera, 1997), residuals were relatively higher than in the rest of time ranges, although a difference between areas was not observed, probably due to the low number of samples, especially during night-time. Concerning stomachs of anchovies off the shelf, no difference was obtained between the time ranges.
Irigoien et al. (2007), using spring data, estimated that the total biomass of the small mesozooplankton (minor axis <1 mm) on the shelf was six times that of the oceanic area, and obtained smaller differences for larger zooplankton. In this study, the general tendencies are the same, but the exact proportions differ somewhat. The mean biomass of small-sized zooplankton on the continental shelf was 17 times that of the oceanic area, whereas for the medium-sized and large zooplankton the differences were reduced to about 12 and 4 times higher, respectively. Likewise, the mean total abundance on the continental shelf was about 18 times that off the shelf. The differences from results obtained by Irigoien et al. (2007) would probably be due to the seasonal variations, also detected before by Poulet et al. (1996), although in terms of mesozooplankton betadiversity, Irigoien et al. (2011) observed that more than half of the variance in the area remains unexplained, beyond other factors defining the niche (e.g. temperature or salinity). In addition, in this work, the highest biomass concentration of large zooplanktonic organisms was found in the shelfbreak areas, as was observed in previous spring distributions (Irigoien et al., 2009).
The lower light attenuation, which would make it easier for the fish to detect prey (Aksnes and Utne, 1997), could compensate for the lower zooplankton concentration in oceanic areas. The increase in light attenuation in the coastal area by an order of magnitude suggests that if the food concentration is combined with light attenuation, the prey availability may in fact be higher off the shelf than on the shelf, which explains why there are no significant relationships between stomach weights and the zooplankton concentration. Therefore, and in accordance with the post-larvae and juvenile distribution patterns described in previous studies (Aldanondo et al., 2010; Cotano et al., 2008; Irigoien et al., 2007, 2008), as well as with the higher abundance of large organisms off the shelf, also observed in spring by Irigoien et al. (2009), the oceanic area could also favor selective (active) feeding by anchovies. Such active feeding would not necessarily be outweighing filter-feeding but be a complementary behavior, also observed in previous studies on anchovies from different areas around the world (James and Findlay, 1989; Tudela and Palomera, 1997; Plounevez and Champalbert, 1999, 2000; Bacha and Amara, 2009; Borme et al., 2009; Bacha et al., 2010; Raab et al., 2011). According to Van der Lingen et al. (2006), anchovy presents a relatively inefficient branchial apparatus (especially for filtering small particles), showing a preference for particulate over filter-feeding, and is highly size selective, choosing the largest particles available. In particular, the shelfbreak combines high rates of biomass (i.e. food concentration) with low light attenuation, which could be the best combination in terms of prey encounter potential, and would explain the heavier stomach weights of anchovies from shelfbreak areas in comparison with that observed within the continental shelf. In summer, oceanic waters in the Bay of Biscay are also warmer than coastal waters and it may be difficult to separate the effect of temperature from that of light attenuation. In the same way, the zooplankton community changes due to both time and space, according to the variability of hydrographical conditions and food availability (Poulet et al., 1996). In this sense, differences in salinity and temperature between the areas (e.g. the area under the influence of the Gironde River plume and the adjacent shelf vs. oceanic area) affecting the zooplankton community (Albaina and Irigoien, 2004) would be expected to be reflected at least in part as a response in stomach weight of anchovies. However, the recent study by Irigoien et al. (2011) suggests that, excluding large scales in the Bay of Biscay, the spatial position has a higher explanatory power than water mass characteristics. In any case, increased feeding activity levels, together with higher prey detection ranges, could contribute to the heavier stomachs found in the oceanic areas.
Further, the greater stomach weights (as well as positive residuals) observed in 2009 and 2010 coincided with high recruitment indices the following year, which suggests that feeding conditions have an influence on the survival rates of juvenile anchovies in this area. As this is a rather quick and simple procedure, it should be systematically measured in juvenile surveys to further evaluate whether it constitutes a valid biological condition parameter that helps improving the juvenile index for recruitment forecasting. Nevertheless, this result would have to be taken cautiously, as it is based in a low number of observations at this stage.
The GLM approach presented in this study confirms that, in addition to the size of juveniles, stomach weight is also affected by the area, time of sampling and year, which could at times determine the available zooplankton for fish. We therefore conclude that the diet of juvenile anchovies in the Bay of Biscay is not only a simple function of the total available food concentration, but probably the result of a combination of prey abundance and light attenuation. The role played by light attenuation in the prey encounter rate is often neglected, but in a large area like the Bay of Biscay the differences in light attenuation may be higher than those in prey abundance. A situation of comparatively lesser prey abundance may provide better feeding conditions when combined with lower predation risk (allowing more time and energy to be devoted to feeding activities) and lower light attenuation (increasing the encounter rates between juveniles and their prey). As a result the continental shelfbreak and Cap Breton Canyon, which both have relatively high zooplankton abundance and low light attenuation, are the optimum feeding areas, as reflected in the stomach weights.
Funding
This research was funded by the Ecoanchoa (FEP project, Department of Agriculture, Fisheries and Food of the Basque Country Government) and EU FP7 FACTS (Forage Fish Interactions) project, Grant Agreement No. 244966. EB is supported by a doctoral fellowship from the Iñaki Goenaga Zentru Teknologikoen Fundazioa (IG-ZTF).
This is contribution no. 601 from AZTI-Tecnalia (Marine Research Division).
Acknowledgements
We are grateful to the captains and crew of the research vessel “R/V Emma Bardán” and purse seiner “F/V Itsas Lagunak”, as well as to the onboard scientists and analysts for their support during the sampling. Very special thanks are due to L. Ferrer and Y. Sagarminaga (AZTI-Tecnalia) for their help with maps and satellite data, respectively. We would also like to thank L. Ibaibarriaga (AZTI-Tecnalia), for her invaluable help with R, and to two anonymous reviewers for their valuable comments.
References
Author notes
Handling editor: Francis Juanes


