-
PDF
- Split View
-
Views
-
Cite
Cite
Richard L. O'Driscoll, Johannes Oeffner, Adam J. Dunford, In situ target strength estimates of optically verified southern blue whiting (Micromesistius australis), ICES Journal of Marine Science, Volume 70, Issue 2, March 2013, Pages 431–439, https://doi.org/10.1093/icesjms/fss177
Close - Share Icon Share
Abstract
Estimates of the acoustic target strength (TS) of southern blue whiting (Micromesistius australis) at 38 kHz were obtained using an autonomous acoustic–optical system (AOS) mounted on a demersal trawl. Data were collected from aggregations of spawning adult [mean fork length (FL) 34.4 cm] and immature (mean FL 24.6 cm) southern blue whiting south of New Zealand. Mean TS was estimated from 162 tracks containing 695 echoes from targets identified from video as southern blue whiting. The mean TS was –37.9 dB with a 95% confidence interval (CI) of –39.7 to –36.6 dB for 21 immature fish and –34.6 dB (95% CI –35.4 to –34.0 dB) for 141 adults. A logarithmic fit through the mean TS values produced a TS–fork length (FL) relationship from optically verified targets of TS = 22.06 log10FL – 68.54. This new relationship gives TS values within 1 dB of those estimated using the relationship recently adopted by ICES for blue whiting (Micromesistius poutassou) of TS = 20 log10TL – 65.2 (where TL is total length) obtained from in situ measurements, but higher values than those estimated from the previous relationship for southern blue whiting of TS = 38 log10FL – 97, which was based on swimbladder modelling.O'Driscoll, R. L., Oeffner, J., and Dunford, A. J. 2013. In situ target strength estimates of optically verified southern blue whiting (Micromesistius australis) – ICES Journal of Marine Science, 70: 431–439.
Introduction
Southern blue whiting (Micromesistius australis, hereafter SBW) is a gadoid occurring in Subantarctic waters, with known spawning grounds off South America and southeast of New Zealand. SBW forms one of New Zealand's largest volume fisheries, with annual landings averaging >30 000 t in the last 10 years (Ministry of Fisheries, 2011). The closely related northern hemisphere species, blue whiting (Micromesistius poutassou), is even more important commercially, with landings from the North Atlantic exceeding 2 Mt per year from 2003 to 2005 (ICES, 2011).


Previous attempts to measure TS of SBW in situ have failed because of mismatch in space and time between acoustic measurements and trawl data collection, fish avoidance of towed acoustic systems, suspected contamination by smaller targets (those not properly sampled by the trawl), and high density of SBW affecting single target selection. Gauthier (2008) reviewed 22 in situ TS experiments on New Zealand SBW carried out from 1994 to 2004, and found that only three were likely to be adequate to represent SBW TS.
Recently, acoustic–optical systems (AOS) have been developed which combine internally logging echosounders with cameras, lighting, and batteries in a package that is mounted on the headline of a trawl (Ryan et al., 2009; Kloser et al. 2011; Macaulay et al., 2013). The trawl is used to herd fish past the AOS, where TS measurements can be made from targets which are visually identified from simultaneous optical coverage. These systems remove uncertainties in TS associated with fish avoidance, target identification, and single target selection. The disadvantage is that the behaviour of the fish has clearly been altered by the trawl gear, so they are not in their natural orientation (Ryan et al., 2009).
This paper describes a simple AOS, built by the National Institute of Water and Atmospheric Research Limited (NIWA) in New Zealand. This AOS was used to obtain the first estimates of TS from optically verified SBW. Results are compared with those from previous in situ measurements and modelling.
Material and methods
Description of AOS and net system
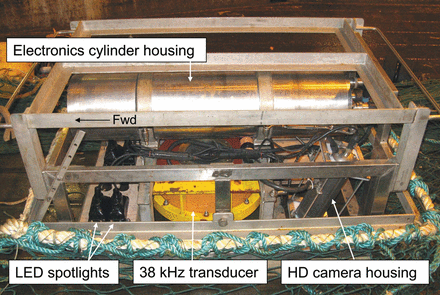
The AOS consisted of an echosounder, a high-definition video camera, lights, batteries, and various sensors that were installed into a steel frame designed for mounting on a trawl (Figure 1). The AOS was self-contained (i.e. no communication with, or power link from, the surface). Electronic components included a repackaged 38 kHz Simrad EK60 general purpose transceiver (GPT), a single-board computer running the Simrad ER60 software, and a supervisor microcontroller. These were mounted on a card cage inserted into a pressure cylinder and powered by six lithium ion batteries (14.4 V and 6.6 Ah) regulated from an Ocean Server™ battery management unit. A MicroStrain 3DM GX1 attitude sensor (measuring pitch, roll, and yaw) and a liquid level sensor (RS 317 803) were also mounted inside the cylinder housing, and an RBR 2050 pressure and temperature sensor was attached to the steel frame. Ancillary data from sensors were received via serial links (RS232), converted to Ethernet User Datagram Protocol (UDP) packets, then logged and time-stamped by the single-board computer. The acoustic transducer was a Simrad ES 38DD split beam (with nominal 7.1° beamwidth operating at 2 kW with a pulse length of 0.512 ms), mounted directly below the main cylinder housing.
Acoustic–optical system (AOS) components within the steel frame attached to the headline of the trawl. Twelve trawl floats were lashed to the top of the frame before deployment to achieve neutral buoyancy.
Another pressure cylinder was mounted parallel to the transducer and housed a Sony HDR-XR200VE high-definition video camera (H.264 format, 1440 × 1080 pixels resolution) with control circuit board and independent power supply (two parallel lithium ion batteries of 14.8 V and 7.8 Ah). Lighting was controlled by the camera circuit and enabled by two circular spotlights, each consisting of seven 30° LED (light-emitting diode) MR16 bulbs. They were powered by 11 NiCd cells (13.2 V and 7 Ah), which were positioned in a third pressure cylinder. All stainless-steel pressure cylinders were custom built, rated to 2000 m depth, and fitted with Burton underwater connectors.
The AOS was bolted into a mounting frame (Figure 1) that was attached in the centre of the headline of a NIWA full-wing demersal trawl. Twelve 360 mm diameter trawl floats each with a nominal buoyancy of 13.3 kg were attached onto the steel frame to achieve neutral buoyancy. The NIWA demersal trawl has upper and lower wings of 150 mm mesh, 40 mm mesh codend, and low (200 mm bobbins) groundgear. The trawl was rigged with 50 m sweeps and 50 m bridles, and towed with SuperVee doors of 6.1 m2. Layback chains 1 m in length were added to each side of the headline to increase the headline height from ∼3.0 m in standard configuration to 4.5–6.8 m. This was important, as the estimated nearfield of the 38 kHz transducer in the AOS was 2.1 m (Macaulay et al., 2013), meaning that acoustic TS cannot be reliably estimated from fish closer than this range. Headline height was further increased by using a low warp:depth ratio (1.6:1 instead of the more usual 2.0:1) and by towing at relatively slow speeds from 2.8 to 3.5 knots.
Study area
Experiments using the AOS (Table 1) were carried out as part of an acoustic survey for spawning SBW on the Campbell Island Rise, ∼100 km east of Campbell Island and 600 km southeast of New Zealand (O'Driscoll et al., 2012a). The Campbell Island Rise is the spawning area of New Zealand's largest stock of SBW. The survey vessel was “Tangaroa”, a 70 m research vessel owned and operated by NIWA, and the survey was carried out from 4 to 22 September 2011. To prevent equipment damage, the AOS was deployed only in conditions with winds <25 knots and swell heights <2 m.
Details of AOS deployments and trawls.
| Trawl . | Start time (NZST) . | Mark type . | Latitude . | Longitude . | Bottom depth (m) . | Tow length (km) . | SBW catch (kg) . |
|---|---|---|---|---|---|---|---|
| 15 | 16 September 2011 01:34 | Immature | 52° 26.29′ S | 170° 13.83' E | 386 | 2.59 | 178.6 |
| 18 | 18 September 2011 13:22 | Spawning | 51° 53.87' S | 170° 59.95' E | 492 | 4.11 | 286.9 |
| 20 | 19 September 2011 12:38 | Spawning | 51° 29.74' S | 170° 52.32' E | 524 | 3.40 | 44.7 |
| 23 | 20 September 2011 12:24 | Spawning | 51° 36.78' S | 170° 08.61' E | 424 | 3.13 | 5 944.8 |
Biological sampling
Catches in all trawls were sorted and weighed by species. A random sample of up to 400 SBW and 50–200 individuals of other species was measured from every tow. The sex and macroscopic gonad stage of all SBW in the length sample were also determined. Individual fish weights were measured for a subsample of 20 SBW per trawl. Estimated SBW length frequencies were constructed by scaling length frequencies from individual tows by the SBW catch in the tow. Mean FL and standard deviation were calculated.
AOS calibration
The AOS echosounder was calibrated to 600 m depth in the study area on 20 September 2011. The AOS was removed from the net and attached to a deep-coring winch wire, with a 38.1 mm diameter tungsten–carbide sphere suspended 25 m below the transducer. The system was lowered down to 600 m, stopping for 5 min every 100 m on the way down and the way up. The system gain (G0) was independently estimated at each 100 m interval using the mean of the on-axis sphere TS compensated by beam fitting with customized Matlab© functions. A Seabird SM-37 Microcat CTD datalogger was mounted on the AOS during this calibration to measure conductivity, depth, temperature, and pressure. The pressure and temperature profile was used along with mean salinity to estimate the sound velocity and density (Fofonoff and Millard, 1983), absorption coefficient (Doonan et al., 2003), and the sphere theoretical TS (MacLennan, 1983) at each depth interval.
Alignment of the AOS video and acoustic components was assessed after the voyage in a tank at NIWA Greta Point on 20 November 2011. All of the AOS components were in the same configuration as during the voyage. The camera alignment requires measuring the relative position of the video camera with respect to the sounder (translation) and the orientation angle of the camera with respect to the sounder (orientation). The centre of the face of the transducer is taken as the origin of the reference frame, with the z-axis being normal to the transducer face. The translation between the echosounder and camera was measured directly using a ruler. To compute the orientation, we measured the centre of the field-of-view for both the echosounder and the camera at a fixed range. The 38.1 mm diameter tungsten–carbide target sphere was positioned in the centre of the echosounder beam. Without changing along-tank distance to the echosounder reference position, the target sphere was then moved to the centre of the video frame and the relative position in the echosounder beam was recorded. These measurements along with the measured physical displacement of the camera and echosounder were used to determine the relative orientation geometrically using customized Matlab© functions. Finally, the target sphere was placed at the top, bottom, left, and right positions of the echosounder axes, and acoustic and video data were collected simultaneously. These data were used to verify the estimated orientation model independently by overlaying echosounder data on top of their matching video frames.
AOS analysis
Acoustic data were processed with Echoview V5.1.34 (Myriax, 2012). Bottom echoes were identified and excluded using a combination of automatic bottom detection and manual editing. Echoes within the estimated nearfield of 2.1 m (Macaulay et al., 2013) were also excluded. A single target detection algorithm—split beam method 2 (Myriax, 2012)—with customized thresholds (Table 2) was then applied to the remaining acoustic data. Single echoes were subjected to an alpha–beta tracking algorithm (Myriax, 2012) to detect fish tracks (Table 2). Acoustic data for single targets and fish tracks including ping number, time reference, angular position, range, and TS were exported.
Single target and fish track detection properties used in Echoview.
| Analysis parameters . | Value . |
|---|---|
| Single target detection criteria | |
| Beam compensation model | Simrad LOBE |
| Lower TS threshold (dB) | –60 |
| Pulse length determination level (dB) | 6.0 |
| Minimum normalized pulse length | 0.4 |
| Maximum normalized pulse length | 2.0 |
| Maximum beam compensation (dB) | 12.0 |
| Maximum standard deviation of angles (°) | 0.6 |
| Fish track detection properties | |
| Alpha | 0.7 |
| Beta | 0.5 |
| Exclusion distance—major and minor axis (m) | 2.0 |
| Exclusion distance—depth (m) | 0.3 |
| Major and minor axis weight (%) | 20 |
| Range weight (%) | 40 |
| Target strength weight (%) | 20 |
| Minimum number of single targets in track | 2 |
| Maximum gap between single targets (pings) | 3 |
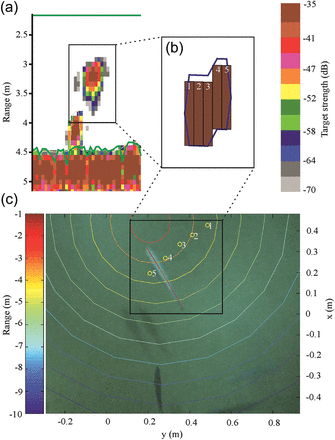
The single target and track detections were processed with their respective video data through AOS analysis software written in Matlab©. The video metadata consisted of a configuration file containing camera timing and offsets for each video file. The acoustic metadata consisted of data identifier (e.g. trawl and track numbers). AOS alignment data were obtained from the tank calibration. Using these inputs, the AOS software precisely overlaid the acoustic beam and single target positions on their respective video frames (e.g. Figure 2).
Screenshot of a filtered raw ping echogram (a), the single target detection (b), and the equivalent image on the AOS analysis software (c) for fish track 99 at station 23. Colours in (a) and (b) indicate target strength corresponding to the colour scale on the right. Data above the green line at 2.1 m (surface) and below the green line at 4.5 m (bottom) were excluded for single target detection. The image shows a SBW with a measured length of 33.1 cm and mean target strength of –30.6 dB at a range of 2.9 m. Coloured circles (note that this image was cropped) indicate the acoustic beam width where colours correspond to the range colour bar. The numbered (1–5) bars in (b) and circles in (c) represent the five single targets detected for this fish track.
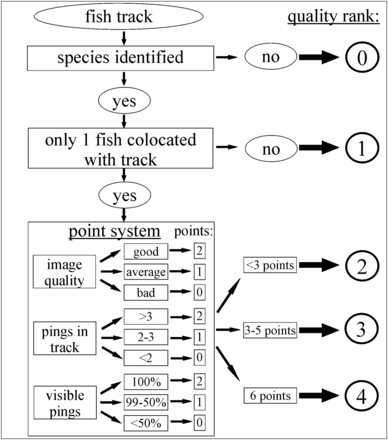
Optical quality was assessed for each fish track, and a quality rank (0–4) was assigned (Figure 3). Only tracks with a quality rank of 3 or 4 were accepted as being “optically verified”. As the AOS has only a single camera, it was not possible to use stereogrammetry to obtain FLs. However, by using accurate range derived from the acoustic track and component geometry, pixel counts from the video images were used to estimate FL of the fish (by taking the mean of three measurements). This technique was tested in the tank during calibration and could estimate the size of objects as small as the calibration sphere (diameter estimated at 40 mm). With only one camera, we were not able to assess the orientation of fish accurately, so these measurements were used only as proxies of fish size, assuming their orientation was parallel to the ocean floor.
Flowchart showing how optical quality of fish tracks was assigned. Only tracks with quality ranks of 3 or 4 were accepted as being “optically verified”.

Results
Data collection
Ten AOS deployments were attempted during 19 days in the survey area, but only four were successful (Table 1). Other deployments were unsuccessful because of failure in initiating light, echosounder, or camera operation (four deployments), insufficient fish densities (one deployment), and poor water clarity (one deployment). The four successful deployments had a total catch of 6610 kg, of which 6455 kg (98%) was SBW (Table 1). Other species caught included ling (Genypterus blacodes), javelinfish (Lepidorhynchus denticulatus), silverside (Argentina elongata), and pale ghost shark (Hydrolagus bemisi).
Two main classes of SBW marks were observed during the survey: moderately dense marks in 300–420 m depth which were associated with immature (2-year-old) SBW; and dense marks in water deeper than 380 m that were associated with spawning adult SBW (O'Driscoll et al., 2012a). Trawl 15 was on immature marks, and the 225 measured SBW had a mean FL of 24.6 cm (s.d. 1.4 cm) (Table 3). The other three AOS trawls were on spawning adult marks, with a mean FL of 34.4 cm (s.d. 3.2 cm) from a total of 793 measured SBW (Table 3).
Summary of fish length and estimated TS for SBW from AOS experiments.
| . | Immature SBW . | Spawning adult SBW . |
|---|---|---|
| Tow number | 15 | 18, 20, and 23 |
| Biological data | ||
| Number of SBW measured | 225 | 793 |
| Mean fork length ± s.d. (cm) | 24.6 ± 1.4 | 34.4 ± 3.2 |
| Optically verified targets | ||
| Samples | 95 | 600 |
| Tracks | 21 | 141 |
| Mean target strength (95% CI) in dB | –37.86 (–39.68, –36.59) | –34.63 (–35.40, –33.97) |
| Mean fork length ± s.d. (cm) | 25.3 ± 4.2 | 34.7 ± 4.1 |
| Tracked targets | ||
| Samples | 561 | 3621 |
| Tracks | 137 | 793 |
| Mean target strength (95% CI) in dB | –38.71 (–39.59, –37.94) | –35.60 (–36.01, –35.22) |
| Single targets | ||
| Samples | 1068 | 5245 |
| Mean target strength (95% CI) in dB | –37.92 (–38.56, –37.22) | –33.93 (–34.12, –33.73) |
Calibration results
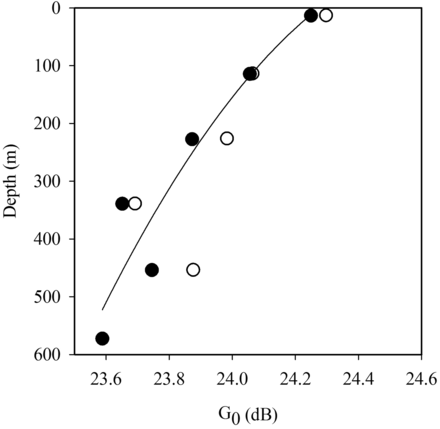
The estimated system gain (G0) varied with depth (Figure 4). AOS deployments were at depths from 386 to 524 m (see Table 1). All on-axis target sphere echoes from depths >300 m were used to estimate an overall G0 at depth of 23.7 dB. Because the target sphere could not be manipulated in the beam, the deep calibration did not produce accurate estimates of beam angle. Instead, estimated beam angles of 7.7° (alongship) and 7.5° (athwartship) from a tank calibration of the echosounder before the voyage were used.
Estimates of the system gain (G0) from the deep calibration of the AOS echosounder. Black circles show estimates of G0 for the echosounder on its way down, and white circles show estimates on the way up.
Target strength of SBW from AOS
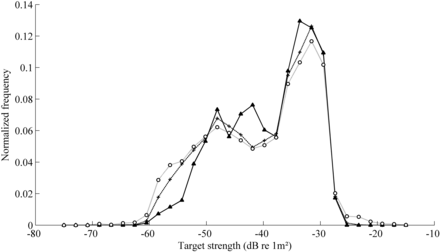
A total of 6313 single target echoes were detected from the four deployments (Table 3). Of these, 930 fish were tracked, but only 162 tracks (containing 695 single echoes) met our quality control criteria (quality rank 3 or 4) to be considered as “optically verified” SBW targets (Table 3). The TS distributions for all single targets, tracked targets, and optically verified targets are compared in Figure 5. The mean TS from of all three distributions was similar (–34.4 to –34.6 dB), but optically verified targets had a lower proportion of values less than –50 dB.
Target strength distribution of all single targets (circles–dotted line), tracked targets (crosses–dashed line), and optically verified targets (triangles–solid line).
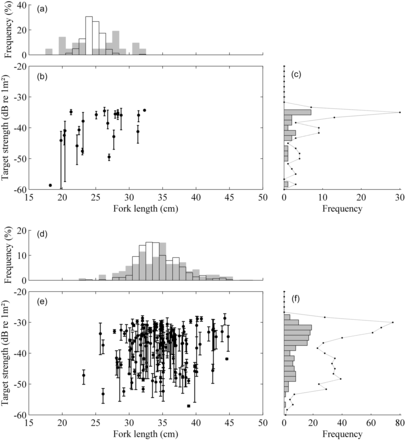
TS values of optically verified SBW were highly variable both within and between individual tracks (Figure 6). However, by averaging across targets and individual tracks, relatively precise estimates of mean TS were obtained for immature and adult SBW. The 21 tracks from immature SBW had mean TS of –37.86 dB (95% CI –39.68 to –36.59 dB) and the 141 tracks from adult spawning SBW had mean TS of –34.63 dB (95% CI –35.40 to –33.97 dB) (Table 3). FLs estimated from pixel counts were similar to measured FL in the catch (Figure 6). For immature SBW, mean estimated FL from pixel counts was 25.3 cm (s.d. ± 4.2 cm), and, for adult SBW, estimated mean length was 34.7 cm, compared with measured mean FL of 24.6 and 34.4 cm, respectively. Pixel-based length measurements assume that fish are perpendicular to the axis of the camera (parallel to the camera face). If the fish are at an angle, then pixel-based length measurements will be biased (shorter than actual length). There is also uncertainty in estimating FL from video images, where the tail of the fish may be blurred. However, agreement between pixel and direct measures of fish length (Figure 6) suggests that the results are relatively insensitive to these potential biases.
Optically verified SBW TS as function of fork length, along with histograms of fish length and TS. Data in (a) to (c) are from immature SBW (trawl 15), and in (d) to (f) are from adult SBW (trawls 18, 20, and 23). Length histograms (a and d) compare percentile frequency of fish length estimates from pixel counts (grey bars) with measured FL from the catch (transparent bars). TS histograms (c and f) show the mean TS for each track, whereas lines represent samples from individual echoes within accepted tracks.
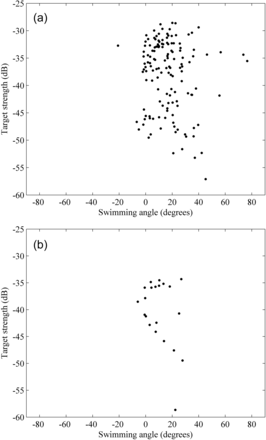
Although tilt angle values could not be optically estimated in our experiments because the AOS only had a single camera, it was possible to obtain estimates of SBW swimming angle from acoustically tracked fish. Angles were calculated between adjacent single target positions, taking into account the spatial displacement due to AOS speed over ground. The overall swimming angle for each track was the mean of the angles from adjacent target detections. There are two major caveats to this. First, fish may change their depth without changing their orientation. Second, fish swimming angle is not the same as swimbladder tilt angle, as the swimbladder may sit at some angle to the body. With these caveats in mind, Figure 7 shows a plot of TS as a function of estimated mean swimming angle for the optically verified adult and immature tracks. The mean optically verified swimming angle was 16° (i.e. slightly head up) with s.d. of 15°. There was no clear relationship between TS and estimated mean swimming angle (Figure 7). This does not indicate that SBW TS is insensitive to fish inclination, as the lack of a relationship in Figure 7 may be due to errors in the indirect measurement of tilt angle.
Optically verified TS as a function of mean swimming angle derived from acoustically detected tracks for (a) adult and (b) immature SBW.


Discussion
The in situ data for SBW obtained from the AOS was an improvement on previous in situ measurements (Gauthier, 2008) because uncertainties over target identification and single target selection were eliminated. The issue of fish avoidance was circumvented by using a trawl to herd SBW into the beam of the echosounder and camera, and the trawl catch provided direct information on fish size.
The large variability in TS we observed within and between individual fish tracks ( >25 dB for similar size fish in Figure 6) is characteristic of other similar experiments (e.g. blue grenadier; Kloser et al., 2011). TS of an individual fish may change with physiology, depth, and behaviour, which means that any single TS measurement is a stochastic variable (Simmonds and MacLennan, 2005). Fortunately, by averaging across a large number of tracked targets, the variability is reduced (through the central limit theorem) so the expected mean TS from a group of targets is relatively well estimated.
Aggregations of immature and spawning SBW were separated by depth during the 2011 acoustic survey (O'Driscoll et al., 2012a), so we were able to obtain TS estimates from two distinct size classes of SBW. This allowed us to estimate the slope of the TS–length relationship empirically, as was recommended by McClatchie et al. (2003). Previous studies using the AOS on orange roughy (Macaulay et al., 2013) and blue grenadier (Kloser et al., 2011) have only measured one size class of fish, so the slope of the TS–length relationship has been estimated from swimbladder modelling or other work. Similarly, the recently published in situ data for blue whiting covered only a relative narrow range of fish lengths (21.4–28.1 cm TL) and so a slope of 20 was assumed for the TS–length relationship (Pedersen et al., 2011).
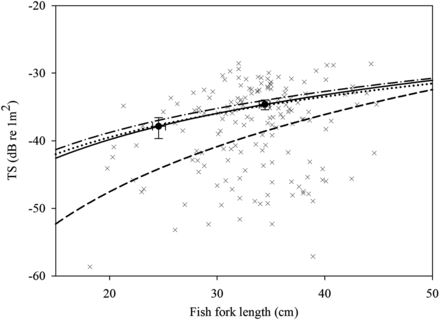
Figure 8 compares our new TS–length relationship with previous blue whiting relationships. The new relationship [Equation (5)] gives similar (within 1 dB for the fish from 20 to 50 cm FL), but slightly lower, TS values than those predicted from the relationship recently adopted by ICES for blue whiting (Pedersen et al., 2011), but much higher TS than that estimated from the relationship for SBW derived from swimbladder modelling (Dunford and Macaulay, 2006), which has a much steeper slope and a lower intercept than the new relationship. If the slope is fixed at 20 [Equation (6)], our new data give TS values 0.75 dB lower than the equivalent relationship of Pedersen et al. (2011) [Equation (3)], after the blue whiting relationship has been corrected for the difference between TL and FL (Figure 8).
Comparison of different TS–length relationships for blue whiting. Filled circles show mean optically verified TS for immature and adult SBW from this paper (with 95% confidence intervals). The solid line shows our new “optically verified” SBW relationship of TS = 22.06 log10(FL) – 68.54. The dotted line is the fit to our data when the slope is fixed at 20. The dashed line shows the previous SBW relationship based on swimbladder modelling (Dunford and Macaulay, 2006). The dashed-dotted line is the in situ relationship for northern blue whiting (Pedersen et al., 2011). Crosses show the mean TS for individual fish tracks plotted as a function of optically estimated fish length.
TS estimated from swimbladder modelling is sensitive to tilt angle distribution and the inflation level of the swimbladder, both of which are uncertain for SBW. Dunford and Macaulay (2006) ran sensitivities by varying tilt angle and inflation levels, and concluded that the slope of the TS–length relationship was likely to be much greater than 20. This is not consistent with our findings, which estimates a slope of 22.1. Previous reviews of the literature have found that the slope of the TS–length relationships for most species is between 15 and 30 (McClatchie et al., 1996, 2003; Simmonds and MacLennan, 2005), so the slope of 38 estimated for SBW by Dunford and Macaulay (2006) is unusually high, especially for a gadoid fish where published slopes are usually close to 20 (McClatchie et al., 1996; Simmonds and MacLennan, 2005).
It appears likely that the steep slope in model estimates of SBW TS (Dunford and Macaulay, 2006) was due to an inappropriate application of the Kirchhoff-approximation (KA) model (Foote, 1985; Medwin and Clay, 1998) at small swimbladder sizes. Recent work by G. J. Macaulay et al. (unpublished data) found systematic errors in KA models of swimbladders relative to other models when the product of the semi-minor axis (b) of the swimbladder and the acoustic wave number (k) was <1. Resin casts of SBW swimbladders were available from the previous study by Dunford and Macaulay (2006). These were used to estimate the semi-major and semi-minor axes of the prolate spheroids which represented each swimbladder. For a 50 cm FL SBW, the product of the semi-major axis of the swimbladder (a) and the acoustic wave number (ka) was 13.5 and kb was 5.2, and for a 20 cm SBW, ka was 1.7 and kb was 0.55. The low value of kb for small SBW suggests that the KA method may not be valid for these fish (G. J. Macaulay et al., unpublished data).
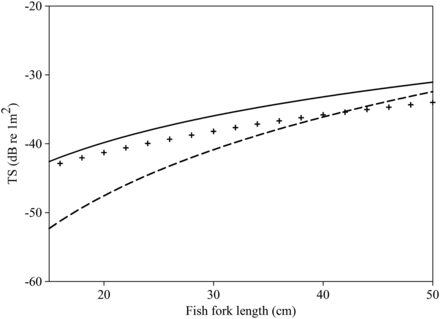
To illustrate the effect of choice of swimbladder model, an alternative model, the prolate-spheroidal-modal-series (PSMS) model (Furusawa, 1988), was applied to estimate SBW TS. Linear relationships between FL and swimbladder length and width were calculated from cast data, and equivalent prolate spheroid swimbladders were generated for a range of FL between 16 and 50 cm. As in Dunford and Macaulay (2006), TS from the PSMS model was calculated over a tilt angle range of –40° to +40° and convolved with a fish tilt-angle distribution with a mean of 0° and s.d. of 15° to estimate the tilt-averaged TS. These new PSMS swimbladder model results gave TS at least 5 dB higher than estimates from the KA model of Dunford and Macaulay (2006) at small FL (Figure 9). The slope of the TS–FL relationship estimated from the PSMS model was 18.2, which was more similar to that from in situ estimates, although PSMS model estimates of TS were still 2–3 dB lower than in situ estimates for adult SBW (Figure 9).
Comparison of TS estimates for SBW derived from prolate-spheroid-modal-series (PSMS) swimbladder models (crosses) with the relationship based on swimbladder modelling using the Kirchoff-approximation model (dashed line) and our new “optically verified” relationship (solid line). The best fit through the PSMS model results is TS = 18.2 log10(FL) – 64.9.
As discussed by Ryan et al. (2009), the disadvantage of AOS measurements of TS is that the behaviour of the fish has been altered by the trawl gear, so they are not in their natural orientation. Actual tilt angle values could not be estimated in our experiments, but swimming angles had a mean of 16° (i.e. 16° head up) and an s.d. of 15°. As a comparison, Kloser et al. (2011), using a stereo-camera system, estimated that herded blue grenadier had an average tilt of –9° (i.e. 9° head down) with a range from 24 fish of –37° to 16°. No information exists on the natural in situ orientation of SBW, but experiments using moored cameras (e.g. O'Driscoll et al., 2012b) may provide a means of collecting such data.
We believe the TS estimates in this paper are the most robust available for SBW because of the optical verification. Estimates of adult SBW biomass in the Campbell Island Rise in 2011 using the new TS–FL relationship [Equation (5)] would be only 45% of those obtained using the existing SBW relationship [Equation (1)]. Because of the very different slopes of the alternative TS–FL relationships in Equations (1) and (5), the effect on biomass is length dependent, with a greater difference at smaller fish lengths (Figure 7). If the new relationship is correct, we may be overestimating immature SBW abundance in 2011 by a factor of 4.5 (i.e. 22% of that from the existing relationship). This would lead to a bias within the relative time-series where acoustic surveys overestimate fish at younger ages relative to older ages.
Further research is required to attempt to reconcile differences between SBW swimbladder modelling and in situ TS results. These include better understanding of SBW tilt distribution, the relationship between swimbladder tilt and swimming angle, swimbladder inflation levels, and swimbladder morphology. Perhaps the most urgent need is an investigation of differences between juvenile and adult SBW TS.
Acknowledgments
We gratefully acknowledge funding from the New Zealand Ministry for Primary Industries Research Project SBW2010/04A. Particular thanks go to the officers, crew, and scientific staff of RV “Tangaroa” for their expertise and dedication, and for the technical expertise provided by Richard Nelson and Ben Lennard. Matlab© code for the PSMS model was generously provided by Gavin Macaulay, who also gave us access to his unpublished work, providing insights into the discrepancies between swimbladder model and in situ TS results. Ian Doonan, Gavin Macaulay, and three anonymous referees reviewed a draft of this paper and made helpful suggestions and improvements.
References
Author notes
Handling editor: David Demer


