


Abstract
This study made use of distribution and abundance data of demersal fish and cephalopod species targeted during trawl surveys off Angola, Namibia and the west coast of South Africa, to determine species richness patterns including the location of diversity hotspots in the Benguela Current Large Marine Ecosystem. The reliability of alternative techniques for determining species richness patterns over the study domain, including geostatistical and non-geostatistical interpolation methods and regression type modelling, was tested using a cross-validation method. Generalized additive models were found to be the most effective method and were used to generate horizontal maps of species richness for different periods in each country. Despite changes in community structure that have been documented during the study period and which may be associated with climatic changes, this study showed the presence of consistently predictable hotspot areas over a 20–30-year study period (depending on country). The relationship between species richness and physical/environmental variables was inconsistent between countries, but generally hotspots of species richness were associated with greater depths and cooler bottom temperatures. Range shifts of species associated, for example, with warming of temperatures could conceivably affect the spatio-temporal persistence of hotspots in the long term.Kirkman, S. P., Yemane, D., Kathena, J., Mafwila, S. K., Nsiangango, S. E., Samaai, T., Axelsen, B., and Singh, L. 2013. Identifying and characterizing demersal fish biodiversity hotspots in the Benguela Current Large Marine Ecosystem: relevance in the light of global changes. – ICES Journal of Marine Science, 70: 943–954.
Introduction
The marine environment is heterogenous and resources tend to be patchily distributed in terms of abundance and biodiversity (Mackas and Boyd, 1979), influencing the interface between the environment and human activities in both space and time. Biological “hotspots” in the marine realm generally refer to localized areas of biological importance either because they are associated with key processes such as spawning, nursery or feeding areas, or because they have significantly elevated levels of productivity or biodiversity relative to the surrounding seascape (Kimura and Tsukamoto, 2006; Palacios et al., 2006; Reese and Brodeur, 2006). Given their potential in terms of supporting human livelihoods and the conservation of biodiversity and/or natural processes (Myers et al., 2000; Sydeman et al., 2006), identifying biological hotspots and determining which factors govern and maintain them is a growing area of research (Worm et al., 2003; Malakoff, 2004). In this study, biodiversity criteria were used to define hotspots, in accordance with the definition of a biodiversity hotspot as a biogeographical area with a significant reservoir of biodiversity (Myers, 1988).
Identification of biodiversity hotspots using species distributional data has frequently been employed when determining conservation priority areas in the terrestrial realm (Pimm and Lawton, 1998; Myers et al., 2000) and also in the marine realm (Roberts et al., 2003; Worm et al., 2003). Criteria such as peaks in species richness, endemism, or rarity have generally been considered in this regard (Prendergast et al., 1993; van Jaarsveld et al., 1998; Fox and Beckley, 2005; Hiscock and Breckels, 2007). In the ocean, elevated levels of biodiversity are frequently associated with specific features such as coral reefs or seamounts (Worm et al., 2003). Notwithstanding such features, however, relatively little consideration has in general been given to benthic or demersal communities in the identification of marine biodiversity hotspots to prioritize conservation; instead, a disproportional amount of effort in marine hotspot studies has been dedicated to pelagic species, mainly top predators, either because many such species are known to be of conservation concern or because they are relatively easy to study or may be used as surrogates for wider biodiversity or for fisheries (Worm et al., 2003; Sydeman et al., 2006). However, while hotspot areas may overlap for different trophic groups (Worm et al., 2003), biodiversity hotspots based on top predators or other pelagic species may not be applicable for much of the fauna existing at or near the ocean bottom.
Globally, biodiversity is regarded to be under serious threat from climate change, given that ecosystem changes associated with stress typically result in localized or regional reductions in biodiversity levels (Warwick and Clarke, 1995; Midgley et al., 2002; Thomas et al., 2004). The relevance of marine biodiversity hotspots in this regard is debatable. On the one hand, species richness is thought to be associated with more efficient use of resources and a greater capacity to ensure ecosystem stability under disturbance or stress (Naeem and Li, 1997; Loreau et al., 2001) such as may be caused by climatic or other variability. Considering this and to maximize the biodiversity that can be conserved within the minimum amount of area, marine biodiversity hotspots may be obvious locations for conservation efforts such as spatial protection, in the light of climate variability and other global changes. On the other hand, it has been pointed out that biodiversity hotspots in the marine environment may on the whole be less suited for conservation, compared with the terrestrial realm, because many marine animals tend to move extensively between areas (Worm et al., 2003). Moreover, climatic stress may also result in geographical shifts in biodiversity mediated, for example, through the response of component species to climate-related environmental shifts in their ecological niches (Hampe and Petit, 2005; Foden et al., 2007); theoretically, this could affect the spatio-temporal persistence of hotspots, with implications for their conservation relevance.
The Benguela Current Large Marine Ecosystem (BCLME), given the key situation of its southern extent with regard to the Global Climate Conveyor Belt and other interactions with neighbouring ocean systems, is considered to be critically located in terms of the global climate system, but at the same time critically vulnerable to any future climate change or variability (O'Toole et al., 2001). It is one of four major coastal upwelling ecosystems of the world which occur at the eastern boundaries of the oceans, in this case the South Atlantic Ocean adjoining Angola, Namibia, and the west coast of South Africa (Figure 1). Like other such systems (the Humboldt, California, and Canary systems), it is an important centre of marine food production, supporting an important reservoir of biodiversity and biomass of zooplankton, fish, seabirds, and marine mammals (van der Lingen et al., 2006). Recent studies have shown changes in sea surface temperatures in large areas of the BCLME over the last 30 years (Belkin, 2009; Roault et al., 2009), including warming of substantial areas off Angola and Namibia and offshore of the west coast of South Africa, but with cooling in the inshore (near the coast) area off South Africa (Figure 2). Changes in the distribution of several marine organisms that exist or at least feed in pelagic waters (van der Lingen et al., 2006; Coetzee et al., 2008; Kirkman et al., 2012) and of the structure of pelagic communities (Howard et al., 2007; Utne-Palm et al., 2010) have been documented for parts of the ecosystem during this period. Such changes have not been limited to the pelagic environment, however; shifts in the structure of offshore demersal fish assemblages (Atkinson, 2010; Mafwila, 2011) and inshore communities (Blamey et al., 2012) have also been documented for large parts of the Benguela region. It is of interest to determine whether such changes will be reflected in spatio-temporal changes in hotspots of biodiversity, given the desirability of conserving biodiversity, the utility of monitoring biodiversity as an indicator of ecosystem changes, and the potential relevance of hotspots of biodiversity for these ends.
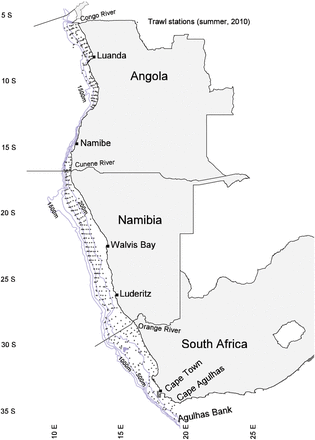
Locator map of the study area, with the trawl stations (points) conducted during summer of 2010 used to display the typical distribution of sampling per year of study.
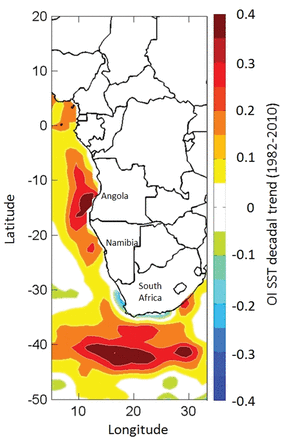
Map showing the decadal trend in SST in the study area over the period 1982–2010 (Mathieu Rouault, pers. comm.).
This study focuses on demersal fish and cephalopod species of the BCLME and addresses the following aims:
to evaluate appropriate techniques for identifying demersal biodiversity hotspots in the BCLME based on species distributional data;
to identify biodiversity hotspots in the BCLME and assess their persistence in space and time;
to characterize biodiversity hotspots in terms of physical/environmental associations;
based on the results of the above, to discuss the relevance of demersal biodiversity hotspots in the BCLME with regard to the effects of climate variability and other changes.
Material and methods
Data collection
Data were obtained from annual summer (between January and April) demersal biomass research trawl surveys that were conducted under the Nansen Survey Programme in Namibia and Angola and by the Department of Agriculture, Forestry and Fisheries (DAFF) in South Africa. The Norwegian Research Vessel (RV) “Dr Fridtjof Nansen” conducted the surveys along the Angolan coast from 1985 to the present and along the Namibian coast from 1990 to 1999. At this stage, Namibia's surveys were continued by that country's Ministry of Fisheries and Marine Resources making use of the commercial vessel Blue Sea I, after 2 years (1998/1999) when parallel surveys were performed to enable the intercalibration of data collection between this vessel and the RV “Nansen”. In South Africa, the surveys were conducted using the RV “Africana” (since 1984).
For Namibia and Angola, the locations of trawls along the coastline were determined semi-randomly along transects positioned perpendicular to the coast, spaced 20–25 nautical miles apart and up to 80 nautical miles in length (Johnsen and Kathena, 2012). Each 100-m bottom depth interval from 90 to 600 m generally contains at least one trawl station, and the distribution of trawls for each depth and latitude interval is kept relatively uniform. Trawl locations in South Africa were determined in a pseudo-randomly sampled manner using a set of 5 × 5 min grid cells, with survey lines randomly distributed along the shelf in a depth range of ∼30–500 m. Duration of trawls in each country was 30 min at ∼3 knots towing on the seabed. In cases where trawl duration was not 30 min, the catch was nevertheless standardized to 30 min tow duration. The catch rate for the study was defined as the biomass caught per standard trawl. Conductivity, temperature, and depth (CTD) measures of the water column was associated with each trawl station in South Africa. CTD measures were also taken in Namibia and Angola during most surveys but typically not for every trawl station, and the spatial coverage of CTD stations varied considerably between years in these countries.
Data sorting and vetting
Catch and effort data from the demersal trawl surveys conducted by the RV “Dr Fridtjof Nansen”, the Blue Sea I, and the RV “Africana” in the three countries were integrated within a single relational database, housed in Access (Microsoft Office 2007). All positional data were plotted within a geographical information system (GIS) (ESRI ArcGIS 9.2), projected at WGS 1984 UTM zone 33, to identify incorrect locations. Unless these could be corrected, the associated records were excluded from analyses. All records were checked for possible errors associated with mistaken species codes, spelling, etc., and potential errors in identification were checked for by comparing the species occurrence per country with the known ranges of species using appropriate species catalogues and expert opinion.
The demersal trawl surveys in this study targeted fish, including teleosts and cartilaginous fish (sharks, rays, and skates), and cephalopods. Therefore, only these groups were used to determine biogeographic patterns in diversity; crustaceans and other non-cephalopod invertebrates were excluded from the analyses, as were any pelagic, bentho-pelagic, and mesopelagic fish that were incidentally caught in the trawls. The resulting databases for Angola, Namibia, and South Africa consisted of 870, 441, and 387 taxa (mostly identified to species level) from 2768, 4220, and 2528 trawl stations, respectively. However, only taxa that occurred in more than 5% of trawl stations conducted per country were included in further analyses. This reduced the number of taxa to 89 for Angola, 52 for Namibia, and 50 for South Africa.
Data analysis
First, data matrices consisting of the occurrence of each species per standardized trawl station were imported to the statistical software programme PRIMER-E 6 (Plymouth Routine In Multivariate Ecological Research) developed by Clarke and Warwick (2001). Species richness (the number of species caught per standard 30 min trawl) was estimated for each station as a measure of diversity. The resulting diversity data, consisting of species richness of each trawl station conducted during summer surveys in each country throughout the time-series, were used to generate horizontal maps. These were determined for the entire time-series and for shorter periods within the time-series (5 years, unless there less than two complete surveys within 5 years). This was done per country, given the differences in the sampling design between countries (especially between South Africa and the other two countries) and the differing lengths of time-series. The periods were for Angola: 1985–1990, 1991–2000, 2001–2005, and 2006–2010; Namibia: 1990–1995, 1996–2000, 2001–2005, and 2006–2010; South Africa: 1984–1990, 1991–1995, 1996–2000, 2001–2005, and 2006–2010. Three different statistical approaches were used to generate the maps, using the software programme R version 2.14.0 (R Development Core Team, 2012) with the following packages incorporated: gstat (Pebesma, 2004), SoDA (Chambers, 2012), lattice (Sarkar, 2008), and mgcv (Wood, 2004, 2006).
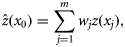
 the interpolated data at the unsampled location, and wj the weight according to the distance among the unsampled and sampled locations, with the sum of the weights constrained to equal 1 (Fortin and Dale, 2005). The underlying premise is that nearby locations are more likely to have similar values; therefore, data interpolated for unsampled locations is weighted according to its distance from known sampled data (Fortin and Dale, 2005).
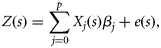

 the unbiased estimate of the linear coefficient which is obtained, using generalized least-square estimates, as follows:
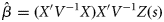

The covariance is usually modelled by fitting a theoretical covariance function which takes one of the various set of theoretical functions (spherical, exponential, nugget, power, gaussian, linear, etc.). The fitted theoretical variograms can include one or the sum of many of basic variogram models, each of which can have its own zonal or geometric anisotropy parameters. To solve this system of linear algebraic equations, the sum of the weights is constrained to equal 1 as for IDW, such that there are more equations than unknown parameters to estimate (Fortin and Dale, 2005). The variant of kriging used was kriging with external drift (KED, also known as universal kriging), which was developed to model large-scale trends in spatial data (Fortin and Dale, 2005).
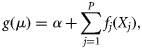
As with GLMs, the observed response is assumed to obey some underlying statistical distribution from the exponential family (e.g. Gaussian, Poisson, binomial, or gamma distributions) with the specified mean, µ (Hastie and Tibshirani, 1986). Count data most often conform to a Poisson distribution, therefore, models assuming a Poisson distribution were used in this study. The appropriateness of the models was assessed by examining the diagnostic plots (fitted values vs. residuals and quantile–quantile plots), and model selection between the GLM and the GAM was based on the Akaike Information Criterion (AIC)—the model with the lowest AIC value was accepted as the model that best explained the changes in the response variable.
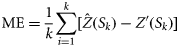
 the estimated values of the response variables at location Si, and Z′(Si) are values of the response variable at validation location Si. The IQR was computed as the difference between the first and the third quartile. For RMSE and IQR, low values are desirable and indicate greater reliability, whereas for ME, values as close as possible to zero are desirable. After ranking each technique on an increasing scale of reliability from one to three for each period/country based on the values of the above statistics, the most appropriate technique(s) was determined and used to identify the location of hotspots in the region. In this study, as for others where a similar approach was applied (Prendergast et al., 1993; Williams et al., 1996; Parviainen et al., 2009), spatial regions were considered to be hotspots if their diversity was in the top 5% (diversity ≥95% quantile).
Measures of an environmental variable that can potentially influence the distribution of demersal species, namely bottom sea temperature that was collected at or near many trawl stations, were compared between hotspot areas and areas representative of other quantiles of species richness (≤5, 6–50, and 51–95%), as in McClatchie et al. (1997). Whereas for South Africa, CTD data were available for the vast majority of trawl stations, this was not the case for the other two countries in most years. Moreover, the trawl data and CTD data collected from the same vicinity during the Namibian and Angolan surveys were captured in separate databases and were not linked, for example, by a common code. Therefore, spatio-temporal matching in a GIS was required to link trawl stations to the nearest CTD station for each survey. In this regard, the criteria were applied that, to be associated, trawl and CTD stations had to be within 10 km distance of each other and with less than a 30 m difference in bottom depth between them.
Results

In terms of reliability as inferred from the ranking of the performance statistics following cross-validation (Table 1), the GAMs generally performed better than the other two techniques, although this was not consistently the case: GAMs performed best for Angola, South Africa, and overall, whereas KED was the most reliable for Namibia. Given their close comparison, both GAMs and KED were used to generate horizontal maps of species richness to identify hotspots and allow for contrasting of the spatial predictors between the techniques where appropriate. IDW on the other hand performed relatively poorly (Table 1) and was disregarded in further analyses. Plots of the GAM smoothed response surfaces of species richness as a function of geographic locations (longitude and latitude) and species richness–depth response curves for each country over the entire study period are given in Figure 3. Similar plots broken down per shorter periods, as well as plots of the best variogram models used to determine the parameters for modelling species richness per country and period with KED, are provided as Supplementary material.
Comparison of cross-validation results between IDW, KED, and GAMs, following the use of these techniques to estimate species richness over the spatial domain of each country (Angola, Namibia, and South Africa).
| Country and period | IDW | KED | GAMs | Scores | ||||||||
|---|---|---|---|---|---|---|---|---|---|---|---|---|
| ME | RMSE | IQR | ME | RMSE | IQR | ME | RMSE | IQR | IDW | KED | GAMs | |
| Angola | ||||||||||||
| 1985–2010 (all) | −0.2143 | 5.6629 | 7.4856 | −0.0004 | 5.3708 | 7.0546 | 0.0018 | 5.4366 | 7.1193 | 3 | 9 | 6 |
| 1985–1990 | 0.0332 | 5.1039 | 5.0350 | 0.0176 | 4.9152 | 5.3588 | 0.0128 | 4.8617 | 4.8449 | 4 | 5 | 9 |
| 1991–2000 | 0.1506 | 5.5636 | 7.4938 | 0.0029 | 5.1626 | 6.9725 | −0.0001 | 5.0361 | 6.4538 | 3 | 6 | 9 |
| 2001–2005 | −0.0207 | 5.8923 | 8.0338 | 0.0035 | 5.4953 | 7.4198 | 0.0031 | 5.4473 | 7.5364 | 3 | 7 | 8 |
| 2006–2010 | 0.0753 | 5.1860 | 6.3439 | 0.0028 | 4.9510 | 6.2054 | −0.0029 | 4.9444 | 6.3732 | 4 | 8 | 6 |
| Average for country: | 3.4 | 7.0 | 7.6 | |||||||||
| Namibia | ||||||||||||
| 1990–2010 (all) | −0.3749 | 3.8989 | 5.1562 | −0.0014 | 3.5793 | 4.6042 | 0.0019 | 3.6747 | 4.7170 | 3 | 9 | 6 |
| 1990–1995 | −0.0774 | 3.4827 | 4.8923 | −0.0019 | 3.3482 | 4.4168 | −0.0065 | 3.3106 | 4.3272 | 3 | 7 | 8 |
| 1996–2000 | −0.2125 | 3.9872 | 5.3706 | −0.0015 | 3.6442 | 4.7926 | −0.0010 | 3.7600 | 4.8211 | 3 | 8 | 7 |
| 2001–2005 | −0.2250 | 3.6927 | 4.8649 | −0.0018 | 3.3186 | 4.4147 | 0.0024 | 3.3022 | 4.2911 | 3 | 7 | 8 |
| 2006–2010 | −0.0921 | 3.9769 | 5.2364 | −0.0025 | 3.3871 | 4.3401 | −0.0022 | 3.4091 | 4.3248 | 3 | 7 | 8 |
| Average for country: | 3.0 | 7.6 | 7.4 | |||||||||
| South Africa | ||||||||||||
| 1984–2010 (all) | −0.0573 | 4.5523 | 5.8304 | −0.0003 | 4.3007 | 5.2852 | −0.0068 | 4.3475 | 5.3529 | 3 | 9 | 6 |
| 1984–1990 | 0.0200 | 5.2323 | 7.6659 | 0.0152 | 5.0334 | 7.2838 | −0.0052 | 4.9114 | 7.1888 | 3 | 6 | 9 |
| 1991–1995 | 0.0759 | 4.2560 | 5.3110 | −0.0038 | 4.1433 | 5.0472 | −0.0275 | 4.1434 | 4.8797 | 3 | 8 | 7 |
| 1996–2000 | 0.0057 | 3.9662 | 5.3599 | 0.0320 | 3.5411 | 5.1125 | 0.0575 | 3.4143 | 4.4455 | 5 | 6 | 7 |
| 2001–2005 | −0.1751 | 3.8011 | 4.9697 | −0.0154 | 3.3159 | 4.3554 | −0.0070 | 3.2563 | 4.0925 | 3 | 6 | 9 |
| 2006–2010 | 0.0256 | 3.7839 | 5.0300 | 0.0065 | 3.4516 | 4.8228 | 0.0001 | 3.4408 | 4.7021 | 3 | 6 | 9 |
| Average for country: | 3.4 | 6.4 | 8.2 | |||||||||
| Overall average: | 3.2 | 7.1 | 7.6 | |||||||||
Values of ME (the mean of the residuals) that are closest to zero and the lowest values of RMSE (root mean squared error) and IQR (inter-quartile range) are desirable in that they indicate the best fit, so they are displayed in bold. The performance of each technique was ranked from 1 (poorest fit) to 3 (best fit) for each statistic (ME, RMSE, and IQR) under ‘Scores’; the average of these sums across the periods are provided for each country and for all the countries together.
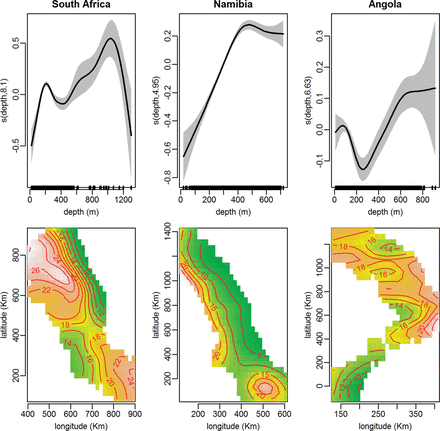
Result of GAMs used to predict species richness for the whole time-series of Angola, Namibia, and South Africa, showing the species richness vs. depth response curve and the species richness vs. latitude and longitude response surface (the iso-lines represent species richness) for each country.
The patterns of species richness including the location of hotspots were generally consistent between the predictions of KED and GAMs, except for slight differences in extent as captured by the alternative models. In Figure 4, both GAMs and KED spatial predictions are presented for the entire study periods of each country. In Figure 5, only the GAMs spatial predictions are presented for the two countries where this technique provided the most reliable predictions, namely Angola (Figure 5a) and South Africa (Figure 5b) (the KED results for these countries are provided as Supplementary material). For Namibia (Figure 5c) where KED performed marginally better than GAMs, the results of both techniques are shown (GAMs in top panels and KED lower panels).
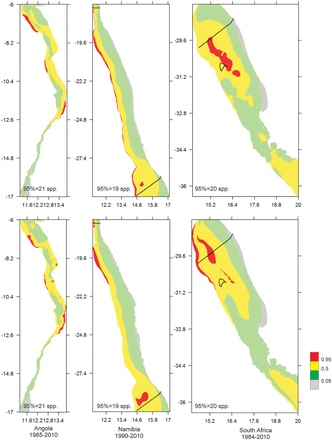
Horizontal map of the study areas in Angola, Namibia, and South Africa showing quantiles of species richness according to predictions of KED (top panels) and GAMs (bottom panels), for the entire study period. Hotspots are the red areas, i.e. with species richness ≥95% quantile; the number of species represented by the 95% quantile is shown.
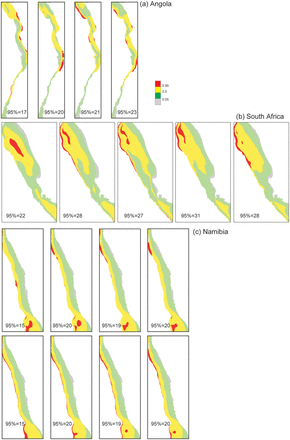
Horizontal map of the study areas in (a) Angola, (b) South Africa, and (c) Namibia, showing quantiles of species richness according to predictions of GAMs (a, b, and top panels of c) or KEDs (lower panel of c), for the shorter periods within the study period. Hotspots are the red areas, i.e. with species richness ≥95% quantile; the number of species represented by the 95% quantile is shown.
According to the GAMs, the response of species richness to increasing depth varied between countries (Figure 3). In Namibia, species richness increased until ∼500 m before it subsided slightly. In Angola, species richness peaked at around 100 m and declined up to depth of the ∼250 m after which it increased, whereas a contrasting pattern was apparent in South Africa where the pattern was bimodal, with an initial increase (to ∼250 m) followed by a decline at intermediate depth before it increased at greater depths (∼1000 m). For South Africa and Namibia, patterns of species richness including the locations of hotspots were generally consistent over time, according to each method (Figure 5). Hotspots in these countries were associated with the vicinity of the shelf break and upper slope areas, but also at shallower depths within an area that transcends the boundaries between the two countries (Figures 4 and 5). The predictions for Angola were a little more variable between periods (Figure 5), and the species richness-depth gradient that prevailed in most of the study area was reversed in the central Angolan area, where hotspots occurred in the inshore area. Lower capabilities to identify organisms during the initial survey period in all three countries are probably reflected in the lower value of the quantiles (represented by the values of the 95% quantiles in Figure 5) during this period, relative to the later periods. This could possibly have influenced predictions for the initial period, which generally showed less similarity to the subsequent periods than they did to each other.
The relationship of hotspot areas based on GAM predictions to bottom temperature showed consistent association of hotspots with relatively cooler areas and the association of areas of low diversity (“coldspots”) with warmer temperatures (Figure 6, the same figure based on KED predictions is given as Supplementary material). However, the pattern with respect to areas characterized by intermediate biodiversity varied between the three countries: in South Africa and Angola, such areas were generally characterized by cooler bottom temperatures (based on the median bottom temperature), whereas in Namibia the pattern was a consistent decrease in the bottom temperature associated with the increasing quantiles from the lowest quantile to the highest (hotspots of species richness).
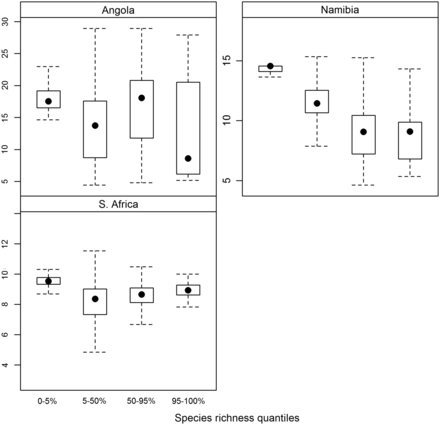
Box–whisker plots of bottom temperature associated with different quantiles of species richness for Angola, Namibia, and South Africa, according to GAM predictions. Closed circles represent the median values, the upper and lower hinges represent the upper and lower quartiles, respectively, and the whiskers represent 1.5 × the interquartile range.
Discussion
The world's oceans are under increasing threat from human activities, including overfishing and bycatch, habitat degradation, shipping, mining, ocean dumping, and bioprospecting (Mills and Carlton, 1998; Sink et al., 2012). Climate change is regarded to be another important threat because significant stress to ecosystems typically results in localized or regional reductions in biodiversity levels, and considering detrimental effects on certain marine species and ecosystems that have been associated with climatic changes (Midgley et al., 2002; Thomas et al., 2004). For these reasons, biodiversity, in general, is potentially a valuable indicator of ecological change (Warwick and Clarke, 1995), and studies of marine species (especially fish) are tending to shift to a more ecosystem-based approach in which communities are considered as opposed to the single-species approach of the past (Reese and Brodeur, 2006). This study, which considered demersal communities of one of the world's 64 large marine ecosystems, is a case in point. Focusing on demersal fish and cephalopods which were targeted during systematic trawl surveys, it is the first study to comprehensively assess demersal biodiversity patterns for the entire BCLME and identifies biodiversity hotspots. Elsewhere, demersal fish diversity has been used as a surrogate for the diversity of other marine taxa in broad-scale biogeographic studies (e.g. Butler et al. 2010). The level of taxonomic resolution with which crustaceans and other non-cephalopod invertebrates (e.g. molluscs, echinoderms) that were incidentally caught during the surveys in this study were identified was relatively poor and inconsistent between years; therefore, no attempt was made to relate the species richness of demersal fish and cephalopods to that of other taxa. However, this should be investigated in future. Finally, physical (depth, latitude, and longitude) and environmental (seabed temperature) relationships of species richness patterns, including hotspot areas, were assessed.
Similar to the approach used in several other such studies (e.g. Luoto et al., 2004; Moser et al., 2005), data collected at sampling (trawl) stations were used to estimate diversity indices per station, followed by the use of geostatistical interpolation or regression type modelling techniques to obtain estimates for unsampled locations within the study grid. This is seen as a traditional approach for determining species richness patterns using species distributional data (Parviainen et al., 2009); an alternative is whereby each species is modelled separately and hotspots of species richness are then identified by summing up the spatial predictions of the individual species distribution (Lehmann et al., 2002; Parviainen et al., 2009). Although the latter approach has certain advantages (Parviainen et al., 2009), it was not used in this study mainly because of the large numbers of species that had to be contended with. Confidence in the identification of hotspot locations was reinforced by the close resemblance of species richness patterns between two different techniques (GAMs and KED), barring minor differences in extent as captured by the different models. Some other studies have used IDW to obtain spatial coverage especially if the data lacked spatial correlation, but it performed poorly by comparison in this study, probably because of the strong spatial gradients of species richness especially with regard to depth. In general, higher species richness was associated with deeper water, although depth dependent species richness varied among the three countries: off Namibia, species richness consistently increased up to a depth of 400 m after which it declined slightly; off Angola, richness showed two peaks with depth, a minor peak at shallower depth followed by a second larger peak in deeper water; a similar depth dependent pattern of richness to Angola, though peaking at different depths, was observed off South Africa.
As can be judged from the depth-dependent response curves of species richness (Figure 3), most hotspot areas corresponded to the furthest offshore extent of sampling, more or less at the shelf break, and coldspot areas of relatively low species richness corresponded to the inshore areas. The relationship was not consistent throughout the study domain, however, with a reversal of this trend in part of central Angola and the presence of hotspot areas at intermediate depths in the south of Namibia and the north of South Africa. Only in Namibia was there a clear increase in species richness with decreasing temperature (Figure 6). This was most likely a reflection of the stronger effect of depth, which is inversely related to bottom temperature. In Angola and especially South Africa, the relationship between species richness quantiles and bottom temperature was less straightforward, similar to the species richness–depth gradients in these countries. Generally, however, hotspot areas were associated with colder bottom temperatures and coldspots with warmer bottom temperatures.
It appears that the depth-dependent pattern of species richness varies among ecosystems globally but the most consistent aspect of these studies is the non-linear nature of the pattern in richness as a function of depth. Examples include the symmetric pattern in richness of demersal fish off Alaska, USA (Mueter and Norcross, 1999), an increase in species richness with depth on Chatham Rise, New Zealand (McClatchie et al., 1997), and a peak in richness in shallower water after which it declined consistently to a depth of 500 m on the south coast of South Africa (Yemane et al., 2010). Establishing the causative processes of the observed gradients is outside the scope of this study, but in general the observed depth-dependent richness patterns are expected to be influenced by various factors including productivity, environmental conditions, evolutionary history of the system, and disturbance (both natural and anthropogenic). The relationships of biodiversity to ecosystem functioning, productivity, and disturbance are hot topics in ecology (e.g. Worm and Duffy, 2003; Worm et al., 2006).
Another important topic, one that is central to conservation biology, is how to conserve a maximum of biodiversity in a minimum amount of area (Werner and Buszko, 2005). In this regard, spatial management including marine protected areas (MPAs) has become an increasingly popular tool to counter modern threats to marine biodiversity and ensure the sustainability of fisheries (Attwood et al., 1997; Lombard et al., 2007). It is widely held that selected MPAs should be as representative as possible to conserve biological diversity and make the best use of the limited resources available for conservation (Pressey et al., 1993; Stewart et al., 2003). This has resulted in the development of systematic approaches for determining reserve systems in an efficient and scientifically defensible manner (Margules and Pressey, 2000; Turpie et al., 2000), including identification of hotspots or ecologically or biologically sensitive areas. A key requirement of hotspots in this regard, and especially in terms of their capacity for sustaining representative levels of biodiversity, is that they should be persistent over time (Irons, 1998; Etnoyer et al., 2004). The presence and the location of hotspots in this study were generally coherent with this requirement, at least at the spatial-temporal scales of the study. This was despite considerable changes in the structure and the function of demersal communities in parts of the BCLME that have been documented during this period, at least some of which have been apportioned to environmental changes (Howard et al., 2007). These include shifts in community structure in both the inshore and the offshore demersal systems of the southern Benguela (Atkinson, 2010; Mafwila, 2011; Blamey et al., 2012). However, any geographical shifts in biodiversity mediated, for example, via the response of component species to climate-related environmental shifts in their ecological niches (Hampe and Petit, 2005; Foden et al., 2007) could have implications in the longer term for species richness patterns and therefore affect the persistence of hotspots in space and time.
Supplementary data
Supplementary material is available at the ICESJMS online version of the manuscript.
Acknowledgements
The authors would like to acknowledge contributions of regional institutions namely the Fisheries Management branch of the Department of Agriculture, Forestry, and Fisheries in South Africa, the National Marine Information and Research Centre of the Ministry of Fisheries and Marine Resources in Namibia, and the Instituto Nacional de Investigação Pesqueira of the Ministério da Agricultura e Desenvolvimento Rural e Pescas in Angola, which supported this study and made data available. The Norwegian Agency for Development Cooperation is thanked for supporting the NANSCLIM project and facilitating meetings of the demersal task team. Matthew Roualt is thanked for contributing Figure 2. Two anonymous reviewers are thanked for their insightful and constructive comments on the version of the manuscript that was originally submitted.
References
Author notes
Handling editor: Marta Coll
