


Abstract
Perch (Perca fluviatilis) is an important prey species of the great cormorant (Phalacrocorax carbo sinensis) in the coastal waters of the northern Baltic Sea. The annual predation mortality caused by cormorants was estimated based on the consumed numbers of perch in relation to the abundance of perch in vulnerable age groups in the sea. We used existing stock assessment data (Archipelago Sea) or a simple population model in other areas (Gulf of Finland, Bothnian Sea, and Quark), based on commercial and recreational perch catches, and estimated fishing and natural mortalities, with distributions describing our understanding about the likelihood of different values for every variable. The median predation mortality was 4–10% annually, depending on the sea area. The area-specific 80% likelihood limits ranged from 3 to 21% annually. Compared to a recent perch tagging study in the Quark, the cormorant-induced mortality estimates were considerably lower, but the likelihood distributions partly overlapped. The results were sensitive to the estimated number of vulnerable perch in the population, which in turn largely depends on the natural mortality in young perch age groups.
Introduction
Cormorants’ (Phalacrocoracidae) effects on natural fish populations continue being a subject of debate, and even if several studies have been published, there seems to be no general agreement on the issue (Ovegård et al., 2021). One reason to this is in many cases the lack of data on the prey fish populations (Arlinghaus et al., 2021).
The coastal waters of northern Baltic Sea, including the Finnish coast, have been largely occupied by great cormorant (Phalacrocorax carbo sinensis) during recent decades, starting at the end of the 1990s from the more southern parts, and extending gradually northwards. In the southern coast of Finland, the growth of the cormorant population has levelled off, and the numbers of breeding pairs have been relatively constant since the mid-2010s (Finnish Environment Institute (SYKE), 2020). In the northern parts of the Gulf of Bothnia, the cormorant abundance is still growing.
Eurasian perch (Perca fluviatilis), hereafter perch, is one of the most common prey species in the cormorants’ diet (Lehikoinen et al., 2011; Salmi et al., 2015; Ovegård et al., 2021). Perch is a freshwater species and favours relatively sheltered and shallow sea areas (Kallasvuo et al., 2016). Also, it is a desired prey species for human fishers, and economically important for coastal commercial fisheries, which tends to cause conflicts between the fishing industry and environmental organizations (Svels et al., 2019). On the other hand, perch is abundant in the coastal waters and preyed upon by many other predators such as pike (Esox lucius), pikeperch (Sander lucioperca), and large conspecifics (Heikinheimo et al., 2018).
For estimating the potential effect of predation mortality caused in the prey fish population by a predator, knowledge on the absolute biomass or numbers of fish consumed is not enough. To assess the effect on prey population and fisheries we should know at least which proportion of the available prey resources is taken. This apparently depends on the abundance of the given prey species and its size distribution, which exhibit wide annual variation in the coastal waters (e.g. Kokkonen et al., 2019). An important factor is how the cormorants react to changes in the fish community. Cormorants are generalist predators and able to adapt their diet and feeding areas according to the availability of the prey species (Salmi et al., 2015). Also, predation may not be additive to other sources of natural mortality, as predators tend to take individuals that have high probability of mortality in the first place (Hilborn and Walters, 1992).
In Finland, the exploited coastal fish stocks in the most important fishing areas are annually monitored by the Natural Resources Institute Finland (Luke), and catch statistics are obtainable on both commercial and recreational fisheries (Official Statistics Finland, hereafter OSF). In many other parts of the Baltic Sea, data on the recreational catches are scarce, and therefore, the estimated consumption of a given fish species by cormorants is often compared to the commercial fisheries’ catches to describe the effect of cormorants (e.g. Hansson et al., 2018). However, the cormorants mostly eat smaller size classes of the species such as perch compared to fisheries (Salmi et al., 2015). Moreover, the fisheries catch depends on the fishing effort. Thus, the predation mortality should be rather estimated on the basis of abundance of the prey fish at vulnerable sizes in the environment.
Earlier studies on consequences of cormorant predation on fish populations in the Baltic Sea have been mostly based on correlations between fish catches and the numbers of cormorants (Vetemaa et al., 2010; Östman et al., 2012), and only in few cases the predation mortality of the prey fish has been estimated (Östman et al., 2013; Heikinheimo et al., 2016). Recently, Veneranta et al. (2020a) used tagging of perch to estimate the mortality and potential catch losses in the fisheries.
Here, we produced rough perch population size estimates for different coastal areas, using the fisheries catch data and mortality estimates, to be compared to the estimated numbers consumed annually by the local cormorant population. Only in the southwestern coast, the Archipelago Sea, perch abundance assessment data are available since 1980 (Olin et al., 2020). Probability distributions were used for the input variables in the model to address the uncertainty of the output estimates. The goal was to estimate the proportional annual mortalities of perch, with distributions of likelihood, caused by cormorants in different coastal areas. A special case was the ICES statistical rectangle 55H1 in the Quark, where the tagging experiment (Veneranta et al., 2020a) was performed in 2018, and mortality estimates from two different methods could now be compared.
Material and methods
Study area
Baltic Sea is a brackish water basin. The salinities in the Finnish coast range from 0 to 7‰ in the Gulf of Finland and southwestern Archipelago Sea, decreasing towards the Bothnian Bay in the northern Gulf of Bothnia (Pitkänen et al., 2001). Eutrophication is causing water turbidity in the inner bays and archipelago areas and local oxygen deficit in deep areas especially in the southern coast (Fleming-Lehtinen et al., 2015).
In this study, the Finnish coast was divided to subareas according to the HELCOM assessment areas (Figure 1, HELCOM, 2010). The northernmost subarea, the Bothnian Bay, was not considered as the number of breeding cormorants is still small. Åland was not considered because there is no permanent breeding population of cormorants. The Quark and Bothnian Sea were combined because they cannot be distinguished in the recreational fisheries statistics, and a remarkable part of the perch catch comes from recreational fisheries. However, the ICES statistical rectangle 55H1, which was separately modelled, represents the situation in the Quark.
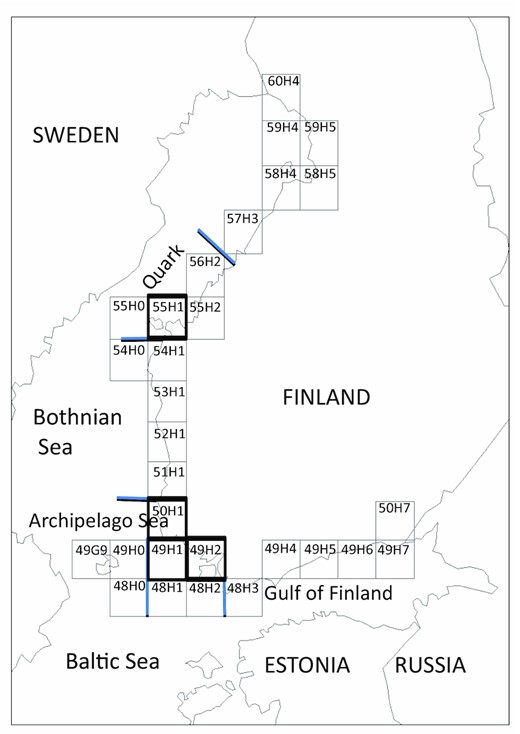
The coast of Finland with ICES statistical rectangles. The borders of sea areas are shown with blue lines. The rectangles 55H1 in the Quark and 49H1, 49H2, and 50H1 in the Archipelago Sea are bold.
Perch and cormorant largely utilize similar habitats, as perch dwell in sheltered and relatively shallow waters and avoid open water areas (Böhling and Lehtonen, 1984; Veneranta et al., 2020a). Cormorants favour areas with abundant fish stocks and moderate depths, which allow easy diving to the bottom-dwelling fish (Hentati-Sundberg et al., 2018; Byholm et al., unpublished data).
Study period
The numbers of breeding cormorant pairs grew since the beginning of the 2000s in all areas but have levelled out during the latter half of the 2010s (Finnish Environment Institute (SYKE)). In the Archipelago Sea, the steep population growth ceased already in 2008 (Figure 2). The period of years considered in the study areas was chosen based on the perch catch and cormorant abundance data, so that an equilibrium state of populations in all areas could be assumed, i.e. there was no apparent trend in the perch catch estimates and the growth of cormorant population had already levelled out.
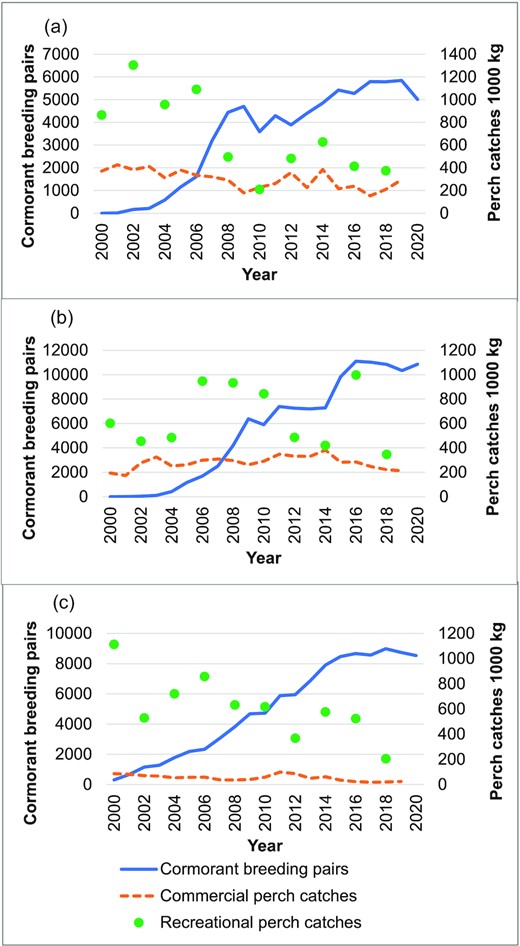
Perch catch estimates and cormorant nest counts in the coastal areas of Finland in 2000–2020, (a) Archipelago Sea, (b) Bothnian Sea and Quark, and (c) Gulf of Finland.
For consistency, in all areas (except rectangle 55H1) perch catch data from 2008 to 2019 was included in the analysis, and cormorant nest numbers in 2015–2020. In the Archipelago Sea, the last 3 years were excluded because of uncertainty in the perch stock assessment method (VPA). In the rectangle 55H1 in the Quark, perch catches 2010–2017 and the number of cormorants in 2018 were used to enable comparison with the results of the tagging study (Veneranta et al., 2020a).
Perch fisheries and catch estimates
The most important commercial perch fishing areas are the Archipelago Sea, the coast of the Bothnian Sea and the Quark. In the Gulf of Finland, commercial catches are low compared to the recreational catches. Commercial gillnet fishing effort has decreased in all coastal waters, leading to lower catches (Lappalainen et al., 2021). Perch catches are also strongly affected by stock fluctuations due to temperature circumstances in summer (Kokkonen et al., 2019). Therefore, the ups and downs in the perch catches do not always coincide in different areas (Figure 2). Perch benefits from moderate eutrophication, but high nutrient levels are known to have an adverse effect (Persson et al., 1991; Olin et al., 2002).
The statistics on commercial and recreational catches of perch (data in Supplement 1) were derived from Natural Resources Institute Finland (Luke); OSF, 2021a). The commercial catch estimates are based on obligatory monthly catch reports of coastal commercial fishers. The recreational catch estimates are based on questionnaire surveys made every 2 years, with a stratified sampling of 7500 people living in the various parts of Finland, with names obtained from the Population Register. To correct for potential bias caused by non-responders, a sample of those is interviewed by phone (OSF, 2021b). The catch estimates may contain random variation and bias (Moilanen, 2001), and consequently their precision is not high, which partly reflects in the wide range in annual catch estimates (Figure 2). However, they were considered reliable enough to represent the limits of interannual variability in the catches.
In the coastal areas of Finland, the commercial perch catch varied between 200 and 400 tonnes in the Archipelago Sea and in Bothnian Sea–Quark and was below 100 tonnes in the Gulf of Finland. The recreational catches were in most years clearly larger, even manifold, compared to the commercial catches (Figure 2). In the Archipelago Sea and Gulf of Finland, the high catch level in both recreational and commercial fisheries in the beginning of the 2000s was due to strong perch year classes in the 1990s (Pekcan-Hekim et al., 2011; Kokkonen et al., 2019), and after that the commercial catches have varied and the recreational catches have been on a lower level. In Bothnian Sea and Quark, the recreational catch estimates varied from about 1000 tonnes to less than 400 tonnes and seem not to be associated with the development of commercial catches, which have increased until recent years (Figure 2).
Perch abundance estimation
The perch population in the Finnish coast consists partly of fast-growing individuals, mainly females, that recruit to the fishery mostly at ages 5–6. The other part of the population, mainly males, is slow-growing and largely not targeted by fishery, as the length remains below 25 cm (Veneranta et al., 2020a,unpublished data). Thus, the fisheries catch includes mainly perch from the fast-growing subpopulation, and predation by cormorants on the slow-growing subpopulation is not of interest from the fisheries point of view (Figure 3). The cormorants utilize perch smaller than targeted by fishers, mainly lengths from 9 to 22 cm, belonging to age groups 1–5 (Salmi et al., 2015).
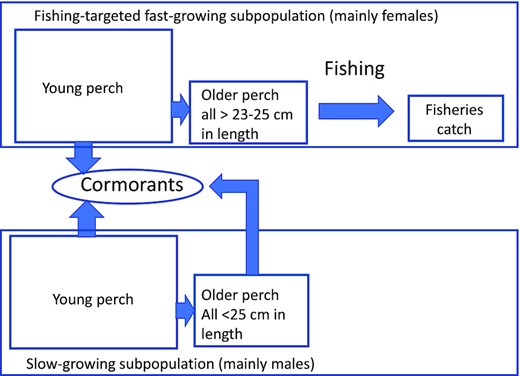
The subpopulations of perch as targeted by fishing and cormorants.
For calculating the proportional mortality caused by cormorants on perch, the abundance of the age groups vulnerable to cormorants of the fast-growing, fishing-targeted subpopulation should be estimated. The data on perch catches, age distributions and mean weights in catch samples, and mortality estimates were used in a simple population model to estimate first the number of perch in the fisheries catch, and in the fishing-targeted subpopulation [Equation (1) below], and consequently, the number of perch in young age groups (≥ 2) before recruitment to fishing in an equilibrium state [Equation (2) below]. The age group 1 was not included because it may not be in suitable size for cormorants in all years, with the growth rate depending on temperatures, and there is wide variation in abundance due to high natural mortality.
In the Archipelago Sea, the estimate of perch stock size was based on standard virtual population analysis (VPA; cohort analysis; Pope, 1972) on the perch stock (Kokkonen et al., 2019; Olin et al., 2020; Supplement 1), using commercial and recreational catch data, and catch-at-age data from the commercial catch samples from rectangles 49H1, 49H2, and 50H1 (Figure 1). As the population size estimates for most recent years in the VPA assessment are typically uncertain and depend considerably on the terminal fishing mortality values set for the last year (Pope, 1972), the perch stock assessment for the years 2008–2016 only was included in the analysis.
The individual data were based on perch samples from commercial gillnet and trap net catches, annually collected by Natural Resources Institute Finland (Luke) as part of the EU Data Collection Framework. The total length and weight of the fish were measured, sex and maturity stage were determined, and ages and distances of annual rings for back-calculation of lengths-at-age were measured from the operculum bones, using a binocular microscope (Kokkonen et al., 2019).
Instantaneous mortality rates
The natural mortality of perch especially in small size classes is highly uncertain but known to be negatively size-dependent (Sogard, 1997; Gislason et al., 2010). According to the review by Heibo et al. (2005), the instantaneous natural mortality (M) was 1.5–2.5 per year in juvenile perch, and 0.2–0.9 per year in adult perch at the latitudes of 60–64° (populations with low asymptotic total length; L∞ = 15–25 cm), but was higher at more southern latitudes. In piscivorous populations of large-growing perch, M in adult perch ranged from about 0.2 to 0.7 (Heibo et al., 2005). In unfished perch populations in small Finnish lakes, average M was estimated at 0.59–0.96 for perch at 8–16 cm length (Horppila et al., 2010). A total of three optional patterns of age-specific natural mortality rates were assumed in this study, to cover the uncertainty, using values 0.1–0.2 for the age groups recruited to fishing, and 0.3–0.9 for young age groups (Table 1). In reality, the M values should probably be higher as the cormorant predation was affecting the perch population during the study period, but for simplicity this was not taken into account. Thus, the population size of the vulnerable perch age groups will be slightly underestimated and consequently, the cormorant-induced mortality overestimated.
Optional values of instantaneous natural mortality (M) of perch by age, used in the model.
| Age | Low M | Medium M | High M |
|---|---|---|---|
| 2 | 0.3 | 0.6 | 0.9 |
| 3 | 0.3 | 0.6 | 0.9 |
| 4 | 0.3 | 0.6 | 0.9 |
| 5 | 0.2 | 0.3 | 0.4 |
| 6 | 0.1 | 0.2 | 0.2 |
| 7 | 0.1 | 0.2 | 0.2 |
| ≥8 | 0.1 | 0.1 | 0.1 |
| Age | Low M | Medium M | High M |
|---|---|---|---|
| 2 | 0.3 | 0.6 | 0.9 |
| 3 | 0.3 | 0.6 | 0.9 |
| 4 | 0.3 | 0.6 | 0.9 |
| 5 | 0.2 | 0.3 | 0.4 |
| 6 | 0.1 | 0.2 | 0.2 |
| 7 | 0.1 | 0.2 | 0.2 |
| ≥8 | 0.1 | 0.1 | 0.1 |
The mortality values used for rectangle 55H1 differed from those of the other areas, to enable comparison to the tagging study by Veneranta et al. (2020a; Supplement 3).
The fishing mortality (F) values used in the model were based on the estimates from age distributions in trap net catches in the Archipelago Sea (Heikinheimo and Lehtonen, 2016), the total mortality (Z) in age groups ≥ 7 ranging from 0.5 to 0.6 per year in male perch and from 0.6 to 0.7 per year in female perch in the period 2000–2012. Assuming a natural mortality 0.1–0.2 in these age groups, the fishing mortality would be between 0.4 and 0.6, as mainly females are targeted by fisheries. The age group 5 was assumed to be partly recruited to fishing (most likely 50%), and ages ≥ 6 completely recruited (in rectangle 55H1 age group 5 not recruited, Supplement 3). There are probably differences in the mortality rates in different areas, but the Archipelago Sea perch is well-examined, and long-term data on perch stocks were not available from other areas. For rectangle 55H1, mortality estimates from Veneranta et al. (2020a) were used (Supplement 3, Supplementary Table S1).
Perch population model
Na = number of perch in age group a in the population in the beginning of the year,
a = age (years),
Z = total instantaneous mortality rate per year, i.e. M + F.
Then a coefficient K = ∑Ny/∑Nf, was calculated, as a ratio between the numbers of perch in the sub-population of young age groups Ny (ages 2–4 and 50% of age 5) targeted by cormorants and the catchable sub-population targeted by fisheries Nf (50% of age 5 and ages ≥ 6). Probabilities assessed for the values of F and M were used to estimate the probability of K-value, which was expressed as a triangle distribution (Tables 1 and 2).
Assumed probabilities of optional F and M values and resulting probability distribution of the coefficient K. Optional M values for different age groups can be seen in Table 1 and the simplified probability distribution used for K in simulation in Table 4. (Values for Rectangle 55H1 in Supplement 3).
| F optional value | F probability | M option | M probability | Probability distribution | Value of K |
|---|---|---|---|---|---|
| Low | 0.1 | 0.03 | 3.4 | ||
| 0.4 | 0.3 | Medium | 0.7 | 0.21 | 7.7 |
| High | 0.2 | 0.06 | 17.3 | ||
| Low | 0.1 | 0.05 | 3.9 | ||
| 0.5 | 0.5 | Medium | 0.7 | 0.35 | 8.8 |
| High | 0.2 | 0.1 | 19.6 | ||
| Low | 0.1 | 0.02 | 4.4 | ||
| 0.6 | 0.2 | Medium | 0.7 | 0.14 | 9.7 |
| High | 0.2 | 0.04 | 21.6 |
The medium natural mortality was assumed to be the most probable (Table 2), based on Heibo et al. (2005) and Horppila et al. (2010). Smallest values are least probable because the perch are prey for predator fishes such as pike and pikeperch, and the food consumption of the populations of predator fishes is clearly larger, even manifold compared to that of cormorants (Heikinheimo et al., 2018). Also, M includes the mortality caused by cormorants, if assumed to be additive to other mortality sources. The highest value of fishing mortality F (0.6) was assumed to be less probable than the smaller values because the fishing effort with gill nets has been decreasing in the last decade in all areas (Lappalainen et al., 2021; Table 2).
Uncertainty
The uncertainty of the values of output variables was assessed using @RISK-software (Palisade). A probability distribution was defined for each input variable, based on literature or own data (Tables 2–4). The calculations were iterated 10000 times using random parameter values drawn from these distributions. The probability distributions of output variables illustrate the uncertainty about the true value of the output variable. The 25–75% percentile interval is the range within which the true value of the output variable is with about 50% likelihood and the 10–90% interval describes the 80% likelihood range.
Input-variable likelihood distribution estimates used in the estimation of the food consumption of a cormorant population of 1000 nests (2000 birds).
| Variable name, abbreviation | Expected value | Likelihood distribution | Notes |
|---|---|---|---|
| Breeding sub-population, breeding period | |||
| April–May–June, bird count | 2 000 | ||
| Fish consumption kg bird–1 d–1 | 0.436 | Triangle (0.392; 0.436; 0.48) | Ridgway (2010); ± 10% |
| Number of days | 73 | Triangle (61; 73; 91) | Birds present 0, 12, or 30 days in April |
| July adults, bird count | 2 000 | ||
| Fish consumption, kg adult–1 d–1 | 0.542 | Triangle (0.488; 0.542; 0.596) | Ridgway (2010); ± 10% |
| July chicks, bird count | 2 000 | Uniform (1 500 –2 000) | 2 per nest, or less if nests destroyed |
| Fish consumption, kg chick–1 d–1 | 0.327 | Triangle (0.294; 0.327; 0.36) | Ridgway (2010); ± 10% |
| Number of days in July | 31 | ||
| Young or non-breeding sub-population, April–July | |||
| Bird count in April | 667 | 25% of the whole population | |
| Fish consumption kg bird–1 d–1 | 0.436 | Triangle (0.392; 0.436; 0.48) | Ridgway (2010); ± 10% |
| Number of days in April | 12 | Triangle (0; 12; 30) | |
| Bird count in May–July | 1 000 | Histogram (1 000; 1 334; probabilities 0.7/0.3) | 33 or 40% of the whole population |
| Fish consumption kg bird–1 d–1 | 0.436 | Triangle (0.392; 0.436; 0.48) | Ridgway (2010); ± 10% |
| Number of days in May–July | 92 | ||
| Whole population after breeding time (August–September) | |||
| Bird count (as a result from previous calculation) | 5 000 | 4 500–5 334 (distribution results from previous calculation) | Breeding population + chicks + non-breeding population |
| Fish consumption kg bird–1 d–1 | 0.436 | Triangle (0.392; 0.436; 0.48) | Ridgway (2010); ± 10% |
| Number of days | 27 | Triangle (−11; 27; 61) | Autumn migration 20 July–30 September, median 27 August |
Input-variable likelihood distribution estimates used in the estimation of the numbers of individuals in the perch population and the proportion consumed by cormorants (proportional annual mortality). The values used for rectangle 55H1: see Supplement 3, Supplementary Table S1.
| Variable name, abbreviation | Expected value | Likelihood distribution | Notes |
|---|---|---|---|
| Commercial catch (kg year –1) | |||
| – Gulf of Finland | 46 167 | Uniform (18 000–99 000) | OSF 2008–2019 |
| – Bothnian Sea and Quark | 290 667 | Uniform (212 000–382 000) | OSF 2008–2019 |
| Recreational catch (kg year –1) | |||
| – Gulf of Finland | 487 167 | Uniform (205 000–632 000) | OSF 2008–2018 |
| – Bothnian Sea and Quark | 671 167 | Uniform (347 000–997 000) | OSF 2008–2018 |
| F, fishing mortality of perch (year –1) | 0.5 | Histogram (0.4; 0.5; 0.6; probabilities 0.3/0.5/0.2) | Heikinheimo and Lehtonen (2016) |
| M, natural mortality of perch (year –1) | 0.15 | Triangle (0.1; 0.15; 0.2) | Own estimate, recruited stock |
| Mean weight of perch in the catch (kg) | 0.239 | Triangle (0.156; 0.239; 0.26) | Archipelago Sea, samples from commercial catch 2010–2019 |
| Coefficient K | 8 | Triangle (3; 8; 23) | ∑Ny/∑Nf, see text for explanation |
| Number of perch in young age groups in Archipelago Sea | 67*106 | Triangle (25*106; 67*106; 180*106) | Estimate from VPA at different optional mortality rates |
| Number of cormorant nests | |||
| – Gulf of Finland | 8 662 | Uniform (8470–8988) | Nest count 2015–2020 |
| – Bothnian Sea and Quark | 10 666 | Uniform (9836–11 109) | Nest count 2015–2020 |
| – Archipelago Sea | 5 522 | Uniform (5012–5849) | Nest count 2015–2020 |
| FC, Fish consumption per cormorant nest | 0.22 | Triangle (0.14; 0.22; 0.31) | Total consumption (tonnes)/nest count (Table 3) |
| Proportion of perch in the cormorants’ diet % | 30 | Uniform (20; 30; 40) | Salmi et al. (2013, 2015) |
| Share of the perch sub-population targeted by fisheries in the diet % | 50 | Triangle (40; 50; 60) | Perch catch samples, Archipelago Sea and Quark |
| Mean weight of perch in the diet (kg) | 0.047 | Uniform (0.042; 0.047; 0.052) | Salmi et al. (2015) |
Cormorant diet data
Cormorant diet data is available from the western Gulf of Finland, years 2002–2010 (Lehikoinen et al., 2011), Archipelago Sea and Bothnian Sea, years 2010–2012 (Salmi et al., 2013, 2015) and Quark, year 2008 (Salmi, 2011). The diet consists of over 30 different species, and there are large differences in the composition annually and even weekly. In general, the cormorants utilize prey species that are abundant and easily available (Salmi et al., 2015). There are no diet data from the rectangle 55H1, but data exist from Quark (rectangle 55H2) from the year 2008, according to which the proportion of perch was slightly below 20% (Salmi, 2011). The abundance of perch and other optional prey species, mainly roach (Rutilus rutilus), could affect the percentage proportions in the cormorant diet. According to experimental coastal gillnet fishing data, perch and roach together composed on the average 50–84% of the whole catches (numbers of individuals) in the Gulf of Finland and in the Archipelago Sea (Koekalastusrekisteri, 2021; experimental gillnet fishing register). There was wide irregular variation in the annual catches per unit of effort (CPUEs) in both species during the 2000s, the maximum CPUEs being three to fivefold compared to the minimum CPUEs in both species. To cover potential interannual variation, percentage proportions of perch 20–40% in the cormorants’ diet were used for all areas and for the rectangle 55H1, too.
Cormorants can occasionally swallow large fish, but mostly the prey fish are small. The mean size of the prey perch in the Archipelago Sea was about 15 cm, SD 3 cm (Salmi et al., 2015). The sexes or ages of perch could not be determined in the diet samples; but the age distribution of perch was approximated using the length–age key from trap net catches (Salmi et al., 2015). In the diet of cormorants, we have assumed that the selection of prey is size-dependent, and about half (40–60%) of perch in the size classes caught by cormorants are males/females.
Food consumption of cormorants
The food consumption estimate of the cormorant population covers the breeding population and their chicks as well as the young non-breeding individuals (subadults) during breeding time, and the consumption after the breeding period until the migration to the wintering areas. The spring migration of cormorants to the Finnish coast takes place in March–April, depending on the duration of ice cover, and they mostly leave in August–September (HALIAS, 2021, cormorants breeding mostly in the Gulf of Finland, see Supplement 2). The median of spring migration was 18th April in the period 2011–2017 and end of April in 2000–2010 (HALIAS,2021, Supplement 2). Part of the population starts the autumn migration immediately after breeding at the end of July or beginning of August, the mass migration peaking in August–September (median 27 August according to HALIAS,2021, Supplement 2), while a smaller part stays in the coastal waters until October and in mild winters some even longer.
The foraging flights of the breeding population mostly extend to 5–10 km distances from the nesting sites (Hentati-Sundberg et al., 2018; Byholm et al., unpublished data), but the non-breeding birds move in a wider area, using temporary base locations for central-place foraging. After breeding, part of the local population may stay near the colonies, while others leave the colony and perform central-place foraging elsewhere (Byholm et al., unpublished data).
In migration periods, the subspecies P. carbo carbo, breeding in e.g. Finnmark and NW-Russia, is quite numerous proportionally, especially in the Gulf of Bothnia (Rusanen et al., 2012), but in this study only the local populations were considered.
The food consumption was estimated separately for different periods of year and different cormorant sub-populations, with the probability distributions of input-variables based on Ridgway (2010) with uncertainty of ± 10%; HALIAS,2021 and birdwatchers’ observations (Table 3). The resulting estimate of the probability distribution of total food consumption per nest was used in the perch mortality model. The daily consumption of 0.436 kg d–1 bird–1 was considered most likely for April, May, June, and August, but for nesting birds it was assumed higher in July (0.542 kg d–1 bird–1), because the feeding of chicks demands more energy (Ridgway, 2010). The most likely consumption by chicks in July was estimated at 0.327 kg d–1 bird–1 (Ridgway, 2010). The number of non-breeding 1–2 years old subadults was assumed at 33–40% of the population excluding chicks (Lehikoinen, 2003; A. Lehikoinen and Finnish Environment Institute, unpublished data from 2019), according to monitoring of spring migration in Hanko, western Gulf of Finland in 2002 and 2019. The young birds arrive later than the breeding birds (Lehikoinen, 2003; A. Lehikoinen, pers. comm.), thus the proportion of non-breeding birds was estimated to be most likely 25% in April. The number of surviving chicks was estimated at two per nest by Lehikoinen (2003), but here we used values 1.5–2 (Table 3), as irregularly some of the colonies were illegally disturbed and many colonies were harassed by white-tailed eagles (Haliaeetus albicilla).
Cormorant predation mortality on perch
Based on the food consumption of the cormorant population (Table 3), the share of perch in the cormorant diet (Salmi et al., 2013, 2015), the proportion of the perch sub-population targeted by fisheries (in practice females; Table 4), and mean weight of perch in cormorants’ diet (Salmi et al., 2015), the number of perch (belonging to the subpopulation targeted by fisheries) consumed annually was calculated. The number of perch in the age groups vulnerable to predation (∑Ny) was calculated as K*∑Nf. The proportion of the number of perch annually consumed by cormorants of ∑Nyis an estimate of the annual proportional mortality caused by cormorants.
Results
The estimated annual consumption of perch by cormorants was highest in the Bothnian Sea and Quark, the 80% probability interval ranging from about 500 to nearly 1000 tonnes, and lowest in the Archipelago Sea (200–500 tonnes; Table 5), due to the low abundance of cormorants (Figure 2). About half of the perch consumed belonged to the perch subpopulation targeted by fisheries (mainly females), and in numbers this yields about 7 million individuals in the Bothnian Sea and Quark, 6 million in the Gulf of Finland, and 4 million in the Archipelago Sea.
Cormorant consumption results from RISK-analysis; median outputs with 80% likelihood range, from 10 to 90% percentile. More detailed results in Supplement 4.
| Sea area | Total fish consumption by cormorants (tonnes year–1) | Total perch consumption (tonnes year–1) | Number of perch consumed annually (millions, fishing-targeted subpopulation) | Proportion (%) consumed of 2–5-year-old perch annually (fishing-targeted subpopulation) |
|---|---|---|---|---|
| Archipelago Sea | 1 206 (954–1 475) | 355 (249–492) | 3.78 (2.59–5.34) | 4.4 (2.4–8.2) |
| Bothnian Sea and Quark | 2 329 (1 845–2 844) | 685 (485–949) | 7.24 (5.02–10.33) | 5.6 (2.8–11.7) |
| Rectangle 55H1 (Quark) | 612 (449–776) | 178 (121–255) | 1.89 (1.27–2.76) | 5.2 (2.6–11.0) |
| Gulf of Finland | 1 938 (1 542–2 368) | 571 (404–781) | 6.04 (4.20–8.58) | 9.6 (4.8–20.5) |
The number of perch of the fisheries-targeted subpopulation, in the sizes vulnerable to cormorant predation (and later expected to grow to catchable sizes for fisheries), was estimated at 86 million in the Archipelago Sea, 62 million in the Gulf of Finland, and 130 million in the Bothnian Sea and Quark. Thus, the median estimate of the annual mortality caused by cormorants in the perch size classes vulnerable to cormorant predation was highest in the Gulf of Finland (9.6%), less in the Bothnian Sea and Quark (5.6%), and lowest in the Archipelago Sea (4.4%; Table 5, Figure 4). In rectangle 55H1 in the Quark, the corresponding estimate was 5.2% (Supplement 3, Table 5, Figure 4). As the fishing mortality and other natural mortality were assumed to be identical in all areas, lower perch catches in the Gulf of Finland lead to a lower estimate of the population size, and consequently to higher estimate of cormorant-induced mortality.
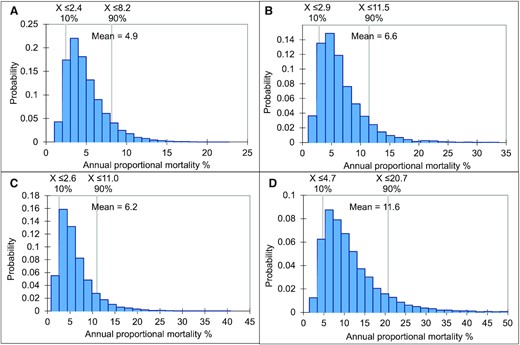
Probability distribution of the estimated annual proportional mortality (in the fishing-targeted perch subpopulation) caused by cormorants in (a) Archipelago Sea, (b) Bothnian Sea and Quark, (c) rectangle 55H1, and (d) Gulf of Finland, with 80% likelihood range (grey vertical lines).
Sensitivity analysis
Based on correlations (Table 6), the input-variables with variability strongly associated with the output variable, predation mortality, were the percentage of perch in the diet and the coefficient FC, fish consumption per cormorant nest, producing the whole season fish consumption of cormorants (Table 4). Also, the variability in fisheries catch input, mainly due to the recreational catch estimates, strongly affected the variability of mortality. Still the variable that most affected the variability of mortality was the coefficient K, the relationship of the number of perch at ages vulnerable to cormorant predation to the number of perch in the age groups recruited to fishery (not relevant in the Archipelago Sea). In the Archipelago Sea, the number of perch in the vulnerable age groups was directly based on stock assessment data.
| Variable | Gulf of Finland | Archipelago Sea | Bothnian Sea–Quark | Rectangle 55H1 |
|---|---|---|---|---|
| K | −0.68 | – | −0.71 | −0.75 |
| N of vulnerable perch | –0.80 | |||
| Recreational catch | −0.47 | – | −0.37 | |
| Commercial catch | – | −0.23 | ||
| Proportion of perch in the diet | 0.33 | 0.40 | 0.36 | 0.35 |
| Food consumption, whole season | 0.25 | 0.32 | 0.29 | 0.34 |
| Fishing mortality | 0.21 |
Discussion
We estimated the effect of cormorant predation on perch in the coastal waters of Finland by assessing the size of vulnerable perch sub-population and the proportion annually consumed by the local cormorant population, in the assumed equilibrium state. This proportion corresponds to annual percentage mortality caused by cormorants. The results represent the potential maximum effect by cormorants because they do not account for density-dependent compensatory mechanisms e.g. in predation and growth of perch. In all parts of the Finnish coast, the median mortality was below 10%, being lowest in the Archipelago Sea (4%), slightly higher in Bothnian Sea and Quark (6%), and highest in the Gulf of Finland (10%).
In the Quark (ICES rectangle 55H1), the annual mortality estimate at the cormorant abundance in 2018 was 5% (3–11%), and thus was near to the level of the whole Bothnian Sea–Quark area (median 6%, 80% likelihood range 3–12%). The corresponding median estimate for rectangle 55H1 from the tagging experiment in 2018 (Veneranta et al., 2020a) was higher (10%, LR 5–19%), although the probability distributions partly overlap.
According to sensitivity analysis, the variable that most affected the result was the coefficient K (the relationship of the number of perch at ages vulnerable to cormorant predation to the number of perch in the age groups recruited to fishery). The factor that affects this coefficient most strongly is the natural mortality in young age groups. In the Archipelago Sea, where the perch population estimate was based on a VPA assessment, the most important variable was the number of perch in the vulnerable age groups, but in the stock assessment this is also largely dependent on natural mortality. The natural mortality is size and density dependent and may exhibit large variation in nature (Rose et al., 2001; Houde, 2016). The estimates used here were based on Heibo et al. (2005) and Horppila et al. (2010), who studied unfished perch populations without cormorants at similar latitudes as the coastal areas of Finland. Too high natural mortality estimates would cause overestimation of the vulnerable perch stock and thus underestimation of the predation mortality. Too low estimates would cause overestimation of the predation mortality. In this study, except for the rectangle 55H1, the cormorant-induced mortality is partly included in the natural mortality estimate, if assumed to be additive to other mortality sources. The perch catches at least in the latter part of the time series originate from year classes that were exposed to abundant cormorant population at younger ages. Thus, the estimates of natural mortality used in our analysis might be underestimated in case of additive cormorant-induced mortality, as this was not accounted for.
A high value of K leads to high estimate of population size of perch at the ages vulnerable to cormorant predation, and consequently to low proportion consumed by cormorants. As practically all fishing methods are size selective, there is no exact measure for the relationship of the numbers of perch in the age groups preyed upon by cormorants vs. ages caught by fishing. The experimental gillnet fishing with Coastal Nordic gill nets (HELCOM, 2019) is less selective, but even with this method only the individuals larger than 12–14 cm in length are fully catchable. However, the relationship of the size groups in the experimental gillnet catch can give some information on the reliability of the values used in this study.
The minimum perch length in commercial catch in the Finnish coast is generally 23–25 cm, and smaller perch are discarded (Natural Resources Institute Finland, unpublished data). In the experimental gillnet catch in Brunskär, Archipelago Sea in 2002–2020 (Figure 5), the ratio of numbers of perch in length classes 12–22 cm vs. length classes ≥ 23 cm was 9.9 : 1 and that in length classes 12–24 cm vs. ≥ 25 cm 23.5 : 1. In the western part of the Gulf of Finland, in Tvärminne (2005–2020), which is largely a nature protection area, and therefore, fishing effort on the perch stock is low, the corresponding ratios were 7.0:1 and 13.5:1, respectively (unpublished data shown in Supplement 1, source Koekalastusrekisteri (2021; Experimental gillnet fishing register, Standardized Coastal Nordic survey gillnets)). The inter-annual variation in this ratio was large in both areas, due to year class fluctuation of perch (Kokkonen et al., 2019). The proportion of male perch in the length classes below 23–25 cm was 30–29%, which part of population was assumed not to belong to the subpopulation targeted by fishing and should therefore be subtracted from the ratios mentioned above. On the other hand, perch smaller than 12 cm are not included in these estimates but belong to the size class taken by cormorants, starting from about 7 cm (Salmi et al., 2015), and therefore, the ratios above underestimate the subpopulation vulnerable to cormorants. We conclude that the estimate for the corresponding coefficient K in our calculation, triangle distribution (3; 8; 23), fits well to the perch lengths in the experimental gill net catches, and can even be considered rather cautious than overestimated. The same conclusion is valid for the estimated level of natural mortality used in the analysis.
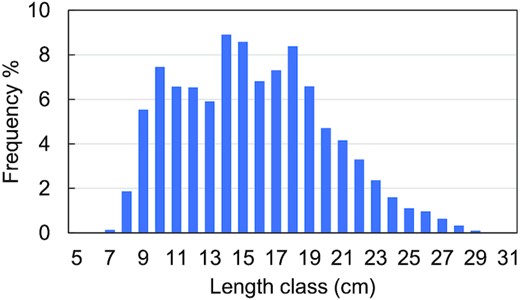
Length distribution of perch in the experimental multimesh gillnet catches in Brunskär, Korppoo, Archipelago Sea in 2002–2020. Mesh sizes 10–60 mm (bar length).
Another largely uncertain variable here is the recreational fisheries catch, based on questionnaires every 2 years. However, the methods have been developed to increase the reliability, especially since the beginning of the 2000s (Moilanen, 2001). Perch is common as a target species, and therefore, the catch estimates are based on a larger proportion of non-zero reported catch compared to most other species. The CVs (coefficients of variation) have not been reported during the period studied here, but based on earlier questionnaires in the same area, the CV has been about ± 20–30%. There is large interannual variation in the catches, and the observed range was assumed to cover the real range of variation. In 1998, the fishing license system was relieved, and the number of rod fishers from other parts of Finland started to increase in the coastal areas. In the questionnaire, the catches of visiting fishers are allocated to their main fishing areas, which can be in inland waters. This probably causes some bias in the coastal catch estimates since 1998 or beginning of the 2000s (Heikinheimo et al., 2014). However, there is no data to assess how much this could affect the catch estimates, but some underestimation is probable. This bias would cause overestimation of the cormorant-induced mortality.
Our results are in accordance with Lehikoinen et al. (2017), who stated that the cormorant abundance did not explain trends in the catches per unit of effort (CPUEs) in commercial perch gillnet fishing in the Finnish coast. This is understandable, because annual percentage cormorant effect largely below 10% will probably be masked by other factors contributing to the fluctuations of the perch stock (Östman et al., 2012; Cowx, 2013; Marzano et al., 2013), with reproduction success affected by summer temperatures being the most important one (Kokkonen et al., 2019). Also, the mortality level estimated here corresponds to the cormorant-induced mortality of young pikeperch in the Archipelago Sea (Heikinheimo et al., 2016).
In lakes or other closed waters, density-dependence of perch growth is common (Horppila et al., 2010). In coastal areas the suitable habitats for perch may be limited, too, as perch favour shallow and sheltered areas and avoid crossing open water areas (Böhling and Lehtonen, 1984; Veneranta et al., 2020b). Other species, such as cyprinids and pikeperch (S. lucioperca) utilize the same habitats with perch and might compete for same food resources (Kallasvuo et al., 2016). According to Olin and Veneranta (2020) the areal differences in perch growth rates in the Quark may indicate negative density-dependence. Also, the growth rate of perch in the Quark was not enhanced compared to the 1980s despite higher temperatures, probably because of higher density (Olin and Veneranta, 2020).
The estimated proportional mortality caused by cormorants in the rectangle 55H1, based on the PIT tagging experiment by Veneranta et al. (2020a), was essentially higher compared to our results. There may be several causes to this difference. For instance, the deposition probability of the tags to colonies was based on literature, and if underestimated, the predation rate would be overestimated. Second, the tag returns were from the cormorant breeding colonies, but an equal rate in consumption of tagged perch by non-breeding individuals and after breeding time was assumed, which formed about half of the estimate of total proportional cormorant-induced mortality (Veneranta et al., 2020a). Recent tagging of cormorants with data loggers in the Gulf of Finland (14 individuals) and in the Quark (three individuals) in 2019 (Byholm et al., unpublished data) revealed that the non-breeding individuals largely dwell in different areas than the breeding birds, and also many of the birds leave the colonies after breeding and do not feed in the vicinity of them anymore. This could have caused an overestimation of the local cormorant-induced mortality and alone explain the clearly higher mortality estimate by Veneranta et al. (2020a) compared to this study. Also, the rectangle-based mortality estimate was sensitive to the assumed effective predation area of the cormorants within the rectangle 55H1.
The cormorant-induced mortalities estimated in this study must be considered potential maximum values, because compensatory density-dependent processes could not be accounted for. However, density-dependence is of crucial importance in understanding the dynamics of predator-prey systems (Dekker and De Leeuw, 2003). For instance, as the functional response of predators to prey density was not included, the perch proportion in cormorant diet was implicitly assumed constant, but in reality, it depends on the density of the prey and availability of other prey species, too. A generalist predator can shift from one prey species to another depending on the abundance and availability of the given prey (Murdoch, 1969) as well as move to another area with higher prey density. Consequently, predation mortality, and other natural mortality of perch is most probably at highest in a dense population. In general, the effect of all compensatory processes is emphasized at high population densities of the prey (Rose et al., 2001).
It is uncertain to which extent the mortality caused by cormorants is additive to other natural mortality. Generally, predators tend to take prey individuals that have high probability of mortality in the first place (Hilborn and Walters, 1992). For instance, slow-growing perch are a longer time vulnerable to predators, and thus the natural mortality is expectedly higher than that of the fast-growing part of the population.
According to our results, the cormorant-induced mortality was in all cases much lower than the literature-based estimate of other natural mortality. This is in accordance with the fact that in the coastal waters of Finland the food consumption of predator fish populations, such as pike or pikeperch, is even three to fourfold compared to that of the cormorant population (Heikinheimo et al., 2018). The higher estimates of cormorant-induced mortality in the Gulf of Finland compared to other areas may be a consequence of the lower perch catches due to likely lower but presently unknown fishing mortality. The fishing mortality estimates from the Archipelago Sea were used there, but the situation in the Gulf of Finland may be different because of low effort by commercial fishery. In the vicinity of urban areas, the numbers of recreational fishers are probably high, but as a whole the fishing mortality of perch may be smaller in the Gulf of Finland than in the Archipelago Sea, which may have caused underestimation of the perch population size.
In conclusion, our results indicate that the cormorant-induced mortality of perch in the coast of Finland is low, and other natural mortality is most probably higher than that. The predation effect of cormorants can hardly be distinguished from other fluctuations in perch catches at the spatial level of statistical rectangles or sea areas. The impact of cormorant predation on a given fish species is most probably small where food webs are diverse with abundant prey species (Cowx, 2013), which is the case in the coastal waters studied here. Veneranta et al. (2020a) suggested that the cormorant effect on perch catches could be high in the vicinity of cormorant colonies, presumed that perch populations are rather strictly local. However, the cormorants can utilize wide areas for feeding and shift between prey species and feeding areas (Byholm et al., unpublished data), in case that considerable decline in perch density would occur. This does not exclude potential disturbance by cormorants on fishing gear and catches, which may be harmful to commercial fishery especially near to the colonies or during migration.
Data availability statement
The data that support the findings of this study are available in the tables and in the Supplementary material of this article, based on the referred web sites.
ACKNOWLEDGEMENTS
We wish to thank the numerous observers who have participated in gathering data on breeding colonies of cormorants in the coastal areas of Finland.
