


1-20 of 22433

Image
Distribution of the number of patients by sex and 5-year age group in the H... Get access
in
International Journal of Epidemiology
>
Data Resource Profile: Health Insurance Review and Assessment Service Covid-19 Observational Medical Outcomes Partnership (HIRA Covid-19 OMOP) database in South Korea
Published: 24 April 2024
Figure 2.
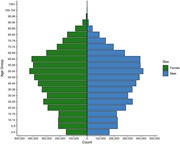
Distribution of the number of patients by sex and 5-year age group in the HIRA Covid-19 OMOP database. The left green bar indicates the number of females and the right blue bar indicates the number of males. Each bar denotes the age group by 5 years, and the age group was determined based on the mid
Journal Article
Data Resource Profile: Health Insurance Review and Assessment Service Covid-19 Observational Medical Outcomes Partnership (HIRA Covid-19 OMOP) database in South Korea Get access
International Journal of Epidemiology, Volume 53, Issue 3, June 2024, dyae062, https://doi.org/10.1093/ije/dyae062
Published: 24 April 2024
Image
Configuration of source data to develop the HIRA Covid-19 OMOP database. In... Get access
in
International Journal of Epidemiology
>
Data Resource Profile: Health Insurance Review and Assessment Service Covid-19 Observational Medical Outcomes Partnership (HIRA Covid-19 OMOP) database in South Korea
Published: 24 April 2024
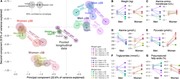
Figure 1.
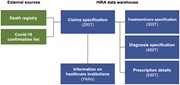
Configuration of source data to develop the HIRA Covid-19 OMOP database. In the HIRA Covid-19 OMOP database, HIRA claims data were linked with the national death registries and Covid-19 confirmation lists. HIRA, Health Insurance Review and Assessment Service; Covid-19, coronavirus infectious disease
Image
Study overview. (A) Flow diagram for study population. Eligible participant... Get access
in
International Journal of Epidemiology
>
Factor modification in the association between high-density lipoprotein cholesterol and liver cancer risk in a nationwide cohort
Published: 19 April 2024
Figure 1.
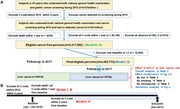
Study overview. (A) Flow diagram for study population. Eligible participants underwent national gastric cancer screening and a general health examination from January to December 2010. (B) Sensitivity analysis model for effects of exposure duration. C-code, cancer code of the International Classific
Image
Sensitivity analysis in various models. (A) Adjusted analysis for many vari... Get access
in
International Journal of Epidemiology
>
Factor modification in the association between high-density lipoprotein cholesterol and liver cancer risk in a nationwide cohort
Published: 19 April 2024
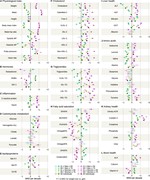
Figure 2.
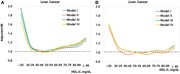
Sensitivity analysis in various models. (A) Adjusted analysis for many variables excluding non-alcoholic fatty liver disease. (B) Adjusted analysis for many variables including non-alcoholic fatty liver disease. Model I and Model III: adjusted hazard ratio (HR) after exclusion of any cancer develope
Image
Adjusted spline curves in the association between HDL-C and liver cancer ri... Get access
in
International Journal of Epidemiology
>
Factor modification in the association between high-density lipoprotein cholesterol and liver cancer risk in a nationwide cohort
Published: 19 April 2024
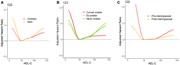
Figure 3.
Adjusted spline curves in the association between HDL-C and liver cancer risk. Adjusted spline curves by sex (A), smoking status (B) and menopausal status (C). Hazard ratios were derived from the adjusted competing risk model. C22, liver cancer; HDL-C, high-density lipoprotein cholesterol
Image
Subgroup analysis in the association between HDL-C and liver cancer risk. S... Get access
in
International Journal of Epidemiology
>
Factor modification in the association between high-density lipoprotein cholesterol and liver cancer risk in a nationwide cohort
Published: 19 April 2024
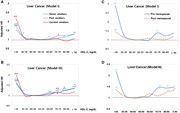
Figure 4.
Subgroup analysis in the association between HDL-C and liver cancer risk. Subgroup analysis by smoking status in Model I (A) and Model III (B). Subgroup analysis by menopausal status in Model I (C) and Model III (D). Adjusted variables, exact adjusted hazard ratio (aHR) and confidence intervals are
Image
Ensemble of associations between temperature, lag and mortality derived fro...
in
International Journal of Epidemiology
>
Spatial Bayesian distributed lag non-linear models (SB-DLNM) for small-area exposure-lag-response epidemiological modelling
Published: 19 April 2024
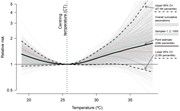
Figure 1.
Ensemble of associations between temperature, lag and mortality derived from a Bayesian distributed lag non-linear model (B-DLNM). The results are based on the spatial Bayesian DLNM (SB-DLNM) with the case-crossover design (Model 3) in the el Raval neighbourhood (2007–2016). Each row corresponds to
Image
Spatial distribution of heat-related mortality risks in Barcelona (2007–201...
in
International Journal of Epidemiology
>
Spatial Bayesian distributed lag non-linear models (SB-DLNM) for small-area exposure-lag-response epidemiological modelling
Published: 19 April 2024
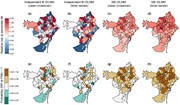
Figure 4.
Spatial distribution of heat-related mortality risks in Barcelona (2007–2016) for independent Bayesian distributed lag non-linear model (B-DLNM) and spatial Bayesian distributed lag non-linear model (SB-DLNM). The top row (a–d) shows the point estimates of the relative risk (RR) of death at the 99th
Image
Metabolic changes in the weight loss and gain subgroups stratified by age a...
in
International Journal of Epidemiology
>
Influence of age and sex on longitudinal metabolic profiles and body weight trajectories in the UK Biobank
Published: 19 April 2024
Figure 3.
Metabolic changes in the weight loss and gain subgroups stratified by age and sex. Median rates per decade and 95% confidence intervals are illustrated. Filled vs open symbols are indicative of P <0.0001 for divergence from zero change (please see the legend below Plot H). BP, blood pressure; S
Image
Summary of metabolic changes by subgroup stratified by age and sex. Open an...
in
International Journal of Epidemiology
>
Influence of age and sex on longitudinal metabolic profiles and body weight trajectories in the UK Biobank
Published: 19 April 2024
Figure 4.
Summary of metabolic changes by subgroup stratified by age and sex. Open and filled symbols indicate the baseline and follow-up visits, respectively. (A) The principal components were calculated from those UK Biobank participants with full metabolic data available (training set, n = 227 272) but w
Journal Article
Factor modification in the association between high-density lipoprotein cholesterol and liver cancer risk in a nationwide cohort Get access
International Journal of Epidemiology, Volume 53, Issue 3, June 2024, dyae053, https://doi.org/10.1093/ije/dyae053
Published: 19 April 2024
Journal Article
Spatial Bayesian distributed lag non-linear models (SB-DLNM) for small-area exposure-lag-response epidemiological modelling
International Journal of Epidemiology, Volume 53, Issue 3, June 2024, dyae061, https://doi.org/10.1093/ije/dyae061
Published: 19 April 2024
Image
Metabolic changes in the stable weight subgroup stratified by age and sex. ...
in
International Journal of Epidemiology
>
Influence of age and sex on longitudinal metabolic profiles and body weight trajectories in the UK Biobank
Published: 19 April 2024
Figure 2.
Metabolic changes in the stable weight subgroup stratified by age and sex. Median rates per decade and 95% confidence intervals are illustrated. Filled vs open symbols are indicative of P < 0.0001 for divergence from zero change (please see the legend below Plot H). BP, blood pressure; SHBG, se
Journal Article
Influence of age and sex on longitudinal metabolic profiles and body weight trajectories in the UK Biobank
International Journal of Epidemiology, Volume 53, Issue 3, June 2024, dyae055, https://doi.org/10.1093/ije/dyae055
Published: 19 April 2024
Image
Summary estimates of relative risks derived from a Bayesian distributed lag...
in
International Journal of Epidemiology
>
Spatial Bayesian distributed lag non-linear models (SB-DLNM) for small-area exposure-lag-response epidemiological modelling
Published: 19 April 2024
Figure 2.
Summary estimates of relative risks derived from a Bayesian distributed lag non-linear model (B-DLNM). The results are based on the spatial Bayesian DLNM (SB-DLNM) with the case-crossover design (Model 3) in the el Raval neighbourhood (2007–2016). The point estimates and confidence intervals (CrI) o
Image
Overall cumulative temperature-mortality associations in three adjacent nei...
in
International Journal of Epidemiology
>
Spatial Bayesian distributed lag non-linear models (SB-DLNM) for small-area exposure-lag-response epidemiological modelling
Published: 19 April 2024
Figure 3.
Overall cumulative temperature-mortality associations in three adjacent neighbourhoods of Barcelona (2007–2016) for independent Bayesian distributed lag non-linear model (B-DLNM) and spatial Bayesian distributed lag non-linear model (SB-DLNM). We selected three adjacent neighbourhoods with high (a,
Image
Participant selection and classification. (A) Flow chart of study design. W...
in
International Journal of Epidemiology
>
Influence of age and sex on longitudinal metabolic profiles and body weight trajectories in the UK Biobank
Published: 19 April 2024
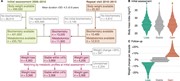
Figure 1.
Participant selection and classification. (A) Flow chart of study design. Weight change was reported as percent per decade to equalize the effect from differing duration between assessments. The primary selection criterion was based on the proportional change in body weight: we use a strict definiti
Journal Article
Long-term exposure to ambient air pollution and risk of microvascular complications among patients with type 2 diabetes: a prospective study Get access
International Journal of Epidemiology, Volume 53, Issue 3, June 2024, dyae056, https://doi.org/10.1093/ije/dyae056
Published: 17 April 2024
Image
Overall association of the air pollutant mixture with diabetic microvascula... Get access
in
International Journal of Epidemiology
>
Long-term exposure to ambient air pollution and risk of microvascular complications among patients with type 2 diabetes: a prospective study
Published: 17 April 2024
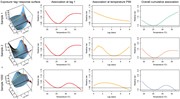
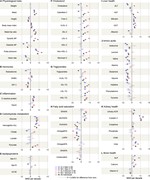
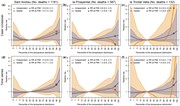
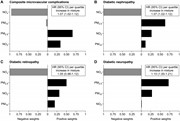
Figure 1.
Overall association of the air pollutant mixture with diabetic microvascular complications and the relative contribution of each air pollutant. Hazard ratios (HRs) for composite microvascular complications (A), diabetic nephropathy (B), diabetic retinopathy (C) and diabetic neuropathy (D) were estim
