


Abstract
Background: Studies on advanced maternal age—defined here as age 35 or older—and children’s cognitive ability report mixed evidence. Previous studies have not analysed how the time period considered in existing studies influences the association.
Methods: We analysed trends in the association between maternal age and cognitive ability using data from the 1958 National Child Development Study (n = 10 969), the 1970 British Cohort Study (n = 9362) and the 2000–2002 Millennium Cohort Study (n = 11 600). The dependent variable measures cognitive ability at age 10/11 years. Cognitive scores were standardised to a mean of zero and a standard deviation of one.
Results: For the 1958–70 cohort studies, maternal ages 35 –39 were negatively associated with children's cognitive ability compared with maternal ages 25–29 (1958 cohort β = −0.06 standard deviations (SD) 95% confidence interval (CI): −0.13, −0.00; 1970 cohort β = −0.12 SD 95% CI: −0.20, −0.03). By contrast, for the 2000–2002 cohort study maternal ages 35–39 were positively associated with cognitive ability (β = 0.16 SD 95% CI: 0.09, 0.23). For maternal ages 40+, the pattern was qualitatively similar. These cross-cohort differences were explained by the fact that in the earlier cohorts advanced maternal age was associated with high parity, whereas in the 2000–2002 cohort it was associated with socioeconomically advantaged family background.
Conclusions: The association between advanced maternal age and children’s cognitive ability changed from negative in the 1958 and 1970 cohorts to positive in the 2000–2002 cohort because of changing parental characteristics. The time period considered can constitute an important factor in determining the association between maternal age and cognitive ability.
Introduction
Since the 1980s there has been a marked increase in the mean age at first birth across industrialised countries.1,2 The consequences of this demographic trend for the well-being of children are poorly understood. Whereas there is a wealth of evidence showing a negative association between advanced maternal age, defined here as giving birth at ages 35 and above,3 and child health around the time of birth,4–6 research on child well-being beyond infancy is less consistent.7 In particular, evidence on the association between maternal age and children’s cognitive ability is mixed. Some studies, before adjustment for parental characteristics, have documented a positive association between advanced maternal age and children’s cognitive ability,8–10 whereas others found a negative association.11–14 Cognitive ability in childhood is an important predictor of important outcomes measured later in life, such as educational attainment, occupation and health.15–18 Thus, it is essential to gain a better understanding of how children’s cognitive ability is associated with advanced maternal age.
The mixed picture on maternal age and cognitive ability may be partially attributed to the fact that existing studies have analysed the association in different time periods. We hypothesise that the period considered could represent an important source of variation across studies, since the characteristics of older mothers have changed markedly over time. In the past, families in which children were born to older mothers tended to have larger numbers of children and were poorer than the average; whereas today these families tend to have smaller numbers of children and are socioeconomically more advantaged than the average, often because parents invest in education and become established in professional occupation before having children.8,19 Consequently, the association between advanced maternal age and children’s cognitive ability might have changed over time.
To the best of our knowledge, this is the first study to investigate the question of whether the association between advanced maternal age and children’s cognitive ability has changed over time within the same context. To analyse this question, we used data from three large and representative UK birth cohort studies from 1958, 1970 and 2000–02.
Methods
Sample description
We used data from three UK birth cohort studies. For each cohort, maternal age and socio-demographic characteristics were collected from the birth survey. Information on children’s cognitive ability was collected from the age 10/11 survey.
The 1958 National Child Development Study (NCDS) is a longitudinal cohort study that followed 17 416 children born in England, Scotland or Wales during 1 week in March 1958. We use data from the birth survey (response rate 99%) and from the age 11 survey (response rate 88%).
The 1970 British Cohort Study (BCS) is a longitudinal cohort study that followed 16 571 children born in England, Scotland or Wales during 1 week in April 1970. We use data from the birth survey (response rate 96%) and the age 10 survey (response rate 87%).
The Millennium Cohort Study (MCS) is a longitudinal cohort study that followed 19 244 children born in England, Scotland, Wales or Northern Ireland in a period of time that included September 2000 and January 2002. The sample was selected from a random sample of electoral wards, using a stratified sampling strategy to ensure the representation of all four of the UK countries and of disadvantaged and ethnically diverse areas. We used weights to account for the complex sampling design and non-response and overrepresentation of disadvantaged and ethnically diverse areas. In the analyses, we used data from Sweep 1 (response rate 82%), which were collected when the children were around 9 months old, and from Sweep 5, which were collected when the children were around 11 years old (response rate 72%).20 We refer to the MCS as the 2001 cohort study, since the majority of births in the sample occurred in 2001.
Variables
The dependent variable was a measure of verbal cognitive ability collected when the children were 10/11 years old. In the 1958 NCDS cohort study, verbal cognition was assessed based on the verbal score of the General Ability Test (National Foundation for Educational Research).21 Children were tested individually by teachers. In the 1970 cohort study, verbal cognition was assessed by a teacher using the Word Similarity subscale of the British Ability Scales.22 In the 2001 cohort study, verbal cognition was assessed by the interviewer using the Verbal Similarity subscale from the British Ability Scale (second edition).23 For the 1970 and the 2001 cohort studies, we used scores that were standardised based on a normed pool of scores within 3-month age ranges (which are not available for the 1958 cohort study). We used tests of cognitive ability that are comparable across cohorts, as they all measure verbal ability and were collected at similar ages. However, since different tests were administered in each cohort, we have standardised them, within each study, to a mean of zero and a standard deviation of one.
The key independent variable was maternal age at the birth of the cohort child, categorised as <20, 20–24, 25–29, 30–34, 35–39 and 40+ years. We set 25–29 as the reference category since it was the largest one in the 1958 and 2001 cohorts and the second largest in the 1970 cohort study. The other independent variables were a set of child and family characteristics collected during the first survey of each cohort study.
We adjusted for the sex of the cohort child and for whether the child was a multiple birth. We also adjusted for birth order, i.e. the numerical order of the live birth (categories: first, second, third or higher).24–26 We adjusted for the mother’s education (categories 1958/1970 cohorts: whether the mother stayed in education until the minimum age; categories 2001 cohort study: whether the mother had degree-level education), and for the father’s (1958/1970 cohorts) or the family’s social class (2001 cohort, the highest in the household) based on the Registrar General Social Class (categories in all cohorts: professional occupation, managerial and technical occupations, skilled non-manual occupations, skilled manual occupations, partly skilled occupations, unskilled occupations). We adjusted for the mother’s marital status at birth (categories 1958 cohort: married or single; categories 2001 cohort: married, cohabiting or single) or at conception (categories 1970 cohort: married or single), whether the mother smoked during pregnancy (binary indicator), whether the mother used antenatal care after 12 weeks of pregnancy (binary indicator), the mother’s height (continuous) and whether the mother breastfed the cohort child for any duration (binary indicator).
Inclusion criteria and exclusions
We dropped observations with missing values on maternal age, on cognitive scores or on any of the covariates measured around the time of the cohort child’s birth. In families with multiple births in the MCS, we randomly selected one child (166 cases in the analytical sample). These exclusions reduced the 1958 cohort sample to 10 969 (out of 13 951 cases in the age 11 survey), the 1970 cohort sample to 9362 (out of 14 350 cases in the age 10 survey) and the 2001 cohort sample to 11 600 observations (out of 13 287 cases in the age 11 survey).
Statistical models
We estimated three linear regression models for each cohort study. Model 1 is the unadjusted association between maternal age and child cognitive ability and includes adjustment only for the child’s sex and for whether the child is a twin. Model 2 includes adjustment for the child’s sex, for whether the child is a twin and for the child’s birth order–because a high order/parity birth is associated with worse cognitive ability and it is also a correlated with large family size and lower socioeconomic position of the family.24–26
Model 3 is the fully adjusted model and includes all adjustment variables. We adjusted for family characteristics, described in the variable section, that might help to explain the association between maternal age and cognitive ability because they reflect maternal/family socio-demographic characteristics and health behaviours during/after pregnancy, and because they are associated with children’s cognitive ability.15,16,27,28 To test whether the association between advanced maternal age and cognition varied across cohorts, we pooled the cohorts and estimated a model with interactions between cohort and each regressor (for details see Appendix, available as Supplementary data at IJE online). All analyses were conducted in Stata/SE version 14.
Results
Descriptive analyses
The 1958 and 1970 cohorts show an inverted U-shaped association between maternal age and children’s cognitive ability, with the children of mothers aged 25–29 displaying the best outcomes (Tables 1 and 2). The 2001 cohort shows a positive association between maternal age and children’s cognitive ability, with the children of mothers aged 35–39 displaying the best outcomes (Table 3).
Child and Family Characteristics by Maternal Age, 1958 Cohort Study
| Maternal age at birth of cohort child | ||||||||
|---|---|---|---|---|---|---|---|---|
| Under 20 | 20–24 | 25–29 | 30–34 | 35–39 | 40 and over | Total | P-value | |
| Dependent variable | ||||||||
| Cohort child cognitive ability z-score (mean) | −0.252 | −0.067 | 0.061 | 0.059 | −0.003 | −0.048 | 0.000 | <0.01 |
| Cohort child cognitive ability z-score (SD) | 1.007 | 0.986 | 0.984 | 1.013 | 1.015 | 1.065 | 1.000 | |
| Cohort child characteristics | ||||||||
| Birth order (%) | ||||||||
| First order birth | 87.5 | 57.2 | 34.2 | 18.4 | 11.2 | 8.7 | 36.9 | <0.01 |
| Second order birth | 12.2 | 31.2 | 37.1 | 31.2 | 20.9 | 15.6 | 30.7 | <0.01 |
| Third or higher order birth | 0.4 | 11.6 | 28.7 | 50.5 | 67.9 | 75.6 | 32.4 | <0.01 |
| Girl (%) | 48.4 | 48.3 | 49.0 | 49.1 | 49.1 | 51.6 | 48.9 | 0.92 |
| Multiple birth (%) | 0.4 | 0.9 | 1.1 | 1.6 | 1.7 | 0.4 | 1.2 | 0.02 |
| Mother/family characteristics | ||||||||
| Mother at school until minimum age (%) | 13.6 | 22.7 | 28.3 | 27.1 | 23.8 | 27.3 | 25.2 | <0.01 |
| Mother married at birth (%) | 87.9 | 96.5 | 98.4 | 97.8 | 97.9 | 97.5 | 97.1 | <0.01 |
| Father low social class (%) | 12.2 | 10.0 | 8.0 | 8.0 | 7.9 | 9.5 | 8.8 | <0.01 |
| Father high social class (%) | 0.6 | 2.1 | 5.2 | 5.4 | 3.5 | 4.0 | 3.9 | <0.01 |
| Mother smoked during pregnancy (%) | 33.5 | 31.6 | 32.0 | 34.8 | 33.8 | 26.9 | 32.6 | 0.03 |
| Mother used antenatal care after 1st trimester (%) | 83.6 | 79.5 | 75.7 | 79.5 | 80.6 | 86.2 | 78.8 | <0.01 |
| Mother’s height (mean, cm) | 160.0 | 160.9 | 161.3 | 161.3 | 161.0 | 160.5 | 161.1 | <0.01 |
| Mother breastfed cohort child (%) | 75.5 | 73.0 | 70.5 | 65.1 | 62.0 | 62.9 | 69.2 | <0.01 |
| % of observations | 5.0 | 27.9 | 33.2 | 20.9 | 10.6 | 2.5 | 100.0 | |
| Number of observations | 543 | 3,060 | 3,640 | 2,291 | 1,160 | 275 | 10,969 | |
Note: Maternal age: mean 27.6; sd 5.6; skewness 0.5. P-value (for test of uniform distribution across maternal age categories) from a chi-square test for all variables except mother’s height, for which the P-value was obtained by testing the age coefficients jointly in a linear regression (null hypothesis: all age coefficients are zero).
Child and Family Characteristics by Maternal Age, 1970 Cohort Study
| Under 20 | 20–24 | 25–29 | 30–34 | 35–39 | 40 and over | Total | P-value | |
|---|---|---|---|---|---|---|---|---|
| Dependent variable | ||||||||
| Cohort child cognitive ability z-score (mean) | −0.250 | −0.049 | 0.100 | 0.054 | −0.019 | 0.022 | 0.000 | <0.01 |
| Cohort child cognitive ability z-score (SD) | 0.988 | 1.000 | 0.968 | 1.018 | 1.046 | 1.036 | 1.000 | |
| Cohort child characteristics | ||||||||
| Birth order (%) | ||||||||
| First order birth | 83.1 | 51.4 | 28.7 | 13.1 | 11.8 | 13.0 | 38.0 | <0.01 |
| Second order birth | 15.5 | 35.8 | 41.9 | 31.5 | 19.0 | 14.3 | 33.9 | <0.01 |
| Third or higher order birth | 1.4 | 12.9 | 29.5 | 55.4 | 69.2 | 72.7 | 28.1 | <0.01 |
| Girl (%) | 46.6 | 48.6 | 48.6 | 48.9 | 51.0 | 46.0 | 48.6 | 0.68 |
| Multiple birth (%) | 0.6 | 0.8 | 1.2 | 1.3 | 1.6 | 1.2 | 1.1 | 0.25 |
| Mother/family characteristics | ||||||||
| Mother at school until minimum age (%) | 26.4 | 30.6 | 40.3 | 34.7 | 34.4 | 38.5 | 34.3 | <0.01 |
| Mother married at conception (%) | 52.7 | 90.0 | 98.4 | 99.0 | 98.9 | 98.8 | 91.5 | <0.01 |
| Father low social class (%) | 12.4 | 6.2 | 3.6 | 5.4 | 5.4 | 7.5 | 5.8 | <0.01 |
| Father high social class (%) | 1.1 | 2.8 | 6.6 | 7.3 | 4.1 | 5.0 | 4.7 | <0.01 |
| Mother smoked during pregnancy (%) | 48.2 | 44.8 | 37.7 | 35.4 | 37.4 | 46.0 | 40.9 | <0.01 |
| Mother used antenatal care after 1st trimester (%) | 64.4 | 46.4 | 40.3 | 45.3 | 45.8 | 54.0 | 46.0 | <0.01 |
| Mother’s height (mean, cm) | 159.9 | 160.8 | 161.5 | 161.5 | 160.9 | 160.7 | 161.1 | <0.01 |
| Mother breastfed cohort child (%) | 32.0 | 35.0 | 38.9 | 37.1 | 38.3 | 41.6 | 36.6 | <0.01 |
| % of observations | 8.7 | 36.5 | 31.8 | 15.4 | 6.0 | 1.7 | 100.0 | |
| Number of observations | 812 | 3,412 | 2,980 | 1,438 | 559 | 161 | 9,362 | |
Note: Maternal age: mean 26; sd 6; skewness 0.7. P-value (for test of uniform distribution across maternal age categories) from a chi-square test for all variables except mother’s height, for which the P-value was obtained by testing the age coefficients jointly in a linear regression (null hypothesis: all age coefficients are zero).
Child and Family Characteristics by Maternal Age, 2001 Cohort Study
| Under 20 | 20–24 | 25–29 | 30–34 | 35–39 | 40 and over | Total | P-value | |
|---|---|---|---|---|---|---|---|---|
| Dependent variable | ||||||||
| Cohort child cognitive ability z-score (mean) | −0.269 | −0.223 | 0.018 | 0.122 | 0.179 | 0.104 | 0.000 | <0.01 |
| Cohort child cognitive ability z-score (SD) | 0.850 | 0.985 | 0.974 | 1.015 | 1.015 | 1.140 | 1.000 | |
| Cohort child characteristics | ||||||||
| Birth order (%) | ||||||||
| First order birth | 87.64 | 49.53 | 42.49 | 32.21 | 25.75 | 18.04 | 42.4 | <0.01 |
| Second order birth | 11.61 | 38.59 | 36.44 | 39.99 | 35.82 | 33.65 | 35.35 | <0.01 |
| Third or higher order birth | 0.88 | 12.11 | 21.34 | 28.12 | 38.43 | 48.31 | 22.47 | <0.01 |
| Girl (%) | 47.61 | 49.77 | 47.64 | 50.33 | 49.36 | 46.68 | 49 | 0.50 |
| Multiple birth (%) | 0.44 | 1.24 | 1.26 | 1.72 | 2.0 | 2.1 | 1.43 | 0.12 |
| Mother/family characteristics | ||||||||
| Mother degree level qualification (%) | 1.81 | 10.07 | 30.15 | 42.21 | 46.19 | 46.66 | 29.72 | <0.01 |
| Mother married at birth (%) | 7.67 | 30.56 | 60.97 | 74.14 | 72.87 | 67.2 | 55.87 | <0.01 |
| Mother cohabiting at birth (%) | 38.95 | 39.3 | 26.33 | 17.86 | 18.16 | 20 | 26.25 | <0.01 |
| Household low social class (%) | 5.36 | 3.74 | 2.11 | 1.08 | 1.58 | 1.03 | 2.33 | <0.01 |
| Household high social class (%) | 0.18 | 1.37 | 4.74 | 11.49 | 13.08 | 9.95 | 6.84 | <0.01 |
| Mother smoked during pregnancy (%) | 53.34 | 39.39 | 24.05 | 17.35 | 14.44 | 16.07 | 26.26 | <0.01 |
| Mother used antenatal care after 1st trimester (%) | 38.73 | 28.8 | 22.58 | 22.02 | 22.55 | 23.12 | 25.08 | <0.01 |
| Mother’s height (mean, cm) | 163.2 | 163.4 | 164.2 | 164.2 | 164.1 | 162.9 | 163.9 | <0.01 |
| Mother breastfed cohort child (%) | 38.79 | 53.87 | 65.23 | 74.27 | 77.56 | 81.21 | 65.2 | <0.01 |
| % of observations | 9.5 | 18.2 | 28.6 | 28.4 | 13.5 | 1.9 | 100.0 | |
| Number of observations | 818 | 1,964 | 3,252 | 3,606 | 1,709 | 251 | 11,600 | |
Note: Results for the MCS are weighted to account for its complex survey design. Maternal age: mean 28.2; sd 6.1. P-value (for test of uniform distribution across maternal age categories) from a chi-square test for all variables except mother’s height, for which the P-value was obtained by testing the age coefficients jointly in a linear regression (null hypothesis: all age coefficients are zero).
The birth order distribution at advanced maternal ages changed markedly across cohorts. In the 1958 and 1970 cohorts, over 70% of births occurring at maternal ages 40 and above were third or higher parity births, and 9% and 13% were, respectively, first births. In the 2001 cohort, less than 50% of births were third or higher parity births and 18% were first births. For maternal age 35–39 the picture is similar.
Cohort differences also emerged for the socio-demographic profiles of older mothers. Over time, the women who gave birth at advanced maternal ages have become more advantaged than the women who gave birth at younger ages. In 2001 older mothers were more likely than younger mothers to have high level of education and a high household income. Conversely, the maternal age gradients of socio-demographic variables in the 1958 and 1970 cohort studies were less pronounced.
Regression analyses
Table 4 shows standardised maternal age coefficients for all of the regression models; Figure 1 illustrates the results for the key coefficients. Appendix Table 1 shows the full set of covariates in each model (available as Supplementary data at IJE online).
Linear Models Regressing Cognitive Ability on Maternal Age at Birth and Child and Family Characteristics, by Cohort Study
| Model 1: baselinea | Model 2: baseline + birth orderb | Model 3: baseline + birth order + socio-demographic characteristicsc | |||||||||
|---|---|---|---|---|---|---|---|---|---|---|---|
| Maternal age | 1958 | 1970 | 2001 | 1958 | 1970 | 2001 | 1958 | 1970 | 2001 | ||
| <20 | −0.314*** | −0.354*** | −0.288*** | −0.538*** | −0.566*** | −0.433*** | −0.348*** | −0.289*** | −0.171*** | ||
| 20–24 | −0.127*** | −0.150*** | −0.240*** | −0.244*** | −0.254*** | −0.279*** | −0.151*** | −0.107*** | −0.131*** | ||
| 25–29 | reference | reference | reference | reference | reference | reference | reference | reference | reference | ||
| 30–34 | −0.002 | −0.045 | 0.106*** | 0.118*** | 0.074** | 0.145*** | 0.096*** | 0.059* | 0.041 | ||
| 35–39 | −0.063* | −0.115** | 0.162*** | 0.142*** | 0.052 | 0.243*** | 0.129*** | 0.035 | 0.101*** | ||
| 40+ | −0.117* | −0.082 | 0.084 | 0.124** | 0.094 | 0.208*** | 0.098* | 0.095 | 0.051 | ||
| R squared | 0.02 | 0.02 | 0.03 | 0.07 | 0.05 | 0.06 | 0.15 | 0.14 | 0.102 | ||
| Prob > Fd | <0.01 | <0.01 | <0.01 | <0.01 | <0.01 | <0.01 | <0.01 | <0.01 | <0.01 | ||
| N | 10,969 | 9,362 | 11,600 | 10,969 | 9,362 | 11,600 | 10,969 | 9,362 | 11,600 | ||
Note: *** P < 0.01, ** P < 0.05, * P < 0.1. aAdjusted for cohort member sex and multiple birth. bAdjusted for cohort member sex, multiple birth and birth order. cAdjusted for cohort member sex, multiple birth, birth order, mother’s education, mother’s marital status at the time of birth, father’s social class, mother’s smoking during pregnancy, mother had antenatal care after 12 weeks of pregnancy, mother’s height and breastfeeding. Results for the MCS are weighted to account for its complex survey design. d Prob > F: P-values from a Wald test on the maternal age coefficients (null hypothesis: all age coefficients are zero).
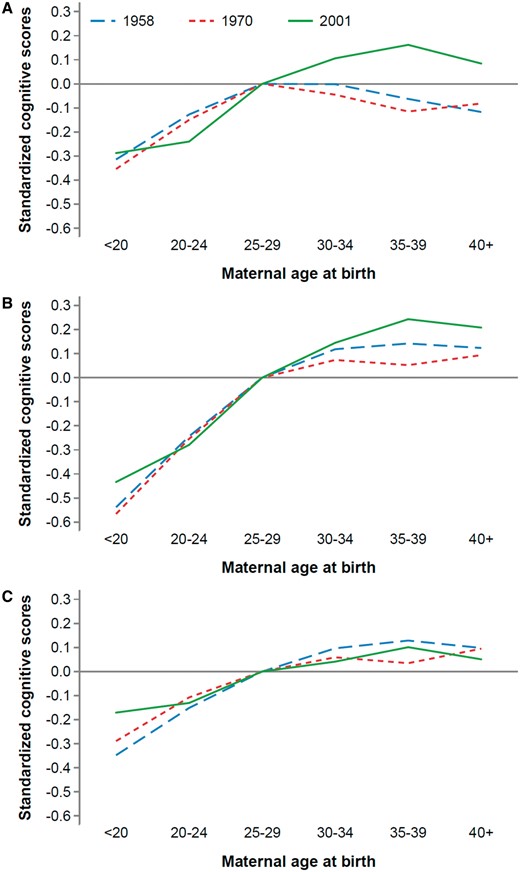
Coefficients from regression models of cognitive ability on maternal age; Model 1 (Panel A), Model 2 (Panel B) and Model 3 (Panel C). 1958, 1970, and 2001 refer to the 1958, 1970 and 2001 Cohort Studies. Panel A: Model 1 adjusted for cohort member sex and multiple birth. Panel B: Model 2 adjusted for cohort member sex, multiple birth and birth order. Panel C: Model 3 adjusted for cohort member sex, multiple birth, birth order, mother’s education, mother’s marital status at the time of birth, father’s social class, mother’s smoking during pregnancy, mother had antenatal care after 12 weeks of pregnancy, mother’s height and breastfeeding. Results for the MCS are weighted to account for its complex survey design.
Model 1 shows the unadjusted association between maternal age and children’s cognitive ability (Figure 1, Panel A). In the 1958 and 1970 cohorts, children born to mothers aged 25–29 scored higher than children born to older mothers. For example, in both cohorts maternal age 35–39 was associated with worse cognitive ability scores than maternal age 25–29 (1958 cohort β = −0.06, 95% CI: −0.13, 0.00, P-value = 0.06; 1970 cohort β = −0.12, 95% CI: −0.20, −0.03, P-value = 0.012). In contrast, the results for the 2001 cohort study show that the children born to mothers aged 30–34 and 35–39 had better cognitive outcomes than the children born to mothers aged 25–29 (e.g. for the age group 35–39, β = 0.16, 95% CI: 0.09, 0.23, P-value < 0.001). Therefore, the unadjusted results document a secular change in the association between advanced maternal age and children’s cognitive ability.
Model 2 includes the adjustment for birth order (Figure 1, Panel B). The results for the 1958 and 1970 cohorts showed striking changes. For these early cohorts, the association between advanced maternal age and children’s cognitive ability went from negative in Model 1 to clearly positive in Model 2. For example, in the NCDS 1958 cohort the association between being born to a mother aged 40 and above and cognitive ability went from β = −0.12, (95% CI: -0.24, -0.00, P-value = 0.06) to β = 0.12 (95% CI: 0.00, -0.24, P-value = 0.044). The maternal age gradient for the 2001 cohort became only slightly more pronounced.
Model 3 presents the fully adjusted results: in addition to birth order we included adjustments for maternal and family characteristics (Figure 1, Panel C). The 2001 cohort shows the most striking difference between the results of this model and those of Models 1 and 2. After adjusting for socio-demographic characteristics, the positive association between advanced maternal age and children’s cognitive ability was attenuated. For example, the association between maternal ages 35–39 and children’s cognitive ability went from β = 0.16 (95% CI: 0.09, 0.23, P-value < 0.001) in Model 1 to β = 0.10 (95% CI: 0.04, 0.16, P-value < 0.001) in Model 3. The age gradients of the 1958 and 1970 cohorts showed only minor changes compared with Model 2.
The pooled results (Table 5) for the unadjusted model show important differences in the 35–39 coefficients between the 2001 and 1958/1970 cohorts and for the 40+ coefficients between the 2001 and 1958 cohorts. After the adjustments for parental characteristics, there were no longer cross-cohort differences in the association between advanced maternal age and cognitive ability. We used the pooled model to also test for overall (all-age) cohort differences. Hypotheses of the equality of age coefficients based on Model 1 were strongly rejected for all cohort pairs with P-values smaller than 0.001. For Model 3, there were no differences in the 1958–2001 and the 1958–70 cohort pairs, whereas there were some residual differences in the 1970–2001 comparison (P-value: = 0.024).
Difference (with 95% confidence intervals) in the association between advanced maternal age and cognitive ability across Cohort Studies. Results obtained from a pooled model with interaction terms
| Advanced maternal age: 35–39 | 1970 vs. 1958 (reference) | 2001 vs. 1958 (reference) | 2001 vs. 1970 (reference) |
|---|---|---|---|
| Model 1: Baselinea | −0.052 [−0.170, 0.065] | 0.225 [0.126, 0.321] | 0.277 [0.153, 0.394] |
| Model 3: Baseline + birth order + socio- demographic characteristicsb | −0.094 [−0.207, 0.016] | −0.028 [−0.116, 0.068] | 0.066 [−0.044, 0.172] |
| Advanced maternal age: 40+ | 1970 vs. 1958 (reference) | 2001 vs. 1958 (reference) | 2001 vs. 1970 (reference) |
| Model 1: Baselinea | 0.035 [−0.174, 0.246] | 0.201 [0.012, 0.413] | 0.166 [−0.039, 0.396] |
| Model 3: Baseline + birth order + socio- demographic characteristicsb | −0.003 [−0.188, 0.199] | −0.047 [−0.223, 0.153] | −0.044 [−0.238, 0.168] |
Note: Results were obtained by including in the pooled model interaction terms between maternal age categories and the cohort study. The standard errors were bootstrapped. The reference category in each cohort was maternal age 25–29. aAdjusted for cohort member sex and multiple birth. bAdjusted for cohort member sex, multiple birth, birth order, mother’s education, mother’s marital status at the time of birth, father’s social class, mother’s smoking during pregnancy, mother had antenatal care after 12 weeks of pregnancy, mother’s height and breastfeeding.
Sensitivity analyses
We replicated the analyses with linear and quadratic terms for maternal age, with ages 20–24 as the reference; we excluded twins and triplets, and adjusted the models for birthweight. For the 2001 cohort, we included adjustment for other family characteristics such as family income, ethnicity and drinking during pregnancy, and excluded Northern Ireland from the analysis. The results changed only marginally across these checks.
Discussion
Previous research on being born to an older mother and cognitive ability is inconclusive.7 We hypothesised that because the social meaning associated with having children at older ages has changed markedly over time,29 the period of analysis could contribute to explain why research on this topic has generated mixed results. To test this hypothesis, we analysed the association between advanced maternal age and children’s cognitive ability over time within the UK context and using data from the 1958 National Child Development Study, the 1970 British Cohort Study and the 2000–2002 Millennium Cohort Study UK birth cohorts.
The results were consistent with our hypothesis. The unadjusted results showed a marked secular trend in the association between advanced maternal age and children’s cognitive ability. The association between advanced maternal age and children’s cognitive ability went from negative in the 1958 and 1970 cohorts to positive in the 2001 cohort. The negative association in the earlier cohorts appears to be associated with the fact that the children born to older mothers in these cohorts were more likely to have been high parity births than their counterparts in the 2001 cohort. High birth order can be associated with lower cognitive ability for three complementary reasons. First, first-born children have better cognitive outcomes than later-born children, potentially because they have greater access to parental resources.25 Second, the advantage of being first (or second) born was stronger in the 1958 and 1970 cohorts than in the 2001 cohort. Third, previous research documents a negative relationship between sibship size and children’s cognitive ability since larger families tend to be poorer,30 a finding which is supported in our data (Appendix Table 2, available as Supplementary data at IJE online). The positive association between advanced maternal age and children’s cognitive ability found in the 2001 cohort appears to be largely explained by the selected and advantaged profiles of the older mothers in this cohort. In the fully adjusted model, as shown in the pooled results, the cohort differences were eliminated. The residual association between maternal age and cognitive ability in the fully adjusted model within each cohort could reflect unmeasured parental characteristics (e.g. parental cognitive ability which is passed on genetically to the offspring, parenting styles, aspirations) or causal effects.7
This study has three major contributions and implications. First, the results show that heterogeneity in the characteristics of women who give birth at advanced ages can help to reconcile the existing controversial evidence on the association between maternal age and children's cognitive ability. Moreover, the findings suggest that future studies on the association between advanced maternal age and child well-being should pay attention to the period under consideration, since the nature and the consequences of childbearing at advanced maternal ages have changed markedly over time. Second, they illustrate that properly adjusting for factors associated with maternal age, such as socioeconomic position and birth order, helps to reconcile findings from different time periods and studies. Third, the results indicate that, among children born around the year 2001 and potentially also after that, those born to older mothers may be expected to have better outcomes than the children being born to mothers aged 25–29, and that the magnitude of this association could be important for longer-term well-being. Based on previous studies, a difference of 0.16 of a standard deviation, i.e. the magnitude of the cognitive score coefficients for mothers aged 35–39 in the 2001 cohort unadjusted model, could be associated with up to a 5% increase/decrease in all-cause mortality.31 Although this is not a very strong association, its population-level importance should not be underestimated given the substantial increase in births at advanced maternal ages documented in developed countries since the 1980s.
This study has several strengths. First, we used three high-quality and representative surveys, which enabled us to undertake a cross-cohort comparison. Second, we relied on measures of cognitive ability that are comparable across cohorts, since they all measured verbal ability and were administered when the cohort members were around the same age. Third, we were able to describe and analyse cohort differences in the characteristics of older mothers, which enabled us to largely partially explain the cross-cohort differences in the association between advanced maternal age and children’s cognitive ability.
This study also has limitations. First, because this study is focused exclusively on the UK, we were unable to assess to what extent the findings might be generalisable to other contexts. However, we expect that similar patterns would be observed in other developed contexts where older mothers have also become more advantaged over time. Second, because the number of births to mothers aged 40 and above is small, especially in the BCS 1970 cohort study, the parameters may not have been precisely estimated. Nonetheless, a consistent pattern emerged when we considered mothers who gave birth at ages 35–39, a group that did not raise issues of statistical power. Third, paternal age is unavailable when the father was not present at birth/interview. Therefore including this variable would reduce the sample size, in particular in the 2001 cohort (by 14%) where the prevalence of childbearing outside of marriage was higher than in the previous cohorts. Maternal and paternal ages tend to be highly associated,11 but the relative importance of maternal and paternal ages might have also changed over time and testing for this possibility would require different data. Fourth, the most recent cohort was born in 2001 and, therefore, we were unable to say whether the trends observed between 1958 and 2001 have continued after the year 2001.
To the best of our knowledge, this is the first study to document secular trends in the association between advanced maternal age and children’s cognitive ability, and to show that the period considered constitutes an important source of variation across studies. Our results also show that the maternal age and children’s well-being association is largely driven by the association between maternal age and socio-demographic characteristics, which might vary across time and contexts and across subpopulation groups within the same context.32 To reinforce these findings, future studies should replicate the analyses using other outcomes, looking at other contexts and groups within the same context or time period for whom the nature and consequences of childbearing at older ages might differ.
Supplementary Data
Supplementary data are available at IJE online.
Author Contributions
All authors contributed to the design of the study. AG and DS performed the data analysis. All authors interpreted the results. AG drafted the paper. MM and DS reviewed and edited the paper.
We hypothesise that the existing evidence on the association between advanced maternal age–defined here as giving birth at ages 35 and above–and children’s cognitive ability has generated mixed evidence because previous studies have analysed it in differing time periods.
We studied secular trends in the association between maternal age and cognitive ability using three UK cohort studies: the 1958 NCDS, the 1970 BCS and the 2001 MCS.
The association between being born to an older mother and child cognitive ability went from slightly negative for children born in the 1950–70s to clearly positive for children born after the year 2000.
These cross-cohort differences were explained by the fact that in the earlier cohorts, advanced maternal age was associated with high parity, whereas in the 2001 cohort it is associated with socioeconomically advantaged family background.
The time period considered and secular changes in the social meaning of having children at older ages can constitute important factors in determining the association between maternal age and cognitive ability.
Acknowledgments
We thank the 1958 NCDS, 1970 BCS, and 2001 MCS families for their time and cooperation, as well as the Centre for Longitudinal Studies at the Institute of Education at University College London. The cohort data are deposited in the UK Data Archive. The UK Economics and Social Research Council funded the 1958 National Child Development Study (study director Prof Alissa Goodman), the 1970 British Cohort Study (study director Prof Alice Sullivan) and the Millennium Cohort Study (study director Prof Emla Fitzsimons). Neither the study teams nor the Data Archive bear any responsibility for the analyses or interpretation of the data.
Funding
This work has been funded through European Research Council Grant 336475 (COSTPOST).
Conflict of interest: None declared.
References

