


How did the study come about?
Ecological studies conducted in the 1980s demonstrated a close geographic correlation between death rates from coronary heart disease during the years 1968–78 in different parts of England and Wales and the infant mortality rate in these areas 60 years earlier.1 These studies suggested that adverse environmental influences acting in utero and during infancy might increase the risk of cardiovascular disease in later life. However, this hypothesis required investigation using more robust epidemiological techniques. To yield results within a relatively short space of time, a cohort study was needed which linked information about the early environment of individuals born at least 60 years earlier to their health outcomes in later life. As part of a nationwide search of archives, staff working at the MRC Environmental Epidemiology Unit (MRC EEU), University of Southampton, discovered a large set of records maintained in Hertfordshire during the early 20th century.
The Hertfordshire records
In the early 20th century, there was widespread concern about the physical deterioration of the British people.2 In 1911, Ethel Margaret Burnside (Hertfordshire's first ‘chief health visitor and lady inspector of midwives’) assembled a team of midwives and nurses charged with improving the health of children in Hertfordshire.
A midwife attended women during childbirth and recorded the birth weight of their offspring on a card. A health visitor subsequently went to each baby's home throughout its infancy and recorded its illnesses, development and method of infant feeding; the baby was then weighed again at 1 year of age. This information was transcribed into ledgers at the Hertfordshire county office (Figure 1). The ledgers cover all births in Hertfordshire from 1911 until the NHS was formed in 1948.
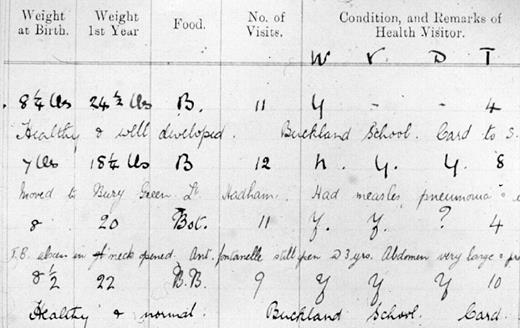
An extract from the Hertfordshire ledgers
Studies based on men and women born in Hertfordshire between 1911 and 1930
The MRC EEU computerized the Hertfordshire ledgers and used the National Health Service Central Register (NHSCR) to identify mortality outcomes by the end of 1992 for 15000 men and women born in Hertfordshire between 1911 and 1930. Increased risk of death from cardiovascular disease was found to be related to low birth weight in these men and women, and to low weight at 1 year among the men.3 This was the first study based on individual (rather than ecological) level data to demonstrate such relationships. Having studied mortality, the next stage was to explore the relationship between the early environment and a range of morbidity outcomes in surviving members of the cohort.
Detailed physiological investigations of men and women born in Hertfordshire between 1920 and 30 and still living there in the early 1990s were conducted. These studies ranged in size from 224 to 468 men, and 189 to 306 women. Small size at birth and during infancy was shown to be associated with increased risk of developing coronary heart disease and type II diabetes mellitus,4,5 the metabolic syndrome and insulin resistance,6 osteoporosis7 and sarcopenia8 in later life. These studies led to the ‘developmental origins’ hypothesis which states that the nourishment a baby receives from its mother during pregnancy, and its nutrition and illnesses in infancy and early childhood, determine its susceptibility to disease in later life.
Men and women born in Hertfordshire between 1931 and 1939: the Hertfordshire Cohort Study
The early Hertfordshire studies described above were important for establishing relationships between the early environment and physiological markers of disease but (i) they were too small a sample for investigation of the early environment and adult risk factors in the aetiology of clinical outcomes (such as incident or fatal coronary heart disease, cerebrovascular disease or osteoporotic fracture); (ii) the sample size was inadequate for research into gene–environment interactions; (iii) detailed information on adult anthropometry and diet was unavailable; and (iv) the men and women born before 1930 were becoming too frail to take part in further studies. As a consequence, a younger cohort of 3000 men and women born in Hertfordshire between 1931 and 1939, and included in the Hertfordshire records described above, were recruited to a new Hertfordshire Cohort Study (HCS); the rest of this article relates to this study.
Principal investigators and funding
The Hertfordshire Cohort Study was established by David Barker (principal investigator) and members of the Hertfordshire Cohort Study Group based at the MRC EEU, University of Southampton. In 2003, direction was passed to Cyrus Cooper and based in the reconfigured MRC Epidemiology Resource Centre, University of Southampton. The Medical Research Council was the principal source of funding, but this multistakeholder study has also received grants from the British Heart Foundation, Arthritis Research Campaign, National Osteoporosis Society, Wellcome Trust, and University of Southampton.
What does the Hertfordshire Cohort Study cover?
The principal objective of the Hertfordshire Cohort Study is to evaluate interactions between the genome, the intrauterine and early postnatal environment, and adult diet and lifestyle in the aetiology of chronic disorders in later life (cardiovascular disease, type II diabetes mellitus and obesity; osteoporosis, osteoarthritis and sarcopenia). The study aims to place these interactions within a life-course model for disease pathogenesis, and to characterize the physiological mechanisms underlying the pathways to these chronic disorders e.g. resetting of hypothalamic–pituitary–adrenal and GH/IGF-I axes.
Who is in the Hertfordshire Cohort Study sample?
The recruitment of the HCS participants is shown in Figure 2. The ledgers contained records for 42 974 births in Hertfordshire between 1931 and 1939; 39 764 of these were live born. Multiple births, deaths during childhood, records with missing birth weight or weight at 1 year, or with insufficient tracing information were excluded and the details of the remaining 24 130 boys and girls were sent for tracing by the National Health Service Central Register (NHSCR) in Southport. A total of 8650 men and women were traced as still alive in Hertfordshire in 1998 and the Hertfordshire Family Health Services Authority (FHSA) confirmed that 7106 of these were currently registered with a Hertfordshire General Practitioner (GP); these men and women comprised the HCS target population. Permission to contact 6099 (86%) men and women by letter was obtained from their GPs and 3225 (53%) agreed to a home interview with a trained research nurse. Subsequently, 2997 (93%) men and women attended a clinic for detailed physiological investigations. The HCS is county-wide and was conducted in phases according to Hertfordshire's county divisions (East, North, and West); the small South Hertfordshire division was excluded because its boundaries altered over time, causing confusion. Of the 1412 subjects who attended clinic in East Hertfordshire, 966 (68%) returned for a dual energy X-ray absorptiometry (DXA) bone scan and knee radiography. The HCS has ethical approval from the Hertfordshire and Bedfordshire Local Research Ethics Committee and all subjects have given written informed consent.
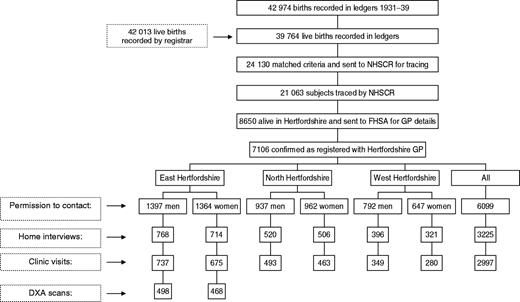
Recruitment of the Hertfordshire Cohort Study participants
How often have they been followed up?
The HCS is the first contact with these 3000 men and women since childhood. A follow-up study of musculoskeletal outcomes (bone loss rates, sarcopenia and fracture) among the East Hertfordshire study participants is ongoing. The entire cohort is also being followed up through primary care and hospital records over a 10-year period (1998–2007), for clinical outcomes including incident coronary heart disease, cerebrovascular disease, chronic airflow obstruction and fracture. The cohort members are flagged with the NHS Central Register for notification of deaths.
What has been measured?
Data collected in the HCS are outlined in Tables 1 and 2. All interviews and physiological investigations are carried out according to strict protocols and studies of within- and between-observer variation have been conducted at regular intervals during the fieldwork to ensure comparability of measurements obtained over several years. A subgroup of 120 East Hertfordshire men have also participated in detailed studies of hypothalamic–pituitary–adrenal9 and GH/IGF-I axis activity; details are available on request. HCS baseline clinics were completed in late 2004 and data preparation is ongoing (Spring 2005); analyses and publications to date have focussed on births within the earlier cohort (1911–30) and on the east phase of the current HCS.
Data available from the Hertfordshire ledgers and HCS home interview
| Hertfordshire ledgers |
|---|
| Birth weight |
| Illnesses and development during infancy and early childhood |
| Weight at one year of age |
| Method of infant feeding |
| HCS home interview |
| Marital status |
| Age left full-time education |
| Accommodation |
| Family history including father's social class |
| Physical activity |
| Cigarette smoking and alcohol consumption |
| Obstetric history |
| Occupational history and current social class |
| Rose/WHO chest pain and leg pain questionnaires |
| Severe chest pain and previous coronary surgery |
| Respiratory symptoms (MRC questionnaire) |
| Fracture history (own and of parents and siblings) |
| Lower back pain |
| Medical history (including stroke and diabetes) |
| Current medications |
| Falls |
| Self-rated general health |
| SF-36 health related quality of life |
| Hospital anxiety and depression (HAD) scores |
| Current diet assessed using an administered food frequency questionnaire and 24 h food diary |
| Nutrient intake from dietary supplements |
| Prostate symptoms |
| Social support and networks |
| Job effort–reward and demand–control |
Data available from the HCS clinic visit and DXA study
| HCS clinic |
| Height, weight, waist, hip, mid-upper arm and thigh circumferences |
| Triceps, biceps, subscapular, and suprailiac skinfold thicknesses (Harpenden calipers) |
| Blood pressure and pulse rate (Dinamap recorder) |
| Lung function (FEV1 and FVC, Micro Spirometer, Micro Medical) |
| Standard 12-lead electrocardiography (1982 Minnesota protocol) |
| Venous blood samples after 12 h overnight fast: |
| Glucose |
| Insulin and proinsulin precursors |
| Total, HDL, and LDL cholesterol |
| Triglycerides |
| Apolipoprotein A1 and B |
| Vitamin C |
| Frozen plasma and sera stored for future measurements |
| 2 h-timed 75 g oral glucose tolerance test Glucose and insulin 309 and 1209 post load |
| DNA extracted from whole blood samples |
| Timed overnight urine collection |
| Grip strength (Jamar hand-grip dynamometer) |
| Quadriceps strength (West Hertfordshire only, Lafayette MMT strength system) |
| Timed 6 m up-and-go test and 3 m walk |
| Chair rises |
| Timed one-legged stand |
| Clinical hand examination for pain, swelling, and tenderness |
| HCS DXA study (East Hertfordshire) |
| Bone mineral density at lumbar spine and proximal femur (Hologic QDR4500) |
| Radiographs of both knees (standing antero-posterior and lateral) |
| Knee pain questionnaire |
What is attrition like?
Attrition from the ledgers to clinics has been described above (Figure 2); as in any epidemiological study, the representativeness of the participants is open to question. We have addressed this by comparing the socioeconomic, anthropometric, medical, and functional characteristics of participants in the east phase of HCS with those in the nationally representative Health Survey for England (HSE). We have also assessed response bias between different stages of the HCS.
We accessed the 199610,11 and 199812,13 HSE datasets from the ESRC UK data archive (www.data-archive.ac.uk). Characteristics of the HCS and HSE study populations were compared, and response bias was assessed within HCS, using t, Mann–Whitney and χ2 tests. Analyses were carried out using Stata 8.14
Comparison of HCS and HSE participants
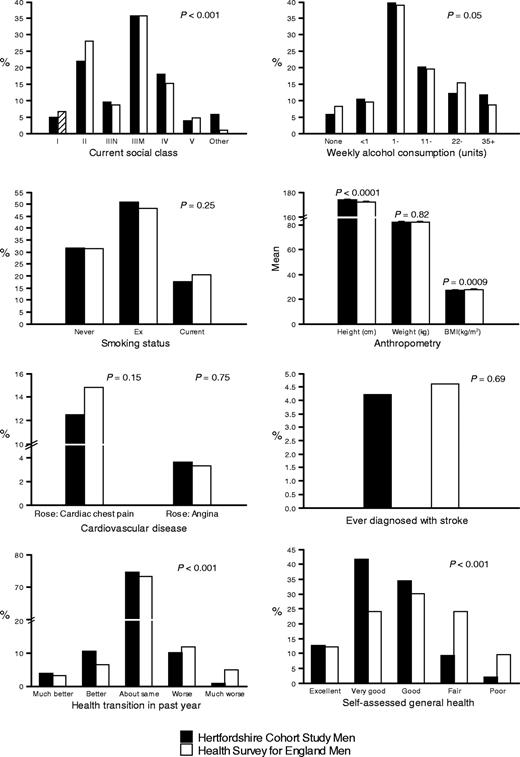
HCS participants were generally comparable with those in the nationally representative HSE (Figures 3 and 4) although some differences were identified; most notably, HCS participants were less likely to be in the extremes of the socioeconomic distribution, were taller, had better self-reported general health (SF-36), and HCS women were less likely to be current smokers or heavy drinkers. However, the absolute differences were small and the significant P-values for differences between the two study populations will have arisen, in part, from the large sample size studied. Birth weight data were unavailable in HSE but the birth weights in the MRC National Survey of Health and Development (a 1946 national birth cohort) were similar to those in HCS.15
Characteristics of Hertfordshire Cohort Study and Health Survey for England men
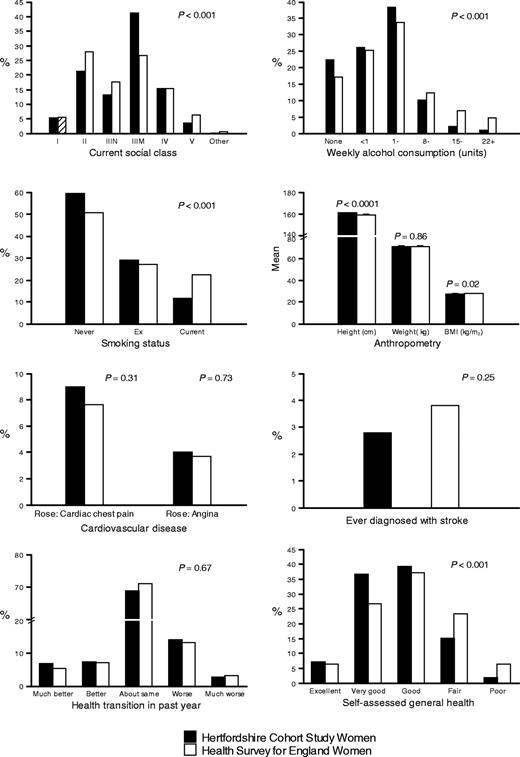
Characteristics of Hertfordshire Cohort Study and Health Survey for England women
Response bias within HCS
Birth weight and weight at 1 year of age were similar in men and women in the East HCS target population (i.e. those confirmed as registered with a Hertfordshire GP) but who did not participate in the home interview [mean and standard deviation (SD) birth weight and weight at 1 year: 3.5 kg (0.6), 10.1 kg (1.1) in 992 men and 3.4 kg (0.5) and 9.6 kg (1.0) in 733 women], and among those who were in the target population and did participate in the home interview [mean (SD) birth weight and weight at 1 year: 3.5 kg (0.6), 10.2 kg (1.1) in 768 men and 3.4 kg (0.5) and 9.7 kg (1.0) in 714 women].
Men and women who progressed from the home interview to clinic tended to smoke less, and had better self-reported function and general health than those participating only in the home interview (Tables 3 and 4). Similar response bias patterns were evident between the clinic and DXA study (data not shown).
Response bias between the HCS home interview and clinic: socioeconomic and medical characteristics
| Men | Women | |||||||
|---|---|---|---|---|---|---|---|---|
| Percentage distribution | Home interview only (n = 31) | Took part in clinic (n = 737) | Home interview only (n = 39) | Took part in clinic (n = 675) | ||||
| Social Class (head of household) | ||||||||
| I | 3.2 | 5.0 | 2.6 | 5.5 | ||||
| II | 29.0 | 21.7 | 25.6 | 21.0 | ||||
| IIIN | 6.5 | 9.8 | 23.1 | 12.6 | ||||
| IIIM | 19.4 | 36.5 | 33.3 | 41.6 | ||||
| IV | 29.0 | 17.5 | 10.3 | 15.7 | ||||
| V | 6.5 | 3.8 | 5.1 | 3.4 | ||||
| Forces/unknown | 6.5 | 5.7 | 0.0 | 0.2 | ||||
| P = 0.37 | P = 0.45 | |||||||
| Alcohol | ||||||||
| Non drinker | 16.1 | 5.4 | 47.4 | 21.0 | ||||
| <1 unit/week | 6.5 | 10.6 | 23.7 | 26.2 | ||||
| 1–10 M/1–7 F units/week | 35.5 | 39.9 | 26.3 | 39.0 | ||||
| 11–21 M/8–14 F units/week | 19.5 | 20.2 | 0.0 | 10.7 | ||||
| 22–34 M/15–21 F units/week | 12.9 | 12.2 | 0.0 | 2.2 | ||||
| 35+ M/22+ F units/week | 9.7 | 11.7 | 2.6 | 0.9 | ||||
| P = 0.25 | P = 0.002 | |||||||
| Smoking | ||||||||
| Never | 19.4 | 32.3 | 46.2 | 60.4 | ||||
| Ex | 48.4 | 50.9 | 25.6 | 29.1 | ||||
| Current | 32.3 | 16.8 | 28.2 | 10.5 | ||||
| P = 0.06 | P = 0.003 | |||||||
| Rose–Cardiac chest pain | 19.4 | 12.2 | 7.7 | 9.0 | ||||
| P = 0.24 | P = 0.78 | |||||||
| Rose–Grade 1 Angina | 6.5 | 3.4 | 5.3 | 3.9 | ||||
| P = 0.38 | P = 0.67 | |||||||
| Ever diagnosed stroke | 12.9 | 3.9 | 2.6 | 2.8 | ||||
| P = 0.01 | P = 0.94 | |||||||
Data were missing for a maximum of 1 woman who only took part in the home interview, 11 men who took part in the clinic, and 7 women who took part in the clinic.
Variables were tested using the χ2-test.
Rose–Rose chest pain questionnaire.
Data are from the east phase of HCS.
Response bias between the HCS home interview and clinic: functional characteristics
| Men | Women | |||||||
|---|---|---|---|---|---|---|---|---|
| Median (25th, 75th percentiles) | Home interview only (n = 31) | Took part in clinic (n = 737) | Home interview only (n = 39) | Took part in clinic (n = 675) | ||||
| SF-36 physical function | 90 (70, 95) | 95 (85, 100) | 77 (45, 90) | 85 (70, 95) | ||||
| P = 0.03 | P = 0.007 | |||||||
| SF-36 role physical | 100 (25, 100) | 100 (100, 100) | 100 (25, 100) | 100 (75, 100) | ||||
| P = 0.04 | P = 0.03 | |||||||
| SF-36 body pain | 72 (41, 100) | 84 (62, 100) | 72 (41, 100) | 72 (52, 100) | ||||
| P = 0.04 | P = 0.44 | |||||||
| SF-36 general health | 67 (40, 77) | 77 (67, 87) | 77 (47, 82) | 77 (65, 87) | ||||
| P = 0.0007 | P = 0.06 | |||||||
| SF-36 energy and vitality | 55 (40, 70) | 70 (60, 80) | 55 (40, 75) | 70 (50, 80) | ||||
| P = 0.0001 | P = 0.007 | |||||||
| SF-36 social functioning | 100 (63, 100) | 100 (100, 100) | 100 (63, 100) | 100 (88, 100) | ||||
| P = 0.004 | P = 0.02 | |||||||
| SF-36 role emotional | 100 (100, 100) | 100 (100, 100) | 100 (100, 100) | 100 (100, 100) | ||||
| P = 0.0004 | P = 0.33 | |||||||
| SF-36 mental health | 78 (68, 84) | 88 (76, 92) | 80 (60, 84) | 80 (68, 88) | ||||
| P = 0.001 | P = 0.07 | |||||||
| Percentage distribution | ||||||||
| Health transition in past | ||||||||
| year | ||||||||
| Much better | 3.2 | 3.8 | 7.7 | 6.8 | ||||
| Somewhat better | 12.9 | 10.6 | 2.6 | 7.7 | ||||
| About same | 48.4 | 75.6 | 59.0 | 69.5 | ||||
| Somewhat worse | 32.3 | 9.4 | 18.0 | 13.9 | ||||
| Much worse | 3.2 | 0.7 | 12.8 | 2.1 | ||||
| P < 0.001 | P = 0.001 | |||||||
| Self assessed general | ||||||||
| health | ||||||||
| Excellent | 6.5 | 12.9 | 10.3 | 7.0 | ||||
| Very good | 22.6 | 42.5 | 35.9 | 36.7 | ||||
| Good | 35.5 | 34.5 | 25.6 | 40.0 | ||||
| Fair | 25.8 | 8.6 | 20.5 | 14.8 | ||||
| Poor | 9.7 | 1.6 | 7.7 | 1.5 | ||||
| P < 0.001 | P = 0.03 | |||||||
Data were missing for one man who only took part in the home interview, and one man who took part in the clinic.
SF-36 domains were coded to 0–100 scores, with higher values indicating better functional status.
Domain scores were tested using the Mann–Whitney test.
Health transition and general health were tested using the χ2-test.
Data are from the east phase of HCS.
What has the Hertfordshire Cohort Study found?
Mortality
The 1911–30 and 1931–39 Hertfordshire cohorts were combined into a mortality database of 37 000 men and women; 7916 had died by the end of 1999. Higher birth weight was associated with decreased risk of circulatory disease mortality in men and women, and with decreased risk of mortality from accidental falls in men, and decreased risk of mortality from pneumonia, injury, diabetes, and musculoskeletal disease in women.16 This was not counterbalanced by an increased risk of other causes of death.
Osteoporosis
In the HCS DXA study, birth weight was positively associated with bone mineral content in men and women, and relationships with weight at 1 year were even stronger. Models of DXA measurements on weight at birth, 1 year and in adulthood demonstrated that weight at each of these points in the life course is important in the determination of adult bone mass, with greater contributions of earlier growth to bone size and mineral content, than to bone mineral density.17
Sarcopenia
Relationships between weight at birth and one year of age and adult body mass index (BMI), fat-free mass (FFM), and fat mass were explored among men in the east phase of HCS.18 Birth weight was positively associated with BMI and FFM, but not fat mass. Weight at 1 year was associated with BMI, FFM, and fat mass. Previously reported relationships between birth weight and adult BMI may reflect prenatal influences on FFM rather than fat. The postnatal environment may be more influential in the development of obesity in later life.
Grip strength was strongly associated with birth weight in East HCS men and women, independent of adult height and weight. Associations with infant growth were weakened after allowing for adult size. These results suggest that sarcopenia may have its origins in early life, with influences of infant growth mediated through adult size.19
What are the main strengths and weaknesses of the study?
Strengths
Prospectively collected data on birth weight, weight at 1 year, and infant feeding and illnesses, in a cohort who are now of an age when prevalent and incident morbidity are common, are a unique resource for examining the long-term effects of growth in utero and during infancy on disease risk. Second, a detailed phenotypic characterization of participants is available, including physiological measurements (all measured according to strict protocol by trained fieldworkers) and sera are stored for future measurements. Third, follow-up for incident clinical events and mortality is ongoing. Fourth, the HCS DNA bank is an important national resource for studies of genes, and gene–environment interactions, as risk factors for obesity, cardiovascular and metabolic disease, osteoporosis, and musculoskeletal disorders. Finally, data entry, record keeping, computer processing, and statistical analyses have been carried out to an exceptionally high standard and an experienced multidisciplinary research team has ensured preparation of a high quality research database.
Weaknesses
First, HCS participants are local to Hertfordshire and losses have occurred at several stages of follow-up (Figure 2). However, mortality patterns in the Hertfordshire Cohort are broadly similar to England and Wales as a whole16 and the characteristics of HCS participants are broadly similar to those in the nationally representative Health Survey for England (Figures 3 and 4). On this basis, we suggest that results from HCS can be reasonably generalized to the wider population of older men and women in England. Second, evidence of a ’healthy’, or ‘health-aware’ responder bias was apparent in HCS; this was unsurprising.20,21 Such response bias would be a major concern only if the relationships between risk factors and disease outcomes differed systematically in men and women who participated fully in HCS and those who did not; this seems unlikely. Finally, birth weight is only a proxy for adaptations that a foetus may make to its body's structure, physiology, and metabolism in response to undernutrition in utero.
Data access and further information
The Hertfordshire Cohort Study Group has a long and successful history of conducting collaborative research4,22,23 and we welcome specific and detailed proposals for new collaborations. Initial enquiries should be made to Cyrus Cooper. (Principal Investigator).
The Hertfordshire Cohort Study Group includes Vanessa Cox, Sue Craighead, Clare Watson, Clare Statham, Shirley Simmonds, Sian Robinson, Sue Batelaan, David Phillips and Ian Day.
We thank the men and women who participated in the Hertfordshire studies, the Hertfordshire General Practitioners, and the nurses and doctors who conducted the home interviews, clinics, and DXA scans. We acknowledge the Joint Health Surveys Unit of Social and Community Planning Research and University College London as the original creators of the HSE 1996 dataset, and the Social and Community Planning Research group as the depositor of this dataset with the UK data Archive; the National Centre for Social Research and University College London, Department of Epidemiology and Public Health as the original creators of the HSE 1998 dataset, and the National Centre for Social Research as the depositor of this dataset with the UK data Archive; the Department of Health as the original source of funding for the 1996 and 1998 Health Surveys for England. The Joint Health Surveys Unit of Social and Community Planning Research; the National Centre for Social Research; University College London, Department of Epidemiology and Public Health; the UK data Archive; and the Department of Health bear no responsibility for our analysis and interpretation of the 1996 and 1998 Health Survey for England Datasets.
References
Barker DJP, Osmond C. Infant mortality, childhood nutrition and ischaemic heart disease in England and Wales.
Osmond C, Barker DJP, Winter PD, Fall CH, Simmonds SJ. Early growth and death from cardiovascular disease in women.
Hales CN, Barker DJP, Clark PMS et al. Fetal and infant growth and impaired glucose tolerance at age 64.
Fall CHD, Osmond C, Barker DJP et al. Fetal and infant growth and cardiovascular risk factors in women.
Barker DJP, Hales CN, Fall CHD, Osmond C, Phipps K, Clark PMS. Type 2 (non-insulin-dependent) diabetes mellitus, hypertension and hyperlipidaemia (Syndrome X): relation to reduced fetal growth.
Cooper C, Fall C, Egger P, Hobbs R, Eastell R, Barker D. Growth in infancy and bone mass in later life.
Sayer AA, Cooper C, Evans JR et al. Are rates of ageing determined in utero?
Ward AM, Syddall HE, Wood PJ, Chrousos GP, Phillips DI. Fetal programming of the hypothalamic-pituitary adrenal (HPA) axis: low birthweight and central HPA regulation.
Health Survey for England '96. Vol I: Findings and Vol II: Methodology and Documentation. In: Prescott-Clarke P and Primatesta P (eds). London: HMSO.
Joint Health Surveys Unit of Social and Community Planning Research and University College London, Health Survey for England,
Health Survey for England: cardiovascular disease, Vol 1: Findings and Vol 2: Methodology and Documentation. In: Erens B and Primatesta P (eds). London: HMSO.
National Centre for Social Research, University College London Department of Epidemiology and Public Health, Health Survey for England,
StataCorp. Stata Statistical Software Release 8.0. College Station, Texas: Stata Corporation,
Kuh D, Bassey J, Hardy R, Aihie Sayer A, Wadsworth M, Cooper C. Birth weight, childhood size, and muscle strength in adult life: evidence from a birth cohort study.
Syddall HE, Aihie Sayer A, Simmonds SJ et al. Birth weight, infant weight gain and cause-specific mortality: the Hertfordshire Cohort Study.
Dennison EM, Syddall HE, Sayer AA, Gilbody HJ, Cooper C. Birth weight and weight at one year are independent determinants of bone mass in the seventh decade: the Hertfordshire Cohort Study.
Sayer AA, Syddall HE, Dennison EM et al. Birth weight, weight at 1 year of age, and body composition in older men: the Hertfordshire Cohort Study.
Sayer AA, Syddall HE, Gilbody HJ, Dennison EM, Cooper C. Does sarcopenia originate in early life? Findings from the Hertfordshire Cohort Study.
Breslow NE and Day NE. Statistical Methods in Cancer Research. Vol II—The design and analysis of cohort studies. Lyon: World Health Organisation, International Agency for Research on Cancer,
Coggon D, Rose G, Barker DJP. Epidemiology for the Uninitiated. 4th edn. BMJ Publishing Group
Day IN, Chen XH, Gaunt TR et al. Late life metabolic syndrome, early growth, and common polymorphism in the growth hormone and placental lactogen gene cluster.

